 Actually, this post was planned as a short note about using
 NodeAffinity for Kubernetes Pod:
But then, as often happens, after starting writing about one thing, I faced another, and then another one, and as a result – I made this long-read post about Kubernetes load-testing.
So, I’ve started about NodeAffinity, but then wondered how will Kubernetes cluster-autoscaler work – will it take into account the NodeAffinity setting during new WorkerNodes creation?
To check this I made a simple load-test using Apache Benchmark to trigger Kubernetes HorizontalPodAutoscaler which had to create new pods, and those new pods had to trigger cluster-autoscaler to create new AWS EC2 instances that will be attached to a Kubernetes cluster as WorkerNodes.
Then I started a more complicated load-test and face an issue when pods stopped scaling.
And then… I decided that as I’m doing load-tests then it could be a good idea to test various AWS EC2 instance types – T3, M5, C5. And of course, need to add results to this post.
And after this – we’ve started full load-testing and face a couple of other issues, and obviously I had to write about how I solved them.
Eventually, this post is about Kubernetes load-testing in general, and about EC2 instance types, and about networking and DNS, and a couple of other things around the high-loaded application in a Kubernetes cluster.
Note: kk here: alias kk="kubectl" > ~/.bashrc
Contents
The Task
So, we have an application that really loves CPU.
PHP, Laravel. Currently, it’s running in DigitalOcean on 50 running droplets, plus NFS share, Memcache, Redis, and MySQL.
What do we want is to move this application to a Kubernetes cluster in AWS EKS to save some money on the infrastructure, because the current one in DigitalOcean costs us about 4.000 USD/month, while one AWS EKS cluster costing us about 500-600 USD (the cluster itself, plus by 4 AWS t3.medium EC2 instances for WorkerNodes in two separated AWS AvailabilityZones, totally 8 EC2).
With this setup on DigitalOcean, the application stopped working on 12.000 simulations users (48.000 per hour).
We want to keep up to 15.000 users (60.000/hour, 1.440.000/day) on our AWS EKS with autoscaling.
The project will live on a dedicated WorkerNodes group to avoid affecting other applications in the cluster. To make new pods to be created only on those WorkerNodes – we will use the NodeAffinity.
Also, we will perform load-testing using three different AWS Ec2 instance types – t3, m5, c5, to chose which one will better suit our application’s needs, and will do another load-testing to check how HorizontalPodAutoscaler and cluster-autoscaler will work.
Choosing an EC2 type
Which one to use for us?
- Т3? Burstable processors, good price/CPU/memory ration, good for most needs:
T3 instances are the next generation burstable general-purpose instance type that provides a baseline level of CPU performance with the ability to burst CPU usage at any time for as long as required. - М5? Best for memory consumable applications – more RAM, less CPU:
M5 instances are the latest generation of General Purpose Instances powered by Intel Xeon® Platinum 8175M processors. This family provides a balance of compute, memory, and network resources, and is a good choice for many applications. - С5? Best for CPU intended applications – more CPU cores, better processor, but less memory in compare to M5 type:
C5 instances are optimized for compute-intensive workloads and deliver cost-effective high performance at a low price per compute ratio.
Let’s start with the T3a – a bit cheaper than common T3.
EC2 AMD instances
AWS provides AMD-based processors instances – t3a, m5a, c5a – with almost the same CPU/memory/network they cost a bit less but are available not in every region and even not in all AvailabilityZones of the same AWS region.
For example, in the AWS region us-east-2 c5a are available in the us-east-2b and us-east-2c AvailabilityZones – but still can’t be used in the us-east-2a. As I don’t want to change our automation right now (AvailabilityZones are selected during provisioning, see the AWS: CloudFormation – using lists in Parameters) – then we will use the common T3 type.
EC2 Graviton instances
Besides that, AWS introduced m6g and c6g instance types with the AWS Graviton2 processors, but to use them your cluster have to meet some restrictions, check the documentation here>>>.
Now, let’s go ahead and create three WorkerNode Groups with t3, m5, and c5 instances and will check the CPU’s consumption by our application on each of them.
eksctl and Kubernetes WorkerNode Groups
The config file for our WorkerNode Groups look like next:
---
apiVersion: eksctl.io/v1alpha5
kind: ClusterConfig

metadata:
  name: "{{ eks_cluster_name }}"
  region: "{{ region }}"
  version: "{{ k8s_version }}"

nodeGroups:

  - name: "eat-test-t3-{{ item }}"
    instanceType: "t3.xlarge"
    privateNetworking: true
    labels: { role: eat-workers }
    volumeSize: 50
    volumeType: gp2
    desiredCapacity: 1
    minSize: 1
    maxSize: 1
    availabilityZones: ["{{ item }}"]
    ssh:
      publicKeyName: "bttrm-eks-nodegroup-{{ region }}"
    iam:
      withAddonPolicies:
        autoScaler: true
        cloudWatch: true
        albIngress: true
        efs: true
    securityGroups:
      withShared: true
      withLocal: true
      attachIDs: [ {{ worker_nodes_add_sg }} ]

  - name: "eat-test-m5-{{ item }}"
    instanceType: "m5.xlarge"
    privateNetworking: true
    labels: { role: eat-workers }
    volumeSize: 50
    volumeType: gp2
    desiredCapacity: 1
    minSize: 1
    maxSize: 1
    availabilityZones: ["{{ item }}"]
    ssh:
      publicKeyName: "bttrm-eks-nodegroup-{{ region }}"
    iam:
      withAddonPolicies:
        autoScaler: true
        cloudWatch: true
        albIngress: true
        efs: true
    securityGroups:
      withShared: true
      withLocal: true
      attachIDs: [ {{ worker_nodes_add_sg }} ]

  - name: "eat-test-c5-{{ item }}"
    instanceType: "c5.xlarge"
    privateNetworking: true
    labels: { role: eat-workers }
    volumeSize: 50
    volumeType: gp2
    desiredCapacity: 1
    minSize: 1
    maxSize: 1
    availabilityZones: ["{{ item }}"]
    ssh:
      publicKeyName: "bttrm-eks-nodegroup-{{ region }}"
    iam:
      withAddonPolicies:
        autoScaler: true
        cloudWatch: true
        albIngress: true
        efs: true
    securityGroups:
      withShared: true
      withLocal: true
      attachIDs: [ {{ worker_nodes_add_sg }} ]
Here we have three Worker Node groups, each with its own EC2 type.
The deployment is described using Ansible and eksctl, see the AWS Elastic Kubernetes Service: a cluster creation automation, part 2 – Ansible, eksctl post, in two different AvailabilityZones.
The minSize and maxSize are set to the 1 so our Cluster AutoScaler will not start to scale them – at the begging of the tests I want to see a CPU’s load on an only one EC2 instance and to run kubectl top for pods and nodes.
After we will choose the most appropriate EC2 type for us – will drop other WorkerNode groups and will enable the autoscaling.
The Testing plan
What and how we will test:
- PHP, Laravel, packed into a Docker image
- all servers have 4 CPU cores and 16 GB RAM (excluding C5 – 8 GB RAM)
- in the application’s Deployment with
requestswe will set to run an only one pod per a WorkerNode by asking a bit more them half on its CPU available, so Kubernetes Scheduler will have to place a pod on a dedicated WorkerNode instance - by using
NodeAffinitywe will set to run our pods only on necessary WorkerNodes - pods and cluster autoscaling are disabled for now
We will create three WorkerNode Groups with different EC2 types and will deploy the application into four Kubernetes Namespaces – one “default” and three per each instance type.
In each such a namespace, the application inside will be configured with NodeAffinity to be running on the necessary EC2 type.
By doing so, we will have four Ingress resources with the AWS LoadBalancer, see the Kubernetes: ClusterIP vs NodePort vs LoadBalancer, Services, and Ingress – an overview with examples, and we will have four endpoints for tests.
Kubernetes NodeAffinity && nodeSelector
Documentation – Assigning Pods to Nodes.
To chose on which WorkerNode Kubernetes has to run a pod we can use two label types – created by ourselves or those assigned to WorkerNodes by Kubernetes itself.
In our config file for WorkerNodes we have set such a label:
...
labels: { role: eat-workers }
...
Which will be attached to every EC2 created in this WorkerNode Group.
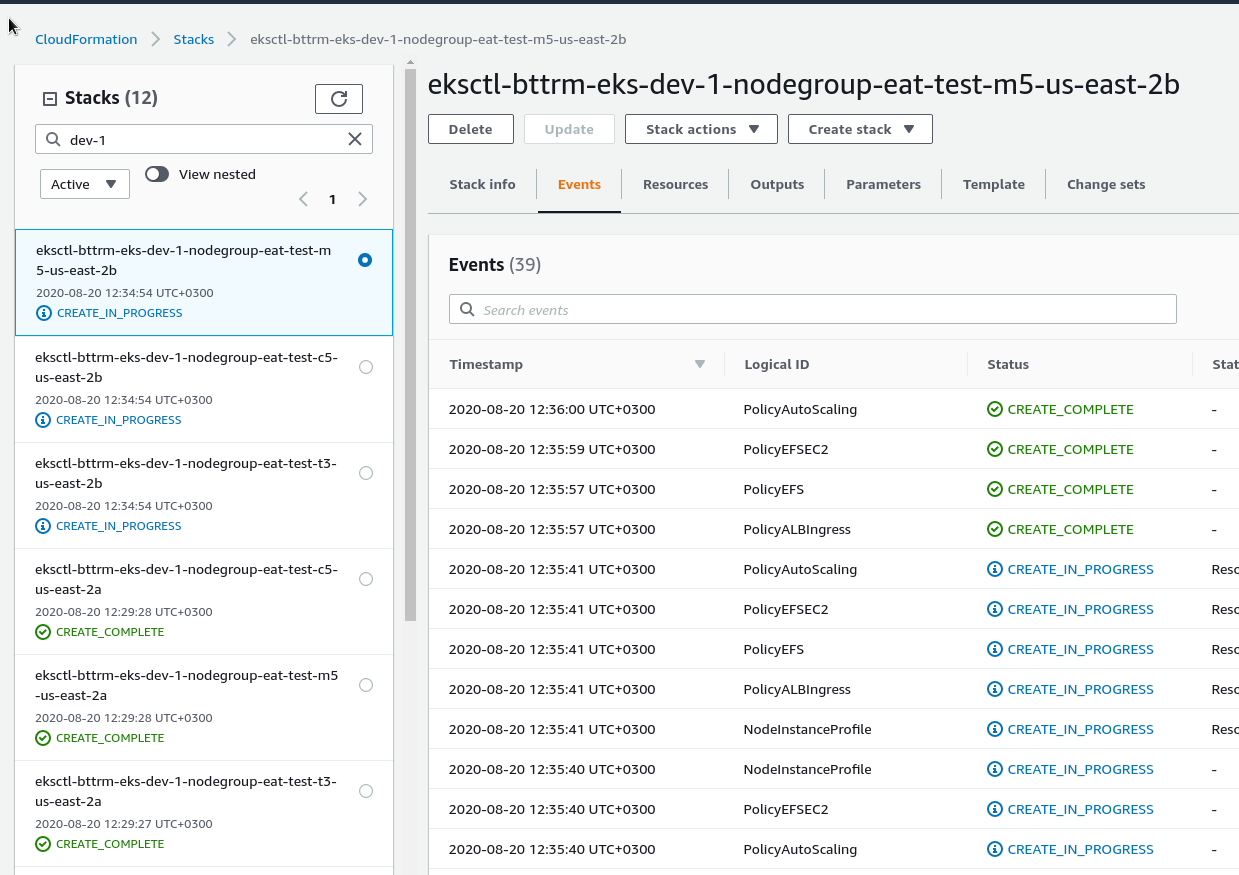
Update the cluster:
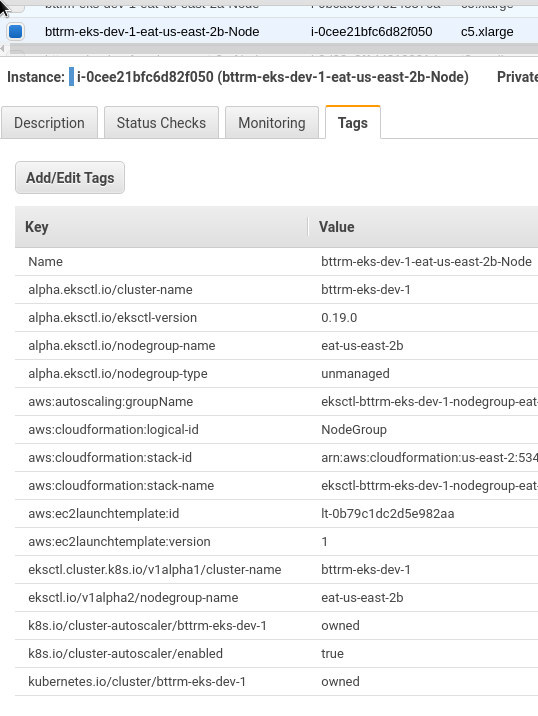
And let’s check all tags on an instance:
Let’s check WorkerNode Groups from the eksctl:
[simterm]
$ eksctl --profile arseniy --cluster bttrm-eks-dev-1 get nodegroups
CLUSTER         NODEGROUP               CREATED                 MIN SIZE        MAX SIZE        DESIRED CAPACITY        INSTANCE TYPE   IMAGE ID
bttrm-eks-dev-1 eat-test-c5-us-east-2a  2020-08-20T09:29:28Z    1               1               1                       c5.xlarge       ami-0f056ad53eddfda19
bttrm-eks-dev-1 eat-test-c5-us-east-2b  2020-08-20T09:34:54Z    1               1               1                       c5.xlarge       ami-0f056ad53eddfda19
bttrm-eks-dev-1 eat-test-m5-us-east-2a  2020-08-20T09:29:28Z    1               1               1                       m5.xlarge       ami-0f056ad53eddfda19
bttrm-eks-dev-1 eat-test-m5-us-east-2b  2020-08-20T09:34:54Z    1               1               1                       m5.xlarge       ami-0f056ad53eddfda19
bttrm-eks-dev-1 eat-test-t3-us-east-2a  2020-08-20T09:29:27Z    1               1               1                       t3.xlarge       ami-0f056ad53eddfda19
bttrm-eks-dev-1 eat-test-t3-us-east-2b  2020-08-20T09:34:54Z    1               1               1                       t3.xlarge       ami-0f056ad53eddfda19
[/simterm]
Let’s check created WorkerNode ЕС2 instance with the -l to select only those that have our custom label “role: eat-workers” and by sorting them by their EC2 types:
[simterm]
$ kk -n eks-dev-1-eat-backend-ns get node -l role=eat-workers -o=json | jq -r '[.items | sort_by(.metadata.labels["beta.kubernetes.io/instance-type"])[] | {name:.metadata.name, type:.metadata.labels["beta.kubernetes.io/instance-type"], region:.metadata.labels["failure-domain.beta.kubernetes.io/zone"]}]'
[
  {
    "name": "ip-10-3-47-253.us-east-2.compute.internal",
    "type": "c5.xlarge",
    "region": "us-east-2a"
  },
  {
    "name": "ip-10-3-53-83.us-east-2.compute.internal",
    "type": "c5.xlarge",
    "region": "us-east-2b"
  },
  {
    "name": "ip-10-3-33-222.us-east-2.compute.internal",
    "type": "m5.xlarge",
    "region": "us-east-2a"
  },
  {
    "name": "ip-10-3-61-225.us-east-2.compute.internal",
    "type": "m5.xlarge",
    "region": "us-east-2b"
  },
  {
    "name": "ip-10-3-45-186.us-east-2.compute.internal",
    "type": "t3.xlarge",
    "region": "us-east-2a"
  },
  {
    "name": "ip-10-3-63-119.us-east-2.compute.internal",
    "type": "t3.xlarge",
    "region": "us-east-2b"
  }
]
[/simterm]
See more about the kubectl output’s formatting here>>>.
Deployment update
nodeSelector by a custom label
At first, let’s deploy our application to all instances with the labels: { role: eat-workers } – Kubernetes will have to create pods on 6 servers – by two on each EC2 type.
Update the Deployment, add the nodeSelector with the role label with the “eat-workers” value:
apiVersion: apps/v1
kind: Deployment
metadata:
  name: {{ .Chart.Name }}
  annotations:
    reloader.stakater.com/auto: "true"
spec:
  replicas: {{ .Values.replicaCount }}
  strategy:
    type: RollingUpdate
  selector:
    matchLabels:
      application: {{ .Chart.Name }}
  template:
    metadata:
      labels:
        application: {{ .Chart.Name }}
        version: {{ .Chart.Version }}-{{ .Chart.AppVersion }}
        managed-by: {{ .Release.Service }}
    spec:
      containers:
      - name: {{ .Chart.Name }}
        image: {{ .Values.image.registry }}/{{ .Values.image.repository }}/{{ .Values.image.name }}:{{ .Values.image.tag }}
        imagePullPolicy: Always
...
        ports:
          - containerPort: {{ .Values.appConfig.port }}
        livenessProbe:
          httpGet:
            path: {{ .Values.appConfig.healthcheckPath }}
            port: {{ .Values.appConfig.port }}
          initialDelaySeconds: 10
        readinessProbe:
          httpGet:
            path: {{ .Values.appConfig.healthcheckPath }}
            port: {{ .Values.appConfig.port }}
          initialDelaySeconds: 10
        resources:
          requests:
            cpu: {{ .Values.resources.requests.cpu | quote }}
            memory: {{ .Values.resources.requests.memory | quote }}
      nodeSelector:
        role: eat-workers
      volumes:
      imagePullSecrets:
        - name: gitlab-secret
replicaCount is set to the 6, as per instances number.
Deploy it:
[simterm]
$ helm secrets upgrade --install --namespace eks-dev-1-eat-backend-ns --set image.tag=179217391 --set appConfig.appEnv=local --set appConfig.appUrl=https://dev-eks.eat.example.com/ --atomic eat-backend . -f secrets.dev.yaml --debug
[/simterm]
Check:
[simterm]
$ kk -n eks-dev-1-eat-backend-ns get pod -o=custom-columns=NAME:.metadata.name,STATUS:.status.phase,NODE:.spec.nodeName,TYPE:.spec.nodeSelector
NAME                                   STATUS    NODE                                        TYPE
eat-backend-57b7b54d98-7m27q   Running   ip-10-3-63-119.us-east-2.compute.internal   map[role:eat-workers]
eat-backend-57b7b54d98-7tvtk   Running   ip-10-3-53-83.us-east-2.compute.internal    map[role:eat-workers]
eat-backend-57b7b54d98-8kphq   Running   ip-10-3-47-253.us-east-2.compute.internal   map[role:eat-workers]
eat-backend-57b7b54d98-l24wr   Running   ip-10-3-61-225.us-east-2.compute.internal   map[role:eat-workers]
eat-backend-57b7b54d98-ns4nr   Running   ip-10-3-45-186.us-east-2.compute.internal   map[role:eat-workers]
eat-backend-57b7b54d98-sxzk4   Running   ip-10-3-33-222.us-east-2.compute.internal   map[role:eat-workers]
eat-backend-memcached-0        Running   ip-10-3-63-119.us-east-2.compute.internal   <none>
[/simterm]
Good – we have our 6 pods on 6 WorkerNodes.
nodeSelector by Kuber label
Now, let’s update the Deployment to use labels set by the Kubernetes itself, for example, we can use the beta.kubernetes.io/instance-type where we can set an instance type we’d like to use to deploy a pod only on an EC2 of the chosen type.
The replicaCount now is set to 2 as per instance of the same type – will have two pods running on two EC2.
Drop the deployment:
[simterm]
$ helm --namespace eks-dev-1-eat-backend-ns uninstall eat-backend
release "eatt-backend" uninstalled
[/simterm]
Update the manifest – add the t3, so both conditions will work – the role, and the instance-type:
...
      nodeSelector:
        beta.kubernetes.io/instance-type: t3.xlarge
        role: eat-workers
...
Let’s deploy them to three new namespaces, and let’s add a postfix to each of the – t3, m5, c5, so for the t3 group the name will be “eks-dev-1-eat–backend-ns-t3“.
Add the --create-namespace for Helm:
[simterm]
$ helm secrets upgrade --install --namespace eks-dev-1-eat-backend-ns-t3 --set image.tag=180029557 --set appConfig.appEnv=local --set appConfig.appUrl=https://t3-dev-eks.eat.example.com/ --atomic eat-backend . -f secrets.dev.yaml --debug --create-namespace
[/simterm]
Repeat the same for the m5, c5, and check.
The t3:
[simterm]
$ kk -n eks-dev-1-eat-backend-ns-t3 get pod -o=custom-columns=NAME:.metadata.name,STATUS:.status.phase,NODE:.spec.nodeName,TYPE:.spec.nodeSelector
NAME                                  STATUS    NODE                                        TYPE
eat-backend-cc9b8cdbf-tv9h5   Running   ip-10-3-45-186.us-east-2.compute.internal   map[beta.kubernetes.io/instance-type:t3.xlarge role:eat-workers]
eat-backend-cc9b8cdbf-w7w5w   Running   ip-10-3-63-119.us-east-2.compute.internal   map[beta.kubernetes.io/instance-type:t3.xlarge role:eat-workers]
eat-backend-memcached-0       Running   ip-10-3-53-83.us-east-2.compute.internal    <none>
[/simterm]
m5:
[simterm]
$ kk -n eks-dev-1-eat-backend-ns-m5 get pod -o=custom-columns=NAME:.metadata.name,STATUS:.status.phase,NODE:.spec.nodeName,TYPE:.spec.nodeSelector
NAME                                   STATUS    NODE                                        TYPE
eat-backend-7dfb56b75c-k8gt6   Running   ip-10-3-61-225.us-east-2.compute.internal   map[beta.kubernetes.io/instance-type:m5.xlarge role:eat-workers]
eat-backend-7dfb56b75c-wq9n2   Running   ip-10-3-33-222.us-east-2.compute.internal   map[beta.kubernetes.io/instance-type:m5.xlarge role:eat-workers]
eat-backend-memcached-0        Running   ip-10-3-47-253.us-east-2.compute.internal   <none>
[/simterm]
And c5:
[simterm]
$ kk -n eks-dev-1-eat-backend-ns-c5 get pod -o=custom-columns=NAME:.metadata.name,STATUS:.status.phase,NODE:.spec.nodeName,TYPE:.spec.nodeSelector
NAME                                  STATUS    NODE                                        TYPE
eat-backend-7b6778c5c-9g6st   Running   ip-10-3-47-253.us-east-2.compute.internal   map[beta.kubernetes.io/instance-type:c5.xlarge role:eat-workers]
eat-backend-7b6778c5c-sh5sn   Running   ip-10-3-53-83.us-east-2.compute.internal    map[beta.kubernetes.io/instance-type:c5.xlarge role:eat-workers]
eat-backend-memcached-0       Running   ip-10-3-47-58.us-east-2.compute.internal    <none>
[/simterm]
Everything is ready for the testing.
Testing AWS EC2 t3 vs m5 vs c5
Run the tests, the same suite for all WorkerNode Groups, and watch on the CPU consumption by pods.
t3
Pods:
[simterm]
$ kk top nod-n eks-dev-1-eat-backend-ns-t3 top pod
NAME                                   CPU(cores)   MEMORY(bytes)
eat-backend-79cfc4f9dd-q22rh   1503m        103Mi
eat-backend-79cfc4f9dd-wv5xv   1062m        106Mi
eat-backend-memcached-0        1m           2Mi
[/simterm]
Nodes:
[simterm]
$ kk top node -l role=eat-workers,beta.kubernetes.io/instance-type=t3.xlarge
NAME                                        CPU(cores)   CPU%   MEMORY(bytes)   MEMORY%
ip-10-3-45-186.us-east-2.compute.internal   1034m        26%    1125Mi          8%
ip-10-3-63-119.us-east-2.compute.internal   1616m        41%    1080Mi          8%
M5
Pods:
[simterm]
$ kk -n eks-dev-1-eat-backend-ns-m5 top pod
NAME                                   CPU(cores)   MEMORY(bytes)
eat-backend-6f5d68778d-484lk   1039m        114Mi
eat-backend-6f5d68778d-lddbw   1207m        105Mi
eat-backend-memcached-0        1m           2Mi
[/simterm]
Nodes:
[simterm]
$ kk top node -l role=eat-workers,beta.kubernetes.io/instance-type=m5.xlarge
NAME                                        CPU(cores)   CPU%   MEMORY(bytes)   MEMORY%
ip-10-3-33-222.us-east-2.compute.internal   1550m        39%    1119Mi          8%
ip-10-3-61-225.us-east-2.compute.internal   891m         22%    1087Mi          8%
C5
Pods:
[simterm]
$ kk -n eks-dev-1-eat-backend-ns-c5 top pod
NAME                                   CPU(cores)   MEMORY(bytes)
eat-backend-79b947c74d-mkgm9   941m         103Mi
eat-backend-79b947c74d-x5qjd   905m         107Mi
eat-backend-memcached-0        1m           2Mi
[/simterm]
Nodes:
[simterm]
$ kk top node -l role=eat-workers,beta.kubernetes.io/instance-type=c5.xlarge
NAME                                        CPU(cores)   CPU%   MEMORY(bytes)   MEMORY%
ip-10-3-47-253.us-east-2.compute.internal   704m         17%    1114Mi          19%
ip-10-3-53-83.us-east-2.compute.internal    1702m        43%    1122Mi          19%
Actually, that’s all.
Results:
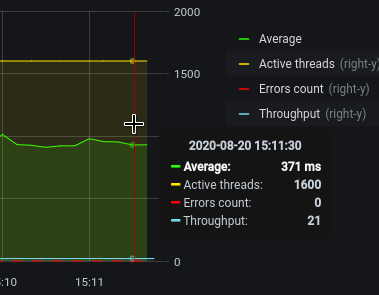
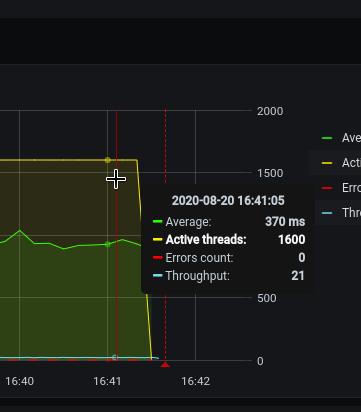
- t3: 1000-1500 mCPU, 385 ms response
- m5: 1000-1200 mCPU, 371 ms response
- c5: 900-1000 mCPU, 370 ms response
So, let’s use the С5 type for now as they seem to be best by the CPU usage.
Kubernetes NodeAffinity vs Kubernetes ClusterAutoscaler
One of the main questions I’ve been struggling with – will the Cluster AutoScaler respect the NodeAffinity?
Going forward – yes, it will.
Our HorizontalPodAutoscaler looks like so:
---
apiVersion: autoscaling/v2beta2
kind: HorizontalPodAutoscaler
metadata:
  name: {{ .Chart.Name }}-hpa
spec:
  scaleTargetRef:
    apiVersion: apps/v1
    kind: Deployment
    name: {{ .Chart.Name }}
  minReplicas: {{ .Values.hpa.minReplicas }}
  maxReplicas: {{ .Values.hpa.maxReplicas }}
  metrics:
  - type: Resource
    resource:
      name: cpu
      target:
        type: Utilization
        averageUtilization: {{ .Values.hpa.cpuUtilLimit }}
The cpuUtilLimit is set to 30%, so when PHP-FPM will start actively using its FPM-workers – then CPU load will rise and the 30% limit will give us some time to spin up new pods and EC2 instances while already existing pods will keep the already existing connections.
See the Kubernetes: HorizontalPodAutoscaler – an overview with examples post for more details.
The nodeSelector now is described by using the Helm template and its values.yaml, check the Helm: Kubernetes package manager – an overview, getting started:
...
      nodeSelector:
        beta.kubernetes.io/instance-type: {{ .Values.nodeSelector.instanceType | quote }}
        role: {{ .Values.nodeSelector.role | quote }}
...
And its values.yaml:
...
nodeSelector:
  instanceType: "c5.xlarge"
  role: "eat-workers
...
Re-create everything, and let’s start with the full load-testing.
$ kk -n eks-dev-1-eat-backend-ns top pod
NAME                                 CPU(cores)   MEMORY(bytes)
eat-backend-b8b79574-8kjl4   50m          55Mi
eat-backend-b8b79574-8t2pw   39m          55Mi
eat-backend-b8b79574-bq8nw   52m          68Mi
eat-backend-b8b79574-swbvq   40m          55Mi
eat-backend-memcached-0      2m           6Mi
$ kk top node -l role=eat-workers
NAME                                        CPU(cores)   CPU%   MEMORY(bytes)   MEMORY%
ip-10-3-34-151.us-east-2.compute.internal   105m         2%     1033Mi          18%
ip-10-3-39-132.us-east-2.compute.internal   110m         2%     1081Mi          19%
ip-10-3-54-32.us-east-2.compute.internal    166m         4%     1002Mi          17%
ip-10-3-56-98.us-east-2.compute.internal    106m         2%     1010Mi          17%
HorizontalPodAutoscaler with the на 30% CPU’s requests limit:$ kk -n eks-dev-1-eat-backend-ns get hpa NAME REFERENCE TARGETS MINPODS MAXPODS REPLICAS AGE eat-backend-hpa Deployment/eat-backend 1%/30% 4 40 4 6m27s
[/simterm]
Load Testing
Day 1
In short, it was the very first day of the whole testing, which in total took three days.
This test was performed in the four t3a.medium instances with the same 1 pod per WorkerNode with HPA and Cluster AutoScaler enabled.
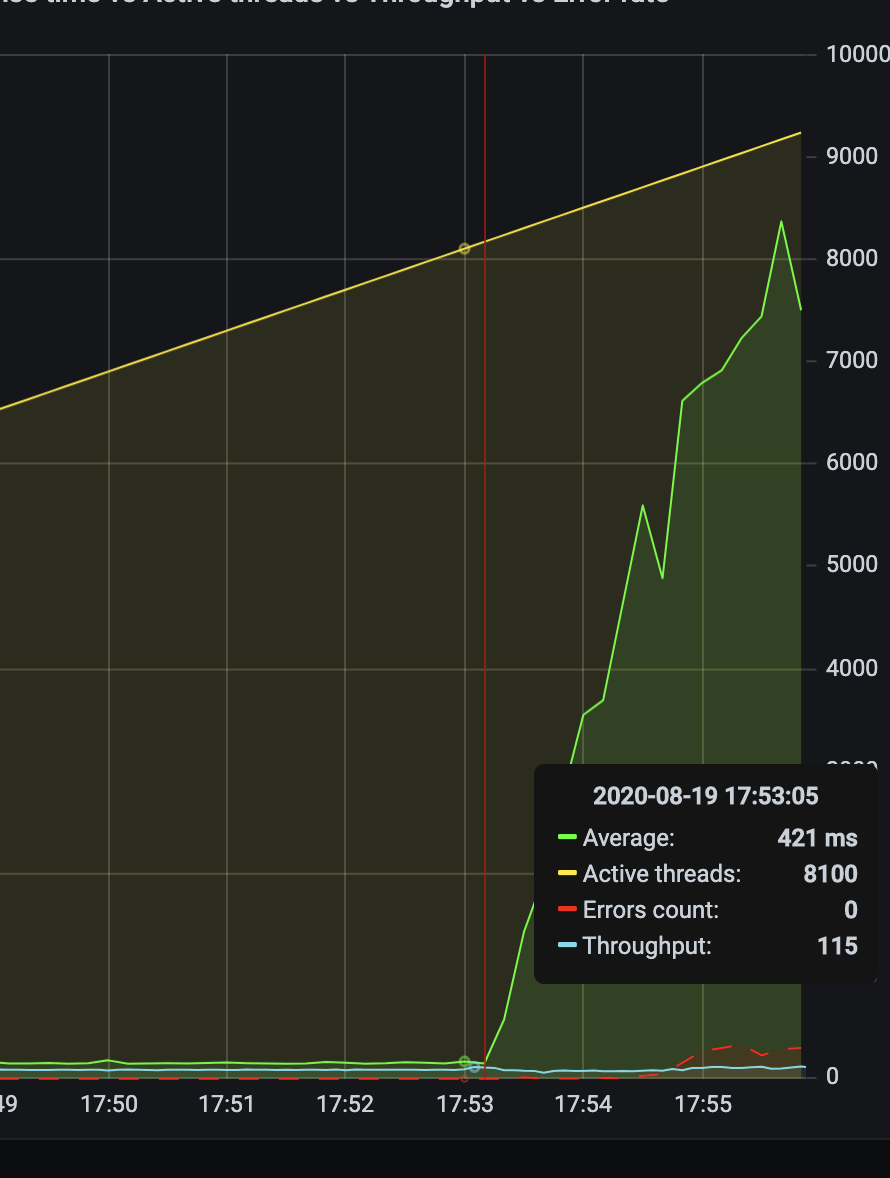
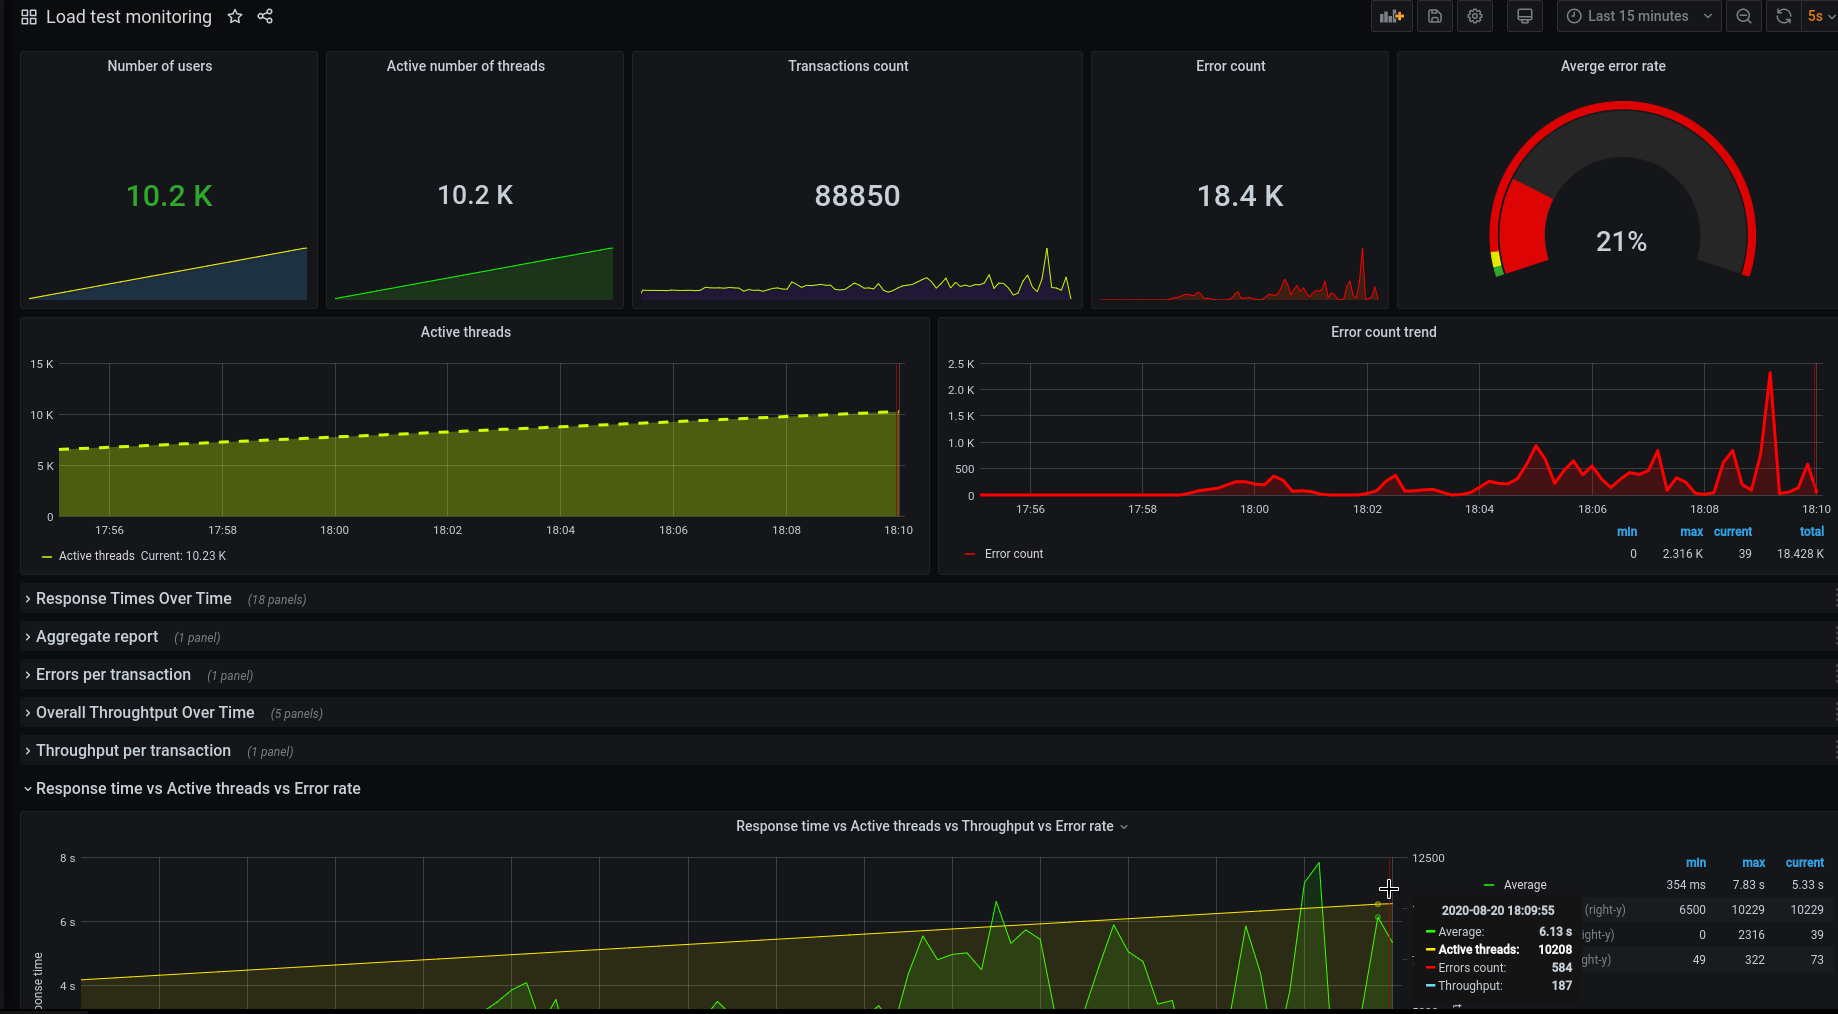
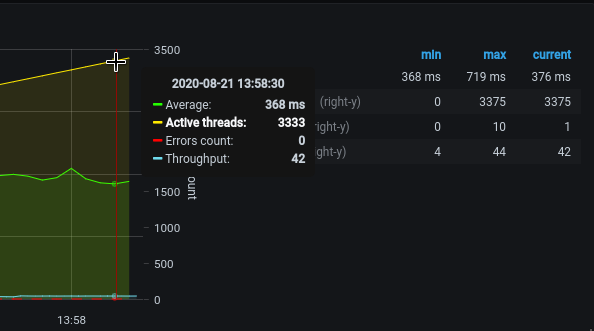
And everything went good until we reached the 8.000 simultaneous users – see the Response time:
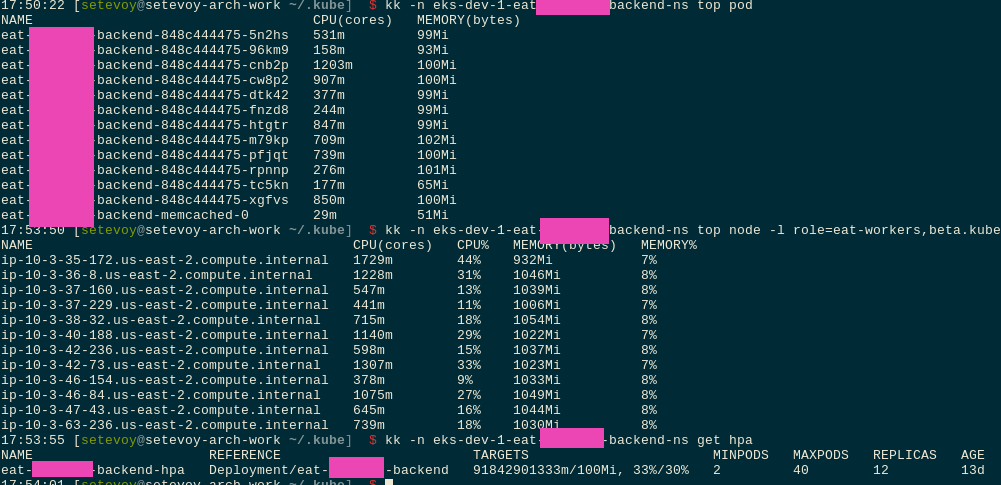
And pods stopped scaling:
Because they stopped generating over 30% CPU load.
The very first my assumption was correct: the PHP-FPM was configured as OnDemand with a maximum of 5 FPM-workers (see the PHP-FPM: Process Manager — dynamic vs ondemand vs static, Rus).
So, FPM started 5 workers which can not make more load on the CPU cores over 30% from the requests from the Deployment, and HPA stopped scaling them.
On the second day, we’ve changed it to the Dynamic (and on the third – to the Static to avoid spending time to create new processes) with the maximum 50 workers – after that, they started generating CPU load all the time, so HPA proceeded to scale our pods.
Although there are another solution like just to add one more condition for HPA, for example – by LoadBalancer connections, and later we will do so (see the Kubernetes: a cluster’s monitoring with the Prometheus Operator).
Day 2
Proceeding with the tests by JMeter using the same tests suit as yesterday (and tomorrow).
Start with one user, and increasing them up to 15.000 simultaneous users.
The current infrastructure on the DigitalOcean handled 12.000 at maximum – but on the AWS EKS, we want to be able to keep up to 15.000 users.
Let’s go:
On the 3300 users pods started scaling:
[simterm]
...
0s    Normal   SuccessfulRescale   HorizontalPodAutoscaler   New size: 5; reason: cpu resource utilization (percentage of request) above target
0s    Normal   ScalingReplicaSet   Deployment   Scaled up replica set eat-backend-b8b79574 to 5
0s    Normal   SuccessfulCreate   ReplicaSet   Created pod: eat-backend-b8b79574-l68vq
0s    Warning   FailedScheduling   Pod   0/12 nodes are available: 12 Insufficient cpu, 8 node(s) didn't match node selector.
0s    Warning   FailedScheduling   Pod   0/12 nodes are available: 12 Insufficient cpu, 8 node(s) didn't match node selector.
0s    Normal   TriggeredScaleUp   Pod   pod triggered scale-up: [{eksctl-bttrm-eks-dev-1-nodegroup-eat-us-east-2b-NodeGroup-1N0QUROWQ8K2Q 2->3 (max: 20)}]
...
[/simterm]
And new EC2 nodes as well:
[simterm]
$ kk -n eks-dev-1-eat-backend-ns top pod
NAME                                 CPU(cores)   MEMORY(bytes)
eat-backend-b8b79574-8kjl4   968m         85Mi
eat-backend-b8b79574-8t2pw   1386m        85Mi
eat-backend-b8b79574-bq8nw   737m         71Mi
eat-backend-b8b79574-l68vq   0m           0Mi
eat-backend-b8b79574-swbvq   573m         71Mi
eat-backend-memcached-0      20m          15Mi

[/simterm]
[simterm]
$ kk -n eks-dev-1-eat-backend-ns get hpa
NAME                      REFERENCE                        TARGETS   MINPODS   MAXPODS   REPLICAS   AGE
eat-backend-hpa   Deployment/eat-backend   36%/30%   4         40        5          37m

[/simterm]
[simterm]
$ kk top node -l role=eat-workers
NAME                                        CPU(cores)   CPU%   MEMORY(bytes)   MEMORY%
ip-10-3-34-151.us-east-2.compute.internal   662m         16%    1051Mi          18%
ip-10-3-39-132.us-east-2.compute.internal   811m         20%    1095Mi          19%
ip-10-3-53-136.us-east-2.compute.internal   2023m        51%    567Mi           9%
ip-10-3-54-32.us-east-2.compute.internal    1115m        28%    1032Mi          18%
ip-10-3-56-98.us-east-2.compute.internal    1485m        37%    1040Mi          18%
[/simterm]
5500 – all good so far:
net/http: request canceled (Client.Timeout exceeded while awaiting headers)
On the 7.000-8.000 we’ve faced with the issues – pods started failing with the Liveness and Readiness checks with the “Client.Timeout exceeded while awaiting headers” error:
[simterm]
0s    Warning   Unhealthy   Pod   Liveness probe failed: Get http://10.3.38.7:80/: net/http: request canceled (Client.Timeout exceeded while awaiting headers)
1s    Warning   Unhealthy   Pod   Readiness probe failed: Get http://10.3.44.96:80/: net/http: request canceled (Client.Timeout exceeded while awaiting headers)
0s    Normal   MODIFY   Ingress   rule 1 modified with conditions [{    Field: "path-pattern",    Values: ["/*"]  }]
0s    Warning   Unhealthy   Pod   Liveness probe failed: Get http://10.3.44.34:80/: net/http: request canceled (Client.Timeout exceeded while awaiting headers)
[/simterm]
And with more users it’s only getting worse – 10.000:
Pods started failing almost all the time, and the worst thing was that we even had no logs from the application – it proceeded writing to a log-file inside of the containers, and we fixed that only on the third day.
The load was like that:
[simterm]
$ kk -n eks-dev-1-eat-backend-ns get hpa
NAME                      REFERENCE                        TARGETS   MINPODS   MAXPODS   REPLICAS   AGE
eat-backend-hpa   Deployment/eat-backend   60%/30%   4         40        15         63m

[/simterm]
[simterm]
$ kk top node -l role=eat-workers
NAME                                        CPU(cores)   CPU%   MEMORY(bytes)   MEMORY%
ip-10-3-33-155.us-east-2.compute.internal   88m          2%     951Mi           16%
ip-10-3-34-151.us-east-2.compute.internal   1642m        41%    1196Mi          20%
ip-10-3-39-128.us-east-2.compute.internal   67m          1%     946Mi           16%
ip-10-3-39-132.us-east-2.compute.internal   73m          1%     1029Mi          18%
ip-10-3-43-76.us-east-2.compute.internal    185m         4%     1008Mi          17%
ip-10-3-47-243.us-east-2.compute.internal   71m          1%     959Mi           16%
ip-10-3-47-61.us-east-2.compute.internal    69m          1%     945Mi           16%
ip-10-3-53-124.us-east-2.compute.internal   61m          1%     955Mi           16%
ip-10-3-53-136.us-east-2.compute.internal   75m          1%     946Mi           16%
ip-10-3-53-143.us-east-2.compute.internal   1262m        32%    1110Mi          19%
ip-10-3-54-32.us-east-2.compute.internal    117m         2%     985Mi           17%
ip-10-3-55-140.us-east-2.compute.internal   992m         25%    931Mi           16%
ip-10-3-55-208.us-east-2.compute.internal   76m          1%     942Mi           16%
ip-10-3-56-98.us-east-2.compute.internal    1578m        40%    1152Mi          20%
ip-10-3-59-239.us-east-2.compute.internal   1661m        42%    1175Mi          20%

[/simterm]
[simterm]

$ kk -n eks-dev-1-eat-backend-ns top pod
NAME                                 CPU(cores)   MEMORY(bytes)
eat-backend-b8b79574-5d6zl   0m           0Mi
eat-backend-b8b79574-7n7pq   986m         184Mi
eat-backend-b8b79574-8t2pw   709m         135Mi
eat--backend-b8b79574-bq8nw   0m           0Mi
eat-backend-b8b79574-ds68n   0m           0Mi
eat-backend-b8b79574-f4qcm   0m           0Mi
eat-backend-b8b79574-f6wfj   0m           0Mi
eat-backend-b8b79574-g7jm7   842m         165Mi
eat-backend-b8b79574-ggrdg   0m           0Mi
eat-backend-b8b79574-hjcnh   0m           0Mi
eat-backend-b8b79574-l68vq   0m           0Mi
eat-backend-b8b79574-mlpqs   0m           0Mi
eat-backend-b8b79574-nkwjc   2882m        103Mi
eat-backend-b8b79574-swbvq   2091m        180Mi
eat-backend-memcached-0      31m          54Mi
[/simterm]
And pods restarted infinitely:
[simterm]
$ kk -n eks-dev-1-eat-backend-ns get pod
NAME                                 READY   STATUS             RESTARTS   AGE
eat-backend-b8b79574-5d6zl   0/1     CrashLoopBackOff   6          17m
eat-backend-b8b79574-7n7pq   1/1     Running            5          9m13s
eat-backend-b8b79574-8kjl4   0/1     CrashLoopBackOff   7          64m
eat-backend-b8b79574-8t2pw   0/1     CrashLoopBackOff   6          64m
eat-backend-b8b79574-bq8nw   1/1     Running            6          64m
eat-backend-b8b79574-ds68n   0/1     CrashLoopBackOff   7          17m
eat-backend-b8b79574-f4qcm   1/1     Running            6          9m13s
eat-backend-b8b79574-f6wfj   0/1     Running            6          9m13s
eat-backend-b8b79574-g7jm7   0/1     CrashLoopBackOff   5          25m
eat-backend-b8b79574-ggrdg   1/1     Running            6          9m13s
eat-backend-b8b79574-hjcnh   0/1     CrashLoopBackOff   6          25m
eat-backend-b8b79574-l68vq   1/1     Running            7          29m
eat-backend-b8b79574-mlpqs   0/1     CrashLoopBackOff   6          21m
eat-backend-b8b79574-nkwjc   0/1     CrashLoopBackOff   5          9m13s
eat-backend-b8b79574-swbvq   0/1     CrashLoopBackOff   6          64m
eat-backend-memcached-0      1/1     Running            0          64m
[/simterm]
On the 12.000 – 13.000 we had only one pod alive:
[simterm]
$ kk -n eks-dev-1-eat-backend-ns top pod
NAME                                 CPU(cores)   MEMORY(bytes)
eat-backend-b8b79574-7n7pq   0m           0Mi
eat-backend-b8b79574-8kjl4   0m           0Mi
eat-backend-b8b79574-8t2pw   0m           0Mi
eat--backend-b8b79574-bq8nw   0m           0Mi
eat-backend-b8b79574-ds68n   0m           0Mi
eat-backend-b8b79574-f4qcm   0m           0Mi
eat-backend-b8b79574-f6wfj   0m           0Mi
eat-backend-b8b79574-g7jm7   0m           0Mi
eat-backend-b8b79574-ggrdg   0m           0Mi
eat-backend-b8b79574-hjcnh   0m           0Mi
eat-backend-b8b79574-l68vq   0m           0Mi
eat-backend-b8b79574-mlpqs   0m           0Mi
eat-backend-b8b79574-nkwjc   3269m        129Mi
eat-backend-b8b79574-swbvq   0m           0Mi
eat-backend-memcached-0      23m          61Mi

[/simterm]
[simterm]
$ kk -n eks-dev-1-eat-backend-ns get pod
NAME                                 READY   STATUS             RESTARTS   AGE
eat-backend-b8b79574-5d6zl   1/1     Running            7          20m
eat-backend-b8b79574-7n7pq   0/1     CrashLoopBackOff   6          12m
eat-backend-b8b79574-8kjl4   0/1     CrashLoopBackOff   7          67m
eat-backend-b8b79574-8t2pw   0/1     CrashLoopBackOff   7          67m
eat-backend-b8b79574-bq8nw   0/1     CrashLoopBackOff   6          67m
eat-backend-b8b79574-ds68n   0/1     CrashLoopBackOff   8          20m
eat-backend-b8b79574-f4qcm   0/1     CrashLoopBackOff   6          12m
eat-backend-b8b79574-f6wfj   0/1     CrashLoopBackOff   6          12m
eat-backend-b8b79574-g7jm7   0/1     CrashLoopBackOff   6          28m
eat-backend-b8b79574-ggrdg   0/1     Running            7          12m
eat-backend-b8b79574-hjcnh   0/1     CrashLoopBackOff   7          28m
eat-backend-b8b79574-l68vq   0/1     CrashLoopBackOff   7          32m
eat-backend-b8b79574-mlpqs   0/1     CrashLoopBackOff   7          24m
eat-backend-b8b79574-nkwjc   1/1     Running            7          12m
eat-backend-b8b79574-swbvq   0/1     CrashLoopBackOff   7          67m
eat-backend-memcached-0      1/1     Running            0          67m
[/simterm]
And only at this moment I’ve recalled about log-files in containers and checked them – found, that our database server started refusing connections:
[simterm]
bash-4.4# cat ./new-eat-backend/storage/logs/laravel-2020-08-20.log
[2020-08-20 16:53:25] production.ERROR: SQLSTATE[HY000] [2002] Connection refused {"exception":"[object] (Doctrine\\DBAL\\Driver\\PDOException(code: 2002): SQLSTATE[HY000] [2002] Connection refused at /var/www/new-eat-backend/vendor/doctrine/dbal/lib/Doctrine/DBAL/Driver/PDOConnection.php:31, PDOException(code: 2002): SQLSTATE[HY000] [2002] Connection refused at /var/www/new-eat-backend/vendor/doctrine/dbal/lib/Doctrine/DBAL/Driver/PDOConnection.php:27)
[/simterm]
AWS RDS – “Connection refused”
For databases, we are using RDS Aurora MySQL with its own Slaves’ autoscaling.
The issue here is that at first the testing is performed on the Dev environment which has small database instances – db.t2.medium with 4 GB RAM, and at second – all requests from the application were sent to the Master DB instance while Aurora’s Slaves weren’t used at all. The Master served about 155 requests per second.
Actually, one of the main benefits of the Aurora RDS is exactly the Master/Slave division – all requests to modify data (UPDATE, CREATE, etc) must be sent to the Master, while all SELECT – to the Slave.
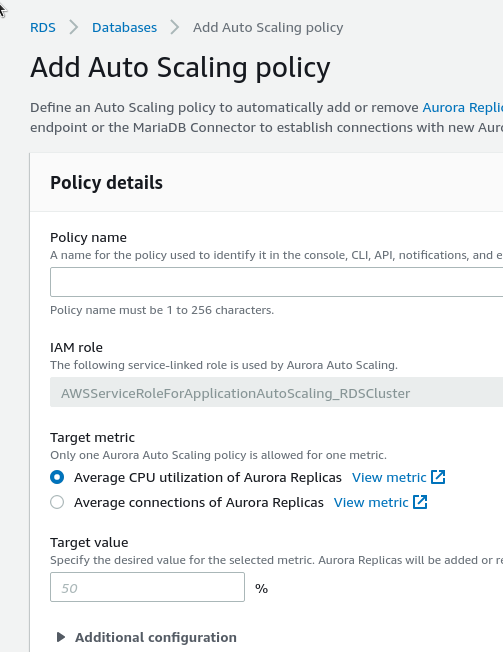
During that, Slaves can be scaled by their own autoscaling policies:
By the way, we are doing it in the wrong way here – it’s better for us to scale Slaves by the Connections number, not by CPU. Will change it later.
AWS RDS max connections
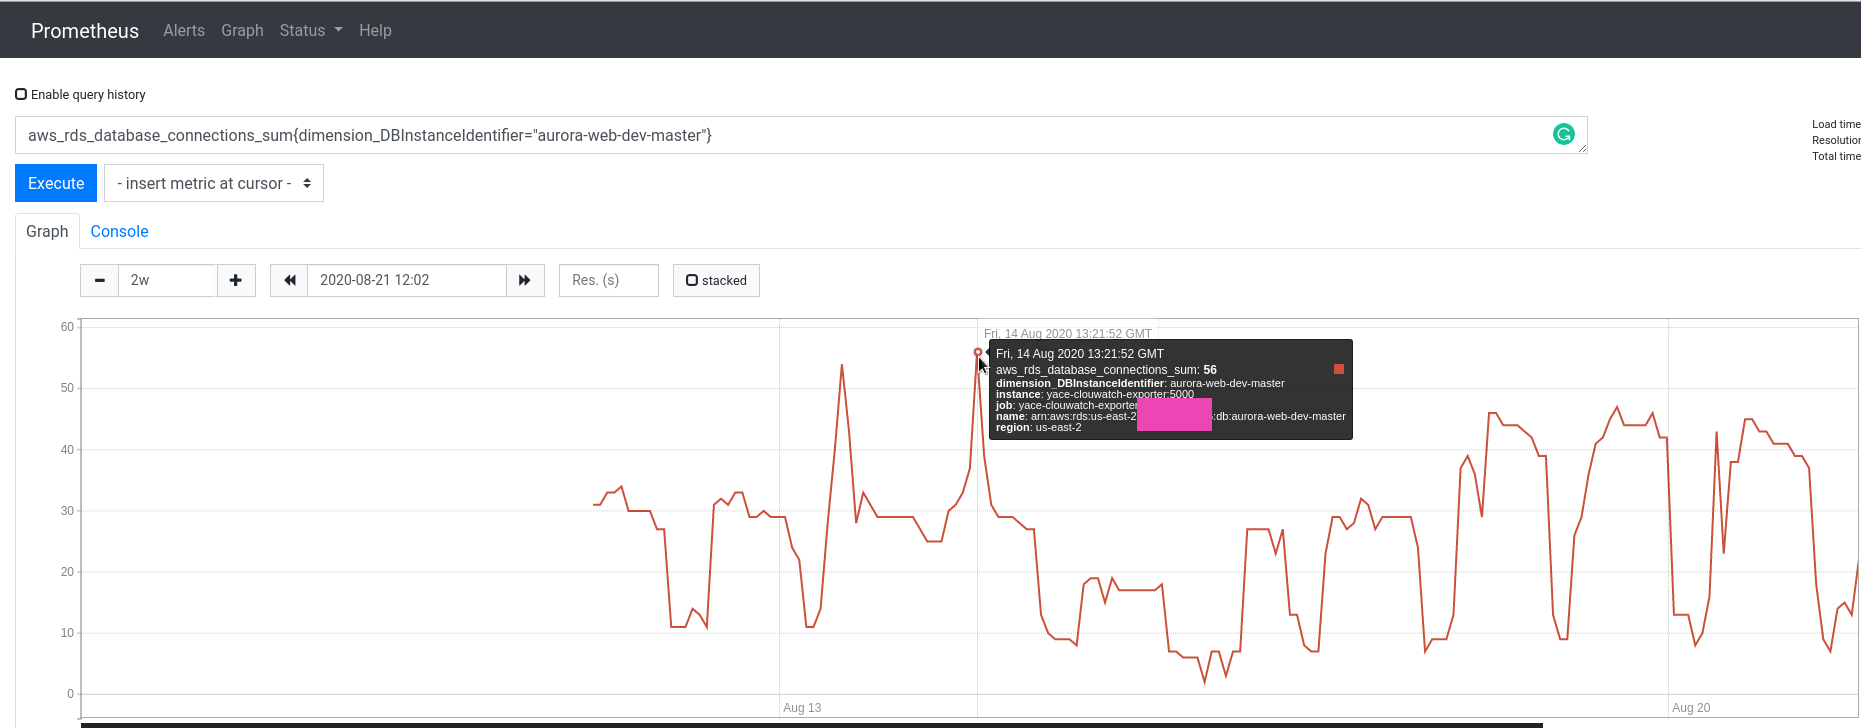
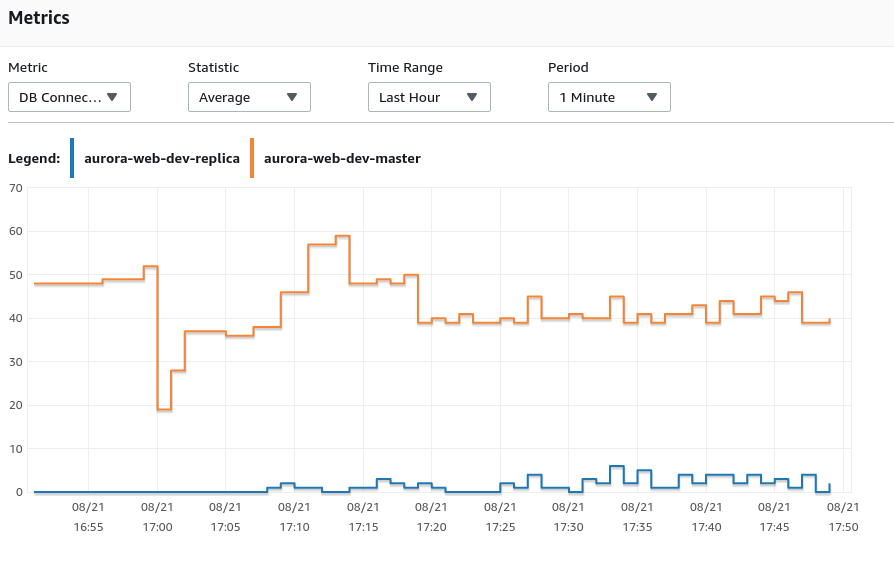
Actually, as per the documentation – to connections limit for the t3.medium must be 90 connections at the same time, while we were rejected after 50-60:
I spoke with AWS architectures then and asked them about “90 connections in the documentation” – but they couldn’t help us with the answer like “Maybe it’s up to 90?”
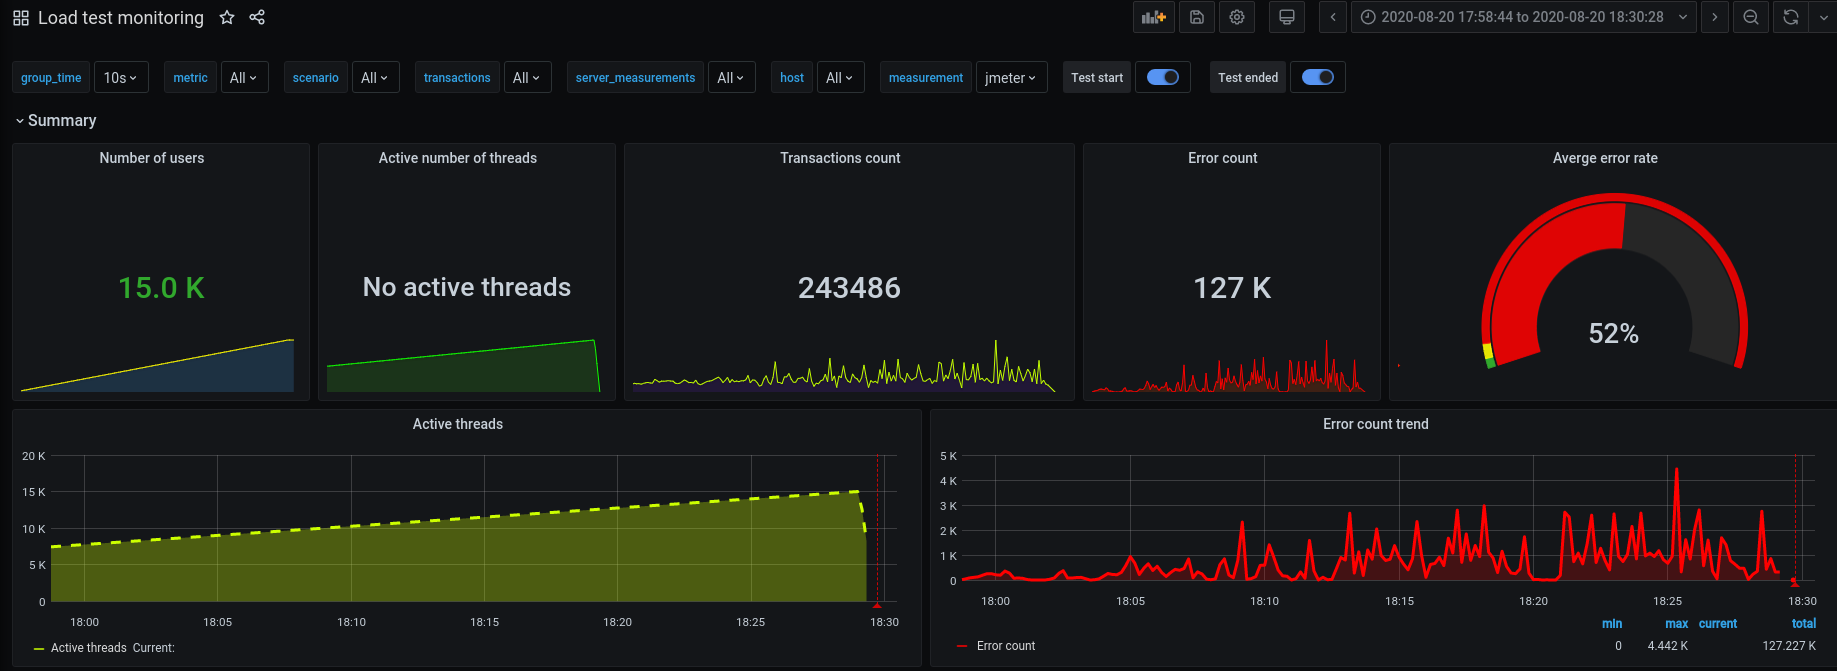
And in general, after tests we had such a picture:
52% were failed and this is obviously really bad:
But for me, the main thing here was that the cluster itself, its Control Plane, and the network worked as expected.
The database issue will be solved on the third day – will upgrade the instance type and will configure the application to start working with the Aurora Slaves.
Day 3
Well – the most interesting day 🙂
First – developers fixed Aurora Slaves, so the application will use them now.
By the way, spoke to the AWS team yesterday and they told me about the RDS Proxy service – need to check it, looks promising.
Also, need to check the OpCache setting as it can decrease CPU usage, see the PHP: кеширование PHP-скриптов — настройка и тюнинг OpCache (in Rus).
While developers are making their changes – let’s take a look at our Kubernetes Liveness and Readiness Probes.
Kubernetes Liveness and Readiness probes
Found a couple of interesting posts – Kubernetes Liveness and Readiness Probes: How to Avoid Shooting Yourself in the Foot и Liveness and Readiness Probes with Laravel.
Our developers already added two new endpoints:
...
$router->get('healthz', 'HealthController@phpCheck');
$router->get('readiness', 'HealthController@dbReadCheck');
...
And the HealthController is the next:
<?php

namespace App\Http\Controllers;

class HealthController extends Controller
{
    public function phpCheck()
    {
        return response('ok');
    }

    public function dbReadCheck()
    {
        try {
            $rows = \DB::select('SELECT 1 AS ok');
            if ($rows && $rows[0]->ok == 1) {
                return response('ok');
            }
        } catch (\Throwable $err) {
            // ignore
        }
        return response('err', 500);
    }
}
By the /healthz URI we will check, that pod itself is started and PHP is working.
By the /readiness – will check that the application is started and is ready to accept connections:
livenessProbe: if failed – Kubernetes will restart the podinitialDelaySeconds: should be longer than maximum initialization time for the container – how much Laravel is needed? let’s set it to the 5 secondsfailureThreshold: three attempts, if they all will fail – the pod will be restartedperiodSeconds: the default value is 15 seconds, as I remember – let it be so
readinessProbe: defines when an application is ready to service requests. If this check will fail – Kubernetes will turn that pod off the load-balancing/ServiceinitialDelaySeconds: let’s use 5 seconds here to have time to start PHP and connect to the databaseperiodSeconds: as we are expecting issues with the database connections – let’s set it to 5 secondsfailureThreshold: also three, as for thelivenessProbesuccessThreshold: after how much successful attempt consider that pod is ready for the traffic – let’s set it to 1timeoutSeconds: the default is 1, let’s use it
See Configure Probes.
Update Probes in the Deployment:
...
        livenessProbe:
          httpGet:
            path: {{ .Values.appConfig.healthcheckPath }}
            port: {{ .Values.appConfig.port }}
          initialDelaySeconds: 5
          failureThreshold: 3
          periodSeconds: 15
        readinessProbe:
          httpGet:
            path: {{ .Values.appConfig.readycheckPath }}
            port: {{ .Values.appConfig.port }}
          initialDelaySeconds: 5
          periodSeconds: 5
          failureThreshold: 3
          successThreshold: 1
          timeoutSeconds: 1
...
Later will move it to the values.yaml.
And add a new variable for the Slave database server:
...
        - name: DB_WRITE_HOST
          value: {{ .Values.appConfig.db.writeHost }}
        - name: DB_READ_HOST
          value: {{ .Values.appConfig.db.readHost }}
...
Kubernetes: PHP logs from Docker
Ah, and logs!.
Developers enabled logs to be sent to the /dev/stderr instead of writing to the file, and Docker daemon must get them and send to the Kubernetes – but in the kubectl logs we can see messages from the NGINX only.
Go to check the Linux: PHP-FPM, Docker, STDOUT, and STDERR – no an application’s error logs, recall how it’s working, and go to check descriptors.
In the pod find a master’s PHP-process PID:
[simterm]
bash-4.4# ps aux   |grep php-fpm | grep master
root         9  0.0  0.2 171220 20784 ?        S    12:00   0:00 php-fpm: master process (/etc/php/7.1/php-fpm.conf)
[/simterm]
And check its descriptors:
[simterm]
bash-4.4# ls -l /proc/9/fd/2
l-wx------    1 root     root            64 Aug 21 12:04 /proc/9/fd/2 -> /var/log/php/7.1/php-fpm.log
bash-4.4# ls -l /proc/9/fd/1
lrwx------    1 root     root            64 Aug 21 12:04 /proc/9/fd/1 -> /dev/null
[/simterm]
fd/2, it’s the stderr of the process, and it’s mapped to the /var/log/php/7.1/php-fpm.log instead of the /dev/stderr – that’s why we can’t see anything in the kubectl logs.
Grep the “/var/log/php/7.1/php-fpm.log” string recursively in the /etc/php/7.1 directory and find the php-fpm.conf which by default has error_log = /var/log/php/7.1/php-fpm.log. Fix it to the /dev/stderr – and this is done
Run the test again!
From 1 to 15.000 users for 30 minutes.
The First Test
3300 users – all good:
Pods:
[simterm]
$ kk -n eks-dev-1-eat-backend-ns top pod
NAME                                   CPU(cores)   MEMORY(bytes)
eat-backend-867b59c4dc-742vf   856m         325Mi
eat-backend-867b59c4dc-bj74b   623m         316Mi
eat-backend-867b59c4dc-cq5gd   891m         319Mi
eat-backend-867b59c4dc-mm2ll   600m         310Mi
eat-ackend-867b59c4dc-x8b8d   679m         313Mi
eat-backend-memcached-0        19m          68Mi
[/simterm]
HPA:
[simterm]
$ kk -n eks-dev-1-eat-backend-ns get hpa
NAME                      REFERENCE                        TARGETS   MINPODS   MAXPODS   REPLICAS   AGE
eat-backend-hpa   Deployment/eat-backend   30%/30%   4         40        5          20h
[/simterm]
On 7.000 users we got new errors – “php_network_getaddresses: getaddrinfo failed” – my old “friends”, faced with the on the AWS a couple of times:
[simterm]
[2020-08-21 14:14:59] local.ERROR: SQLSTATE[HY000] [2002] php_network_getaddresses: getaddrinfo failed: Try again (SQL: insert into `order_logs` (`order_id`, `action`, `data`, `updated_at`, `created_at`) values (175951, nav, "Result page: ok", 2020-08-21 14:14:54, 2020-08-21 14:14:54)) {"exception":"[object] (Illuminate\\Database\\QueryException(code: 2002): SQLSTATE[HY000] [2002] php_network_getaddresses: getaddrinfo failed: Try again (SQL: insert into `order_logs` (`order_id`, `action`, `data`, `updated_at`, `created_at`) values (175951, nav, \"Result page: ok\", 2020-08-21 14:14:54, 2020-08-21 14:14:54))
[/simterm]
In short – the “php_network_getaddresses: getaddrinfo failed” error in AWS can happen by three (at least known by me) reasons:
- too many packets per second on a network interface of an AWS EC2, see EC2 Packets per Second: Guaranteed Throughput vs Best Effort
- the network throughput is exhausted – see EC2 Network Performance Cheat Sheet
- to many DNS queries are sent to the AWS VPC DNS -its limit is 1024/second, see DNS quotas
We will speak about the cause in our current case a bit later in this post.
On 9.000+ pods started restarting:
[simterm]
$ kk -n eks-dev-1-eat-backend-ns get pod
NAME                                   READY   STATUS             RESTARTS   AGE
eat-backend-867b59c4dc-2m7fd   0/1     Running            2          4m17s
eat-backend-867b59c4dc-742vf   0/1     CrashLoopBackOff   5          68m
eat-backend-867b59c4dc-bj74b   1/1     Running            5          68m
...
eat-backend-867b59c4dc-w24pz   0/1     CrashLoopBackOff   5          19m
eat-backend-867b59c4dc-x8b8d   0/1     CrashLoopBackOff   5          68m
eat-backend-memcached-0        1/1     Running            0          21h
[/simterm]
Because they stooped reply to Liveness and Readiness checks:
[simterm]
0s    Warning   Unhealthy   Pod   Readiness probe failed: Get http://10.3.62.195:80/readiness: net/http: request canceled (Client.Timeout exceeded while awaiting headers)
0s    Warning   Unhealthy   Pod   Liveness probe failed: Get http://10.3.56.206:80/healthz: net/http: request canceled (Client.Timeout exceeded while awaiting headers)
[/simterm]
And after 10.000 our database server started refusing connections:
[simterm]
[2020-08-21 13:05:11] production.ERROR: SQLSTATE[HY000] [2002] Connection refused {"exception":"[object] (Doctrine\\DBAL\\Driver\\PDOException(code: 2002): SQLSTATE[HY000] [2002] Connection refused at /var/www/new-eat-backend/vendor/doctrine/dbal/lib/Doctrine/DBAL/Driver/PDOConnection.php:31, PDOException(code: 2002): SQLSTATE[HY000] [2002] Connection refused
[/simterm]
php_network_getaddresses: getaddrinfo failed и DNS
So, which issues do we found this time:
- ERROR: SQLSTATE[HY000] [2002] Connection refused
- php_network_getaddresses: getaddrinfo failed
The “ERROR: SQLSTATE[HY000] [2002] Connection refused” is a known issue and we know how to deal with it – I’ll update the RDS instance from t3.medium to r5.large, but what about the DNS issue?
Because from the reasons mentioned above – packets per second on a network interface, network link throughput, and AWS VPC DNS, the most viable seems to be the DNS service: each time when our application wants to connect to the database server – it makes a DNS query to determine DB-server’s IP, plus all other DNS records and together they can fill up the 1024 requests per second limit.
By the way, take a look at the Grafana: Loki – the LogQL’s Prometheus-like counters, aggregation functions, and dnsmasq’s requests graphs post.
Let’s check the DNS settings of our pods now:
[simterm]
bash-4.4# cat /etc/resolv.conf
nameserver 172.20.0.10
search eks-dev-1-eat-backend-ns.svc.cluster.local svc.cluster.local cluster.local us-east-2.compute.internal
options ndots:5
[/simterm]
nameserver 172.20.0.10 – must be our kube-dns:
[simterm]
bash-4.4# nslookup 172.20.0.10
10.0.20.172.in-addr.arpa        name = kube-dns.kube-system.svc.cluster.local.
[/simterm]
Yes, it is.
And by the way, it told us in it slogs that it can’t connect to the API-server:
E0805 21:32:40.283128 1 reflector.go:283] pkg/mod/k8s.io/[email protected]/tools/cache/reflector.go:98: Failed to watch *v1.Namespace: Get https://172.20.0.1:443/api/v1/namespaces?resourceVersion=23502628&timeout=9m40s&timeoutSeconds=580&watch=true: dial tcp 172.20.0.1:443: connect: connection refused
So, what can we do to prevent of overuse of the AWS VPC DNS?
- spin up the
dnsmasq? For Kubernetes it seems to be a bit weird, at first – because Kubernetes already has its own DNS, and in second – I’m sure we are not the very first who faced this issue and I doubt they solved it via running an additional container with thednsmasq(still – check the dnsmasq: AWS – “Temporary failure in name resolution”, logs, debug and dnsmasq cache size) - another solution could to use DNS from Cloudflare (1.1.1.1) or Google (8.8.8.8) – then we will stop using VPC DNS at all, but will have increased DNS response time
Kubernetes dnsPolicy
Okay, let’s see how DNS is configured in Kubernetes in general:
Note: You can manage your pod’s DNS configuration with the dnsPolicy field in the pod specification. If this field isn’t populated, then the ClusterFirst DNS policy is used by default.
So, by default for pods the ClusterFirst is set, which:
Any DNS query that does not match the configured cluster domain suffix, such as “
www.kubernetes.io“, is forwarded to the upstream nameserver inherited from the node.
And obviously, AWS EC2 by default will use exactly AWS VPC DNS.
See also – How do I troubleshoot DNS failures with Amazon EKS?
Nodes DNS can be configured with the ClusterAutoScaler settings:
[simterm]
$ kk -n kube-system get pod cluster-autoscaler-5dddc9c9b-fstft -o yaml
...
spec:
  containers:
  - command:
    - ./cluster-autoscaler
    - --v=4
    - --stderrthreshold=info
    - --cloud-provider=aws
    - --skip-nodes-with-local-storage=false
    - --expander=least-waste
    - --node-group-auto-discovery=asg:tag=k8s.io/cluster-autoscaler/enabled,k8s.io/cluster-autoscaler/bttrm-eks-dev-1
    - --balance-similar-node-groups
    - --skip-nodes-with-system-pods=false
...
[/simterm]
But in our case nothing was changed here, everything was left with its default settings.
Running a NodeLocal DNS in Kubernetes
But the idea with the dnsmasq was correct, but for Kubernetes, there is the NodeLocal DNS solution which is exactly the same caching service as dnsmasq, but it will use the kube-dns to grab records, and kube-dns will go to the VPC DNS afterward.
What do we need to run it:
- kubedns: will take by the
kubectl get svc kube-dns -n kube-system -o jsonpath={.spec.clusterIP}command - domain: is our
<cluster-domain>, cluster.local - localdns:
<node-local-address>, the address, where the local DNS cache will be accessible, let’s use the 169.254.20.10
Get the kube-dns‘s Service IP:
[simterm]
$ kubectl get svc kube-dns -n kube-system -o jsonpath={.spec.clusterIP}
172.20.0.10
[/simterm]
See also Fixing EKS DNS.
Download the nodelocaldns.yaml file:
[simterm]
$ wget https://raw.githubusercontent.com/kubernetes/kubernetes/master/cluster/addons/dns/nodelocaldns/nodelocaldns.yaml
[/simterm]
Update it with the sed and set data we determined above:
[simterm]
$ sed -i "s/__PILLAR__LOCAL__DNS__/169.254.20.10/g; s/__PILLAR__DNS__DOMAIN__/cluster.local/g; s/__PILLAR__DNS__SERVER__/172.20.0.10/g" nodelocaldns.yaml
[/simterm]
Check the manifest’s content – what it will do – here a Kubernetes DaemonSet will be created, which will spin up pods with the NodeLocal DNS on every Kubernetes WorkerNode:
...
---
apiVersion: apps/v1
kind: DaemonSet
metadata:
  name: node-local-dns
...
And its ConfigMap:
...
---
apiVersion: v1
kind: ConfigMap
metadata:
  name: node-local-dns
  namespace: kube-system
  labels:
    addonmanager.kubernetes.io/mode: Reconcile
data:
  Corefile: |
    cluster.local:53 {
        errors
        cache {
                success 9984 30
                denial 9984 5
        }
        reload
        loop
        bind 169.254.20.10 172.20.0.10
        forward . __PILLAR__CLUSTER__DNS__ {
                force_tcp
        }
        prometheus :9253
        health 169.254.20.10:8080
        }

...
Deploy it:
[simterm]
$ kubectl apply -f nodelocaldns.yaml
serviceaccount/node-local-dns created
service/kube-dns-upstream created
configmap/node-local-dns created
daemonset.apps/node-local-dns created
[/simterm]
Check pods:
[simterm]
$ kk -n kube-system get pod | grep local-dns
node-local-dns-7cndv                      1/1     Running   0          33s
node-local-dns-7hrlc                      1/1     Running   0          33s
node-local-dns-c5bhm                      1/1     Running   0          33s
[/simterm]
Its Service:
[simterm]
$ kk -n kube-system get svc | grep dns
kube-dns                                             ClusterIP   172.20.0.10      <none>        53/UDP,53/TCP                  88d
kube-dns-upstream                                    ClusterIP   172.20.245.211   <none>        53/UDP,53/TCP                  107s
[/simterm]
kube-dns-upstream ClusterIP 172.20.245.21, but from within our pods it must be accessible by the 169.254.20.10 IP as we set in the localdns.
By does it works? Go to check from a pod:
[simterm]
bash-4.4# dig @169.254.20.10 ya.ru +short
87.250.250.242
[/simterm]
Yup, works, good.
The next thing is to reconfigure our pods so they will use the 169.254.20.10 instead of the kube-dns Service.
In the eksctl config file this can be done with the clusterDNS:
...
nodeGroups:
- name: mygroup
    clusterDNS: 169.254.20.10
...
But then you need to update (actually – re-create) your existing WorkerNode Groups.
Kubernetes Pod dnsConfig && nameservers
To apply changes without creating WorkerNode groups – we can specify necessary DNS setting in our Deployment by adding the dnsConfig and nameservers:
...
        resources:
          requests:
            cpu: 2500m
            memory: 500m
        terminationMessagePath: /dev/termination-log
        terminationMessagePolicy: File
      dnsConfig:
        nameservers:
        - 169.254.20.10
      dnsPolicy: None
      imagePullSecrets:
      - name: gitlab-secret
      nodeSelector:
        beta.kubernetes.io/instance-type: c5.xlarge
        role: eat-workers
...
Deploy, check:
[simterm]
$ kk -n eks-dev-1-eat-backend-ns exec -ti eat-backend-f7b49b4b7-4jtk5 cat /etc/resolv.conf
nameserver 169.254.20.10
[/simterm]
Okay…
Does it work?
Let’s check with the dig from a pod:
[simterm]
$ kk -n eks-dev-1-eat-backend-ns exec -ti eat-backend-f7b49b4b7-4jtk5 dig ya.ru +short
87.250.250.242
[/simterm]
Yup, all good.
Now we can perform the second test.
The first test’s results were the next:
When we’ve got errors after 8.000 users.
The Second Test
8500 – all good so far:
On the previous test, we’ve started getting errors after 7.000 – about 150-200 errors, and at this time there only 5 errors for now.
Pods status:
[simterm]
$ kk -n eks-dev-1-eat-backend-ns get pod
NAME                                  READY   STATUS    RESTARTS   AGE
eat-backend-5d8984656-2ftd6   1/1     Running   0          17m
eat-backend-5d8984656-45xvk   1/1     Running   0          9m11s
eat-backend-5d8984656-6v6zr   1/1     Running   0          5m10s
...
eat-backend-5d8984656-th2h6   1/1     Running   0          37m
eat-backend-memcached-0       1/1     Running   0          24h
[/simterm]
НРА:
[simterm]
$ kk -n eks-dev-1-eat-backend-ns get hpa
NAME                      REFERENCE                        TARGETS   MINPODS   MAXPODS   REPLICAS   AGE
eat-backend-hpa   Deployment/eat-backend   32%/30%   4         40        13         24h
[/simterm]
10.000 – still good:
НРА:
[simterm]
$ kk -n eks-dev-1-eat-backend-ns get hpa
NAME                      REFERENCE                        TARGETS   MINPODS   MAXPODS   REPLICAS   AGE
eat-backend-hpa   Deployment/eat-backend   30%/30%   4         40        15         24h
[/simterm]
Pods:
[simterm]
$ kk -n eks-dev-1-eat-backend-ns get pod
NAME                                  READY   STATUS    RESTARTS   AGE
eat-backend-5d8984656-2ftd6   1/1     Running   0          28m
eat--backend-5d8984656-45xvk   1/1     Running   0          20m
eat-backend-5d8984656-6v6zr   1/1     Running   0          16m
...
eat-backend-5d8984656-th2h6   1/1     Running   0          48m
eat-backend-5d8984656-z2tpp   1/1     Running   0          3m51s
eat-backend-memcached-0       1/1     Running   0          24h
[/simterm]
Connects to the database server:
Nodes:
[simterm]
$ kk top node -l role=eat-workers
NAME                                        CPU(cores)   CPU%   MEMORY(bytes)   MEMORY%
ip-10-3-39-145.us-east-2.compute.internal   743m         18%    1418Mi          24%
ip-10-3-44-14.us-east-2.compute.internal    822m         20%    1327Mi          23%
...
ip-10-3-62-143.us-east-2.compute.internal   652m         16%    1259Mi          21%
ip-10-3-63-96.us-east-2.compute.internal    664m         16%    1266Mi          22%
ip-10-3-63-186.us-east-2.compute.internal   <unknown>                           <unknown>               <unknown>               <unknown>
ip-10-3-58-180.us-east-2.compute.internal   <unknown>                           <unknown>               <unknown>               <unknown>
...
ip-10-3-51-254.us-east-2.compute.internal   <unknown>                           <unknown>               <unknown>               <unknown>
[/simterm]
AutoScaling still works, all good:
At 17:45 there was a response time uptick and a couple of errors – but then all went normally.
No pods restarts:
[simterm]
$ kk -n eks-dev-1-eat-backend-ns get pod
NAME                                  READY   STATUS    RESTARTS   AGE
eat-backend-5d8984656-2ftd6   1/1     Running   0          44m
eat-backend-5d8984656-45xvk   1/1     Running   0          36m
eat-backend-5d8984656-47vp9   1/1     Running   0          6m49s
eat-backend-5d8984656-6v6zr   1/1     Running   0          32m
eat-backend-5d8984656-78tq9   1/1     Running   0          2m45s
...
eat-backend-5d8984656-th2h6   1/1     Running   0          64m
eat-backend-5d8984656-vbzhr   1/1     Running   0          6m49s
eat-backend-5d8984656-xzv6n   1/1     Running   0          6m49s
eat-backend-5d8984656-z2tpp   1/1     Running   0          20m
eat-backend-5d8984656-zfrb7   1/1     Running   0          16m
eat-backend-memcached-0       1/1     Running   0          24h
[/simterm]
30 pods were scaled up:
[simterm]
$ kk -n eks-dev-1-eat-backend-ns get hpa
NAME                      REFERENCE                        TARGETS   MINPODS   MAXPODS   REPLICAS   AGE
eat-backend-hpa   Deployment/eat-backend   1%/30%    4         40        30         24h
[/simterm]
0% errors:
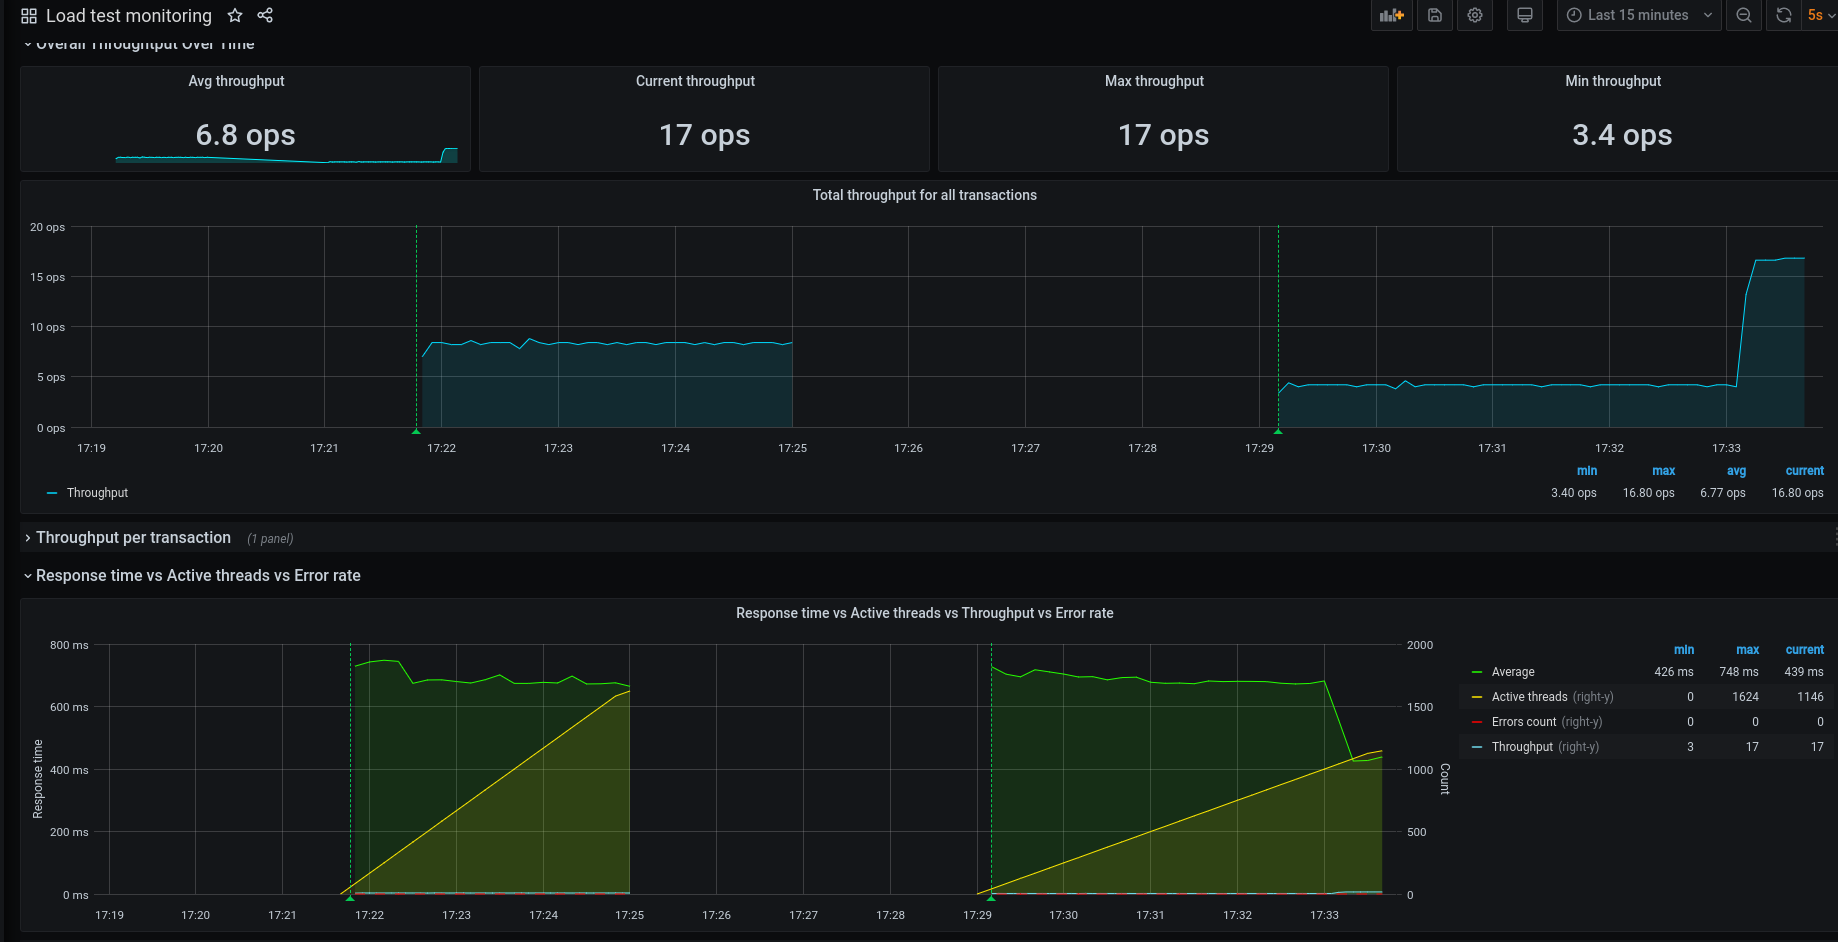
Apache JMeter и Grafana
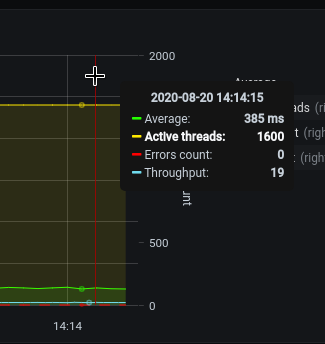
Lastly, I first saw such a solution and it looks really good – QA team made their JMeter зto send testing results into the InfluxDB, and then Grafana uses it to draw the graphs:
![]()
