 Kubernetes HorizontalPodAutoscaler automatically scales Kubernetes Pods under
 ReplicationController, Deployment, or ReplicaSet controllers basing on its CPU, memory, or other metrics.
It was shortly discussed in the Kubernetes: running metrics-server in AWS EKS for a Kubernetes Pod AutoScaler post, now let’s go deeper to check all options available for scaling.
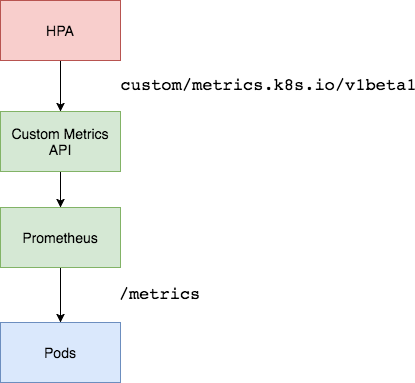
For HPA you can use three API types:
metrics.k8s.io: default metrics, basically provided by themetrics-servercustom.metrics.k8s.io: metrics, provided by adapters from inside of a cluster, for example – Microsoft Azure Adapter, Google Stackdriver, Prometheus Adapter (the Prometheus Adapter will be used in this post later), check the full list here>>>external.metrics.k8s.io: similar to the Custom Metrics API, but metrics are provided by an external system, such as AWS CloudWatch
Documentation: Support for metrics APIs, and Custom and external metrics for autoscaling workloads.
Besides the HorizontalPodAutoscaler (HPA) you also can use Vertical Pod Autoscaling (VPA) and they can be used together although with some limitations, see Horizontal Pod Autoscaling Limitations.
Contents
Create HorizontalPodAutoscaler
Let’s start with a simple HPA which will scale pods basing on CPU usage:
apiVersion: autoscaling/v1
kind: HorizontalPodAutoscaler
metadata:
  name: hpa-example
spec:
  scaleTargetRef:
    apiVersion: apps/v1
    kind: Deployment
    name: deployment-example
  minReplicas: 1
  maxReplicas: 5
  targetCPUUtilizationPercentage: 10
Here:
apiVersion: autoscaling/v1– an API groupautoscaling, pay attention to the API version, as in thev1at the time of writing, scaling was available by the CPU metrics only, thus memory and custom metrics can be used only with the APIv2beta2(still, you can usev1with annotations), see API Object.spec.scaleTargetRef: specify for НРА which controller will be scaled (ReplicationController,Deployment,ReplicaSet), in this case, HPA will look for theDeploymentobject called deployment-examplespec.minReplicas,spec.maxReplicas: minimal and maximum pods to be running by this HPAtargetCPUUtilizationPercentage: CPU usage % from therequestswhen HPA will add or remove pods
Create it:
[simterm]
$ kubectl apply -f hpa-example.yaml
horizontalpodautoscaler.autoscaling/hpa-example created
[/simterm]
Check:
[simterm]
$ kubectl get hpa hpa-example
NAME          REFERENCE                       TARGETS         MINPODS   MAXPODS   REPLICAS   AGE
hpa-example   Deployment/deployment-example   <unknown>/10%   1         5         0          89s
[/simterm]
Currently, its TARGETS has the <unknown> value as there are no pods created yet, but metrics are already available:
[simterm]
$ kubectl get --raw "/apis/metrics.k8s.io/" | jq
{
  "kind": "APIGroup",
  "apiVersion": "v1",
  "name": "metrics.k8s.io",
  "versions": [
    {
      "groupVersion": "metrics.k8s.io/v1beta1",
      "version": "v1beta1"
    }
  ],
  "preferredVersion": {
    "groupVersion": "metrics.k8s.io/v1beta1",
    "version": "v1beta1"
  }
}
[/simterm]
Add the called deployment-example Deployment:
apiVersion: apps/v1
kind: Deployment
metadata:
  name: deployment-example
spec:
  replicas: 1
  strategy:
    type: RollingUpdate
  selector:
    matchLabels:
      application: deployment-example
  template:
    metadata:
      labels:
        application: deployment-example
    spec:
      containers:
      - name: deployment-example-pod
        image: nginx
        ports:
          - containerPort: 80
        resources:
          requests:
            cpu: 100m
            memory: 100Mi
Here we defined Deployment which will spin up one pod with NINGX with requests for 100 millicores and 100 mebibyte memory, see Kubernetes best practices: Resource requests and limits.
Create it:
[simterm]
$ kubectl apply -f hpa-deployment-example.yaml
deployment.apps/deployment-example created
[/simterm]
Check the HPA now:
[simterm]
$ kubectl get hpa hpa-example
NAME          REFERENCE                       TARGETS   MINPODS   MAXPODS   REPLICAS   AGE
hpa-example   Deployment/deployment-example   0%/10%    1         5         1          14m
[/simterm]
Our НРА found the deployment and started checking its pods’ metrics.
Let’s check those metrics – find a pod:
[simterm]
$ kubectl get pod | grep example | cut -d " " -f 1
deployment-example-86c47f5897-2mzjd
[/simterm]
And run the following API request:
[simterm]
$ kubectl get --raw /apis/metrics.k8s.io/v1beta1/namespaces/default/pods/deployment-example-86c47f5897-2mzjd | jq
{
  "kind": "PodMetrics",
  "apiVersion": "metrics.k8s.io/v1beta1",
  "metadata": {
    "name": "deployment-example-86c47f5897-2mzjd",
    "namespace": "default",
    "selfLink": "/apis/metrics.k8s.io/v1beta1/namespaces/default/pods/deployment-example-86c47f5897-2mzjd",
    "creationTimestamp": "2020-08-07T10:41:21Z"
  },
  "timestamp": "2020-08-07T10:40:39Z",
  "window": "30s",
  "containers": [
    {
      "name": "deployment-example-pod",
      "usage": {
        "cpu": "0",
        "memory": "2496Ki"
      }
    }
  ]
}
[/simterm]
CPU usage – zero, memory – 2 megabytes, let’s confirm with top:
[simterm]
$ kubectl top pod deployment-example-86c47f5897-2mzjd
NAME                                  CPU(cores)   MEMORY(bytes)
deployment-example-86c47f5897-2mzjd   0m           2Mi
[/simterm]
“Alright, these guys!” (с)
Okay – we got our metrics, we’ve created the HPA and deployment – let’s go to see how the scaling will work here.
Load testing HorizontalPodAutoscaler scaling
For load testing, we can use the loadimpact/loadgentest-wrk utility image.
Now, run ports redirect from the local workstation to the pod with NGINX, as we didn’t add any LoadBalancer (see Kubernetes: ClusterIP vs NodePort vs LoadBalancer, Services, and Ingress – an overview with examples):
[simterm]
$ kubectl port-forward deployment-example-86c47f5897-2mzjd 8080:80
Forwarding from 127.0.0.1:8080 -> 80
Forwarding from [::1]:8080 -> 80
[/simterm]
Check resources once again:
[simterm]
$ kubectl get hpa hpa-example
NAME          REFERENCE                       TARGETS   MINPODS   MAXPODS   REPLICAS   AGE
hpa-example   Deployment/deployment-example   0%/10%    1         5         1          33m
[/simterm]
0% CPU is used, one pod is running (REPLICAS 1).
Run the test:
[simterm]
$ docker run --rm --net=host loadimpact/loadgentest-wrk -c 100 -t 100 -d 5m http://127.0.0.1:8080
Running 5m test @ http://127.0.0.1:8080
[/simterm]
Here:
- open 100 connections using 100 threads
- run the test for 5 minutes
Check the pod:
[simterm]
$ kubectl top pod deployment-example-86c47f5897-2mzjd
NAME                                  CPU(cores)   MEMORY(bytes)
deployment-example-86c47f5897-2mzjd   49m          2Mi
[/simterm]
CPU usage now 49mi, and in the requests, we’ve set the 10 milicpu limit – check the HPA:
[simterm]
$ kubectl get hpa hpa-example
NAME          REFERENCE                       TARGETS   MINPODS   MAXPODS   REPLICAS   AGE
hpa-example   Deployment/deployment-example   49%/10%   1         5         4          42m
[/simterm]
TARGETS 49% from the 10% limit and our HPA started new pods – REPLICAS 4:
[simterm]
$ kubectl get pod | grep example
deployment-example-86c47f5897-2mzjd    1/1     Running   0          31m
deployment-example-86c47f5897-4ntd4    1/1     Running   0          24s
deployment-example-86c47f5897-p7tc7    1/1     Running   0          8s
deployment-example-86c47f5897-q49gk    1/1     Running   0          24s
deployment-example-86c47f5897-zvdvz    1/1     Running   0          24s
[/simterm]
Multi-metrics scaling
Okay, we were able to scale by the CPU usage, but what if you want to scale by both CPU and memory usage?
Add another Resource with memory limit set to the same 10%:
apiVersion: autoscaling/v2beta1
kind: HorizontalPodAutoscaler
metadata:
  name: hpa-example
spec:
  scaleTargetRef:
    apiVersion: apps/v1
    kind: Deployment
    name: deployment-example
  minReplicas: 1
  maxReplicas: 5
  metrics:
  - type: Resource
    resource:
      name: cpu
      targetAverageUtilization: 10
  - type: Resource
    resource:
      name: memory
      targetAverageUtilization: 10
autoscaling API group versions
Let’s go back to the API versions.
In the first manifest for our HPA, we’ve used the autoscaling/v1 API which has the only targetCPUUtilizationPercentage parameter.
Check the autoscaling/v2beta1 – now, it has the metrics field added which is the MetricSpec array which can hold for new fields – the external, object, pods, resource.
in its turn the resource has the ResourceMetricSource, which holds two fields – targetAverageUtilization, and targetAverageValue, which are used now in themertics insted of the targetCPUUtilizationPercentage.
Apply the HPA update:
[simterm]
$ kubectl apply -f hpa-example.yaml
horizontalpodautoscaler.autoscaling/hpa-example configured
[/simterm]
Check it:
[simterm]
$ kubectl get hpa hpa-example
NAME          REFERENCE                       TARGETS          MINPODS   MAXPODS   REPLICAS   AGE
hpa-example   Deployment/deployment-example   3%/10%, 0%/10%   1         5         2          126m
[/simterm]
The TARGETS now displaying two metrics – CPU and memory.
It’s hard to make NGINX consume a lot of memory, so let’s go to see how much it uses now with the following kubectl command:
[simterm]
$ kubectl get --raw /apis/metrics.k8s.io/v1beta1/namespaces/default/pods/deployment-example-c4d6f96db-jv6nm | jq '.containers[].usage.memory'
"2824Ki"
[/simterm]
2 megabytes.
Let’s update our PHA once again and set a new limit, but at this time we’ll use raw values instead of the percent – 1024Ki, 1 megabyte using targetAverageUtilization instead of the previously used targetAverageUtilization:
...
  metrics:
  - type: Resource
    resource:
      name: cpu
      targetAverageUtilization: 10
  - type: Resource
    resource:
      name: memory
      targetAverageValue: 1024Ki
Apply and check:
[simterm]
$ kubectl get hpa hpa-example
NAME          REFERENCE                       TARGETS               MINPODS   MAXPODS   REPLICAS   AGE
hpa-example   Deployment/deployment-example   2551808/1Mi, 0%/10%   1         5         3          2m8s
[/simterm]
REPLICAS == 3 now, pods were scaled, check the value from the TARGETS – convert it to kilobytes:
[simterm]
$ echo 2551808/1024 | bc
2492
[/simterm]
And check real memory usage:
[simterm]
$ kubectl get --raw /apis/metrics.k8s.io/v1beta1/namespaces/default/pods/deployment-example-c4d6f96db-fldl2 | jq '.containers[].usage.memory'
"2496Ki"
[/simterm]
2492 ~= 2496Ki.
Okay, so – we are able now to scale the Deployment by both CPU and memory usage.
Custom Metrics
Memory metrics scaling
Apart from metrics provided by the API server and cAdvisor we can use any other metrics, for example – metrics, collected by Prometheus.
It can be metrics collected by a Cloudwatch exporter, Prometheus’ node_exporter, or metrics from an application.
Documention is here>>>.
As we are using Prometheus (see Kubernetes: monitoring with Prometheus – exporters, a Service Discovery, and its roles and Kubernetes: a cluster’s monitoring with the Prometheus Operator) so let’s add its adapter:
If you’ll try to access external or custom API endpoints now you’ll get the error:
[simterm]
$ kubectl get --raw /apis/custom.metrics.k8s.io/
Error from server (NotFound): the server could not find the requested resource

$ kubectl get --raw /apis/external.metrics.k8s.io/
Error from server (NotFound): the server could not find the requested resource
[/simterm]
Install the adapter from the Helm chart:
[simterm]
$ helm install prometheus-adapter stable/prometheus-adapter
NAME: prometheus-adapter
LAST DEPLOYED: Sat Aug  8 13:27:36 2020
NAMESPACE: default
STATUS: deployed
REVISION: 1
TEST SUITE: None
NOTES:
prometheus-adapter has been deployed.
In a few minutes you should be able to list metrics using the following command(s):

  kubectl get --raw /apis/custom.metrics.k8s.io/v1beta
[/simterm]
Wait for a minute or two and check API again:
[simterm]
$ kubectl get --raw="/apis/custom.metrics.k8s.io/v1beta1" | jq .
{
  "kind": "APIResourceList",
  "apiVersion": "v1",
  "groupVersion": "custom.metrics.k8s.io/v1beta1",
  "resources": []
}
[/simterm]
Well, but why the "resources":[] is empty?
Check the adapter’s pod logs:
[simterm]
$ kubectl logs -f prometheus-adapter-b8945f4d8-q5t6x
I0808 10:45:47.706771       1 adapter.go:94] successfully using in-cluster auth
E0808 10:45:47.752737       1 provider.go:209] unable to update list of all metrics: unable to fetch metrics for query "{__name__=~\"^container_.*\",container!=\"POD\",namespace!=\"\",pod!=\"\"}": Get http://prometheus.default.svc:9090/api/v1/series?match%5B%5D=%7B__name__%3D~%22%5Econtainer_.%2A%22%2Ccontainer%21%3D%22POD%22%2Cnamespace%21%3D%22%22%2Cpod%21%3D%22%22%7D&start=1596882347.736: dial tcp: lookup prometheus.default.svc on 172.20.0.10:53: no such host
I0808 10:45:48.032873       1 serving.go:306] Generated self-signed cert (/tmp/cert/apiserver.crt, /tmp/cert/apiserver.key)
...
[/simterm]
Here is the error:
dial tcp: lookup prometheus.default.svc on 172.20.0.10:53: no such host
Let try to access our Prometheus Operator from the pod by its Service DNS name:
[simterm]
$ kubectl exec -ti deployment-example-c4d6f96db-fldl2 curl prometheus-prometheus-oper-prometheus.monitoring.svc.cluster.local:9090/metrics | head -5
# HELP go_gc_duration_seconds A summary of the pause duration of garbage collection cycles.
# TYPE go_gc_duration_seconds summary
go_gc_duration_seconds{quantile="0"} 2.0078e-05
go_gc_duration_seconds{quantile="0.25"} 3.8669e-05
go_gc_duration_seconds{quantile="0.5"} 6.956e-05
[/simterm]
Okay, we are able to reach it using the prometheus-prometheus-oper-prometheus.monitoring.svc.cluster.local:9090 URL.
Edit the adapter’s Deployment:
[simterm]
$ kubectl edit deploy prometheus-adapter
[/simterm]
Update its prometheus-url:
...
    spec:
      affinity: {}
      containers:
      - args:
        - /adapter
        - --secure-port=6443
        - --cert-dir=/tmp/cert
        - --logtostderr=true
        - --prometheus-url=http://prometheus-prometheus-oper-prometheus.monitoring.svc.cluster.local:9090
...
Apply changes and check again:
[simterm]
$ kubectl get --raw "/apis/custom.metrics.k8s.io/v1beta1" | jq .  |grep "pods/" | head -5
      "name": "pods/node_load15",
      "name": "pods/go_memstats_next_gc_bytes",
      "name": "pods/coredns_forward_request_duration_seconds_count",
      "name": "pods/rest_client_requests",
      "name": "pods/node_ipvs_incoming_bytes",
[/simterm]
Nice – we’ve got our metrics and can use them now in the HPA.
Check the API server for the memory_usage_bytes metric:
[simterm]
$ kubectl get --raw="/apis/custom.metrics.k8s.io/v1beta1/namespaces/default/pods/*/memory_usage_bytes" | jq .
{
  "kind": "MetricValueList",
  "apiVersion": "custom.metrics.k8s.io/v1beta1",
  "metadata": {
    "selfLink": "/apis/custom.metrics.k8s.io/v1beta1/namespaces/default/pods/%2A/memory_usage_bytes"
  },
  "items": [
    {
      "describedObject": {
        "kind": "Pod",
        "namespace": "default",
        "name": "deployment-example-c4d6f96db-8tfnw",
        "apiVersion": "/v1"
      },
      "metricName": "memory_usage_bytes",
      "timestamp": "2020-08-08T11:18:53Z",
      "value": "11886592",
      "selector": null
    },
...
[/simterm]
Update the НРА’s manifest:
apiVersion: autoscaling/v2beta1
kind: HorizontalPodAutoscaler
metadata:
  name: hpa-example
spec:
  scaleTargetRef:
    apiVersion: apps/v1
    kind: Deployment
    name: deployment-example
  minReplicas: 1
  maxReplicas: 5
  metrics:
  - type: Pods
    pods:
      metricName: memory_usage_bytes
      targetAverageValue: 1024000
Check the HPA’s values now:
[simterm]
$ kubectl get hpa hpa-example
NAME          REFERENCE                       TARGETS               MINPODS   MAXPODS   REPLICAS   AGE
hpa-example   Deployment/deployment-example   4694016/1Mi, 0%/10%   1         5         5          69m
[/simterm]
Apply the latest changes:
[simterm]
$ kubectl apply -f hpa-example.yaml
horizontalpodautoscaler.autoscaling/hpa-example configured
[/simterm]
Check again:
[simterm]
$ kubectl get hpa hpa-example
NAME          REFERENCE                       TARGETS          MINPODS   MAXPODS   REPLICAS   AGE
hpa-example   Deployment/deployment-example   11853824/1024k   1         5         1          16s
[/simterm]
Still have 1 replica, check events:
[simterm]
...
43s         Normal    ScalingReplicaSet   Deployment                Scaled up replica set deployment-example-c4d6f96db to 1
16s         Normal    ScalingReplicaSet   Deployment                Scaled up replica set deployment-example-c4d6f96db to 4
1s          Normal    ScalingReplicaSet   Deployment                Scaled up replica set deployment-example-c4d6f96db to 5
16s         Normal    SuccessfulRescale   HorizontalPodAutoscaler   New size: 4; reason: pods metric memory_usage_bytes above target
1s          Normal    SuccessfulRescale   HorizontalPodAutoscaler   New size: 5; reason: pods metric memory_usage_bytes above target
...
[/simterm]
And HPA again:
[simterm]
$ kubectl get hpa hpa-example
NAME          REFERENCE                       TARGETS             MINPODS   MAXPODS   REPLICAS   AGE
hpa-example   Deployment/deployment-example   6996787200m/1024k   1         5         5          104s
[/simterm]
Great – “It works!” (c)
And it’s good for metrics which are already present in the cluster like the memory_usage_bytes by default collected by the cAdvisor from all containers in the cluster.
Let’s try to use more custom metrics, for example – let’s scale a Gorush-server by using its own metrics, see Kubernetes: running a push-server with Gorush behind an AWS LoadBalancer.
Application-based metrics scaling
So, we have the Gorush server running in our cluster which is used to send push-notifications to mobile clients.
It has the built-in /metrics endpoint which returns standard time-series metrics that can be used in Prometheus.
To run the testing Gorush server we can use such Service, ConfigMap, andDeployment:
apiVersion: v1
kind: Service
metadata:
  name: gorush
  labels:
    app: gorush
    tier: frontend
spec:
  selector:
    app: gorush
    tier: frontend
  type: ClusterIP
  ports:
  - name: gorush
    protocol: TCP
    port: 80
    targetPort: 8088
---
apiVersion: v1
kind: ConfigMap
metadata:
  name: gorush-config
data:
  stat.engine: memory
---
apiVersion: apps/v1
kind: Deployment
metadata:
  name: gorush
spec:
  replicas: 1
  selector:
    matchLabels:
      app: gorush
      tier: frontend
  template:
    metadata:
      labels:
        app: gorush
        tier: frontend
    spec:
      containers:
      - image: appleboy/gorush
        name: gorush
        imagePullPolicy: Always
        ports:
        - containerPort: 8088
        livenessProbe:
          httpGet:
            path: /healthz
            port: 8088
          initialDelaySeconds: 3
          periodSeconds: 3
        env:
        - name: GORUSH_STAT_ENGINE
          valueFrom:
            configMapKeyRef:
              name: gorush-config
              key: stat.engine
Create a dedciated namespace:
[simterm]
$ kubectl create ns eks-dev-1-gorush
namespace/eks-dev-1-gorush created
[/simterm]
Create the application:
[simterm]
$ kubectl -n eks-dev-1-gorush apply -f my-gorush.yaml
service/gorush created
configmap/gorush-config created
deployment.apps/gorush created
[/simterm]
Check pods:
[simterm]
$ kubectl -n eks-dev-1-gorush get pod
NAME                      READY   STATUS        RESTARTS   AGE
gorush-5c6775748b-6r54h   1/1     Running       0          83s
[/simterm]
Gorush Service:
[simterm]
$ kubectl -n eks-dev-1-gorush get svc
NAME     TYPE        CLUSTER-IP       EXTERNAL-IP   PORT(S)   AGE
gorush   ClusterIP   172.20.186.251   <none>        80/TCP    103s
[/simterm]
Run the port-forward to its pod:
[simterm]
$ kubectl -n eks-dev-1-gorush port-forward gorush-5c6775748b-6r54h 8088:8088
Forwarding from 127.0.0.1:8088 -> 8088
Forwarding from [::1]:8088 -> 8088
[/simterm]
Check metrcis:
[simterm]
$ curl -s localhost:8088/metrics | grep gorush | head
# HELP gorush_android_fail Number of android fail count
# TYPE gorush_android_fail gauge
gorush_android_fail 0
# HELP gorush_android_success Number of android success count
# TYPE gorush_android_success gauge
gorush_android_success 0
# HELP gorush_ios_error Number of iOS fail count
# TYPE gorush_ios_error gauge
gorush_ios_error 0
# HELP gorush_ios_success Number of iOS success count
[/simterm]
Or another way: by using its Service name, we can reach it directly.
Find the Service:
[simterm]
$ kubectl -n eks-dev-1-gorush get svc
NAME     TYPE        CLUSTER-IP       EXTERNAL-IP   PORT(S)   AGE
gorush   ClusterIP   172.20.186.251   <none>        80/TCP    26m
[/simterm]
Open proxy to the API-server:
[simterm]
$ kubectl proxy --port=8080
Starting to serve on 127.0.0.1:8080
[/simterm]
And connect to the Service:
[simterm]
$ curl -sL localhost:8080/api/v1/namespaces/eks-dev-1-gorush/services/gorush:gorush/proxy/metrics | head
# HELP go_gc_duration_seconds A summary of the GC invocation durations.
# TYPE go_gc_duration_seconds summary
go_gc_duration_seconds{quantile="0"} 9.194e-06
go_gc_duration_seconds{quantile="0.25"} 1.2092e-05
go_gc_duration_seconds{quantile="0.5"} 2.1812e-05
go_gc_duration_seconds{quantile="0.75"} 5.1794e-05
go_gc_duration_seconds{quantile="1"} 0.000145631
go_gc_duration_seconds_sum 0.001080551
go_gc_duration_seconds_count 32
# HELP go_goroutines Number of goroutines that currently exist.
[/simterm]
Kubernetes ServiceMonitor
The next thing to do is to add a ServiceMonitor to the Kubernetes cluster for our Prometheus Operator which will collect those metrics, check the Adding Kubernetes ServiceMonitor.
Check metrics now with port-forward:
[simterm]
$ kk -n monitoring port-forward prometheus-prometheus-prometheus-oper-prometheus-0 9090:9090
Forwarding from [::1]:9090 -> 9090
Forwarding from 127.0.0.1:9090 -> 9090
[/simterm]
Try to access them:
[simterm]
$ curl "localhost:9090/api/v1/series?match[]=gorush_total_push_count&start=1597141864"
{"status":"success","data":[]}
[/simterm]
The "data":[] is empty now – or Prometheus doesn’t collect those metrics yet.
Define the ServiceMonitor:
apiVersion: monitoring.coreos.com/v1
kind: ServiceMonitor
metadata:
  labels:
    serviceapp: gorush-servicemonitor
    release: prometheus
  name: gorush-servicemonitor
  namespace: monitoring
spec:
  endpoints:
  - bearerTokenFile: /var/run/secrets/kubernetes.io/serviceaccount/token
    interval: 15s
    port: gorush
  namespaceSelector:
    matchNames:
    - eks-dev-1-gorush
  selector:
    matchLabels:
      app: gorush
Note: The Prometheus resource includes a field called serviceMonitorSelector, which defines a selection of ServiceMonitors to be used. By default and before the version v0.19.0, ServiceMonitors must be installed in the same namespace as the Prometheus instance. With the Prometheus Operator v0.19.0 and above, ServiceMonitors can be selected outside the Prometheus namespace via the serviceMonitorNamespaceSelector field of the Prometheus resource.
See Prometheus Operator
Create this ServiceMonitor:
[simterm]
$ kubectl apply -f ../../gorush-service-monitor.yaml
servicemonitor.monitoring.coreos.com/gorush-servicemonitor created
[/simterm]
Check it in the Targets:
UP, good.
And in a couple of minutes check for metrics again:
[simterm]
$ curl "localhost:9090/api/v1/series?match[]=gorush_total_push_count&start=1597141864"
{"status":"success","data":[{"__name__":"gorush_total_push_count","endpoint":"gorush","instance":"10.3.35.14:8088","job":"gorush","namespace":"eks-dev-1-gorush","pod":"gorush-5c6775748b-6r54h","service":"gorush"}]}
[/simterm]
Or in this way:
[simterm]
$ curl -s localhost:9090/api/v1/label/__name__/values | jq | grep gorush
    "gorush_android_fail",
    "gorush_android_success",
    "gorush_ios_error",
    "gorush_ios_success",
    "gorush_queue_usage",
    "gorush_total_push_count",
[/simterm]
Nice, we’ve got our metrics, let’s go ahead and use them in the HorizontalPodAutoscaler of this Deployment.
Check the metrics groups available here:
[simterm]
$ kubectl get --raw "/apis/custom.metrics.k8s.io/v1beta1" | jq .  | grep "gorush"
      "name": "services/gorush_android_success",
      "name": "pods/gorush_android_fail",
      "name": "namespaces/gorush_total_push_count",
      "name": "namespaces/gorush_queue_usage",
      "name": "pods/gorush_ios_success",
      "name": "namespaces/gorush_ios_success",
      "name": "jobs.batch/gorush_ios_error",
      "name": "services/gorush_total_push_count",
      "name": "jobs.batch/gorush_queue_usage",
      "name": "pods/gorush_queue_usage",
      "name": "jobs.batch/gorush_android_fail",
      "name": "services/gorush_queue_usage",
      "name": "services/gorush_ios_success",
      "name": "jobs.batch/gorush_android_success",
      "name": "jobs.batch/gorush_total_push_count",
      "name": "pods/gorush_ios_error",
      "name": "pods/gorush_total_push_count",
      "name": "pods/gorush_android_success",
      "name": "namespaces/gorush_android_success",
      "name": "namespaces/gorush_android_fail",
      "name": "namespaces/gorush_ios_error",
      "name": "jobs.batch/gorush_ios_success",
      "name": "services/gorush_ios_error",
      "name": "services/gorush_android_fail",
[/simterm]
Add a new manifest with the HPA which will use the gorush_queue_usage from the Pods group:
apiVersion: autoscaling/v2beta1
kind: HorizontalPodAutoscaler
metadata:
  name: gorush-hpa
spec:
  scaleTargetRef:
    apiVersion: apps/v1
    kind: Deployment
    name: gorush
  minReplicas: 1
  maxReplicas: 5
  metrics:
  - type: Pods
    pods:
      metricName: gorush_total_push_count
      targetAverageValue: 2
With such settings, the HPA has to scale pods once the gorush_total_push_count‘s value will be over 2.
Create it:
[simterm]
$ kubectl -n eks-dev-1-gorush apply -f my-gorush.yaml
service/gorush unchanged
configmap/gorush-config unchanged
deployment.apps/gorush unchanged
horizontalpodautoscaler.autoscaling/gorush-hpa created
[/simterm]
Check its value now:
[simterm]
$ kubectl get --raw="/apis/custom.metrics.k8s.io/v1beta1/namespaces/eks-dev-1-gorush/pods/*/gorush_total_push_count" | jq '.items[].value'
"0"
[/simterm]
Check the НРА:
[simterm]
$ kubectl -n eks-dev-1-gorush get hpa
NAME         REFERENCE           TARGETS   MINPODS   MAXPODS   REPLICAS   AGE
gorush-hpa   Deployment/gorush   0/1       1         5         1          17s
[/simterm]
TARGETS 0/1, okay.
Send a push:
[simterm]
$ curl -X POST a6095d18859c849889531cf08baa6bcf-531932299.us-east-2.elb.amazonaws.com/api/push -d '{"notifications":[{"tokens":["990004543798742"],"platform":2,"message":"Hello Android"}]}'
{"counts":1,"logs":[],"success":"ok"}
[/simterm]
Check the gorush_total_push_count metric again:
[simterm]
$ kubectl get --raw="/apis/custom.metrics.k8s.io/v1beta1/namespaces/eks-dev-1-gorush/pods/*/gorush_total_push_count" | jq '.items[].value'
"1"
[/simterm]
One push was sent.
Check the HPA one more time:
[simterm]
$ kubectl -n eks-dev-1-gorush get hpa
NAME         REFERENCE           TARGETS   MINPODS   MAXPODS   REPLICAS   AGE
gorush-hpa   Deployment/gorush   1/2       1         5         1          9m42s
[/simterm]
TARGETS 1/2, REPLICAS still has 1, send another push and check the events:
[simterm]
$ kubectl -n eks-dev-1-gorush get events --watch
LAST SEEN   TYPE     REASON                 KIND                      MESSAGE
18s         Normal   Scheduled              Pod                       Successfully assigned eks-dev-1-gorush/gorush-5c6775748b-x8fjs to ip-10-3-49-200.us-east-2.compute.internal
17s         Normal   Pulling                Pod                       Pulling image "appleboy/gorush"
17s         Normal   Pulled                 Pod                       Successfully pulled image "appleboy/gorush"
17s         Normal   Created                Pod                       Created container gorush
17s         Normal   Started                Pod                       Started container gorush
18s         Normal   SuccessfulCreate       ReplicaSet                Created pod: gorush-5c6775748b-x8fjs
18s         Normal   SuccessfulRescale      HorizontalPodAutoscaler   New size: 2; reason: pods metric gorush_total_push_count above target
18s         Normal   ScalingReplicaSet      Deployment                Scaled up replica set gorush-5c6775748b to 2
[/simterm]
And the HPA:
[simterm]
$ kubectl -n eks-dev-1-gorush get hpa
NAME         REFERENCE           TARGETS   MINPODS   MAXPODS   REPLICAS   AGE
gorush-hpa   Deployment/gorush   3/2       1         5         2          10m
[/simterm]
Great! So, scaling by the gorush_total_push_count is working.
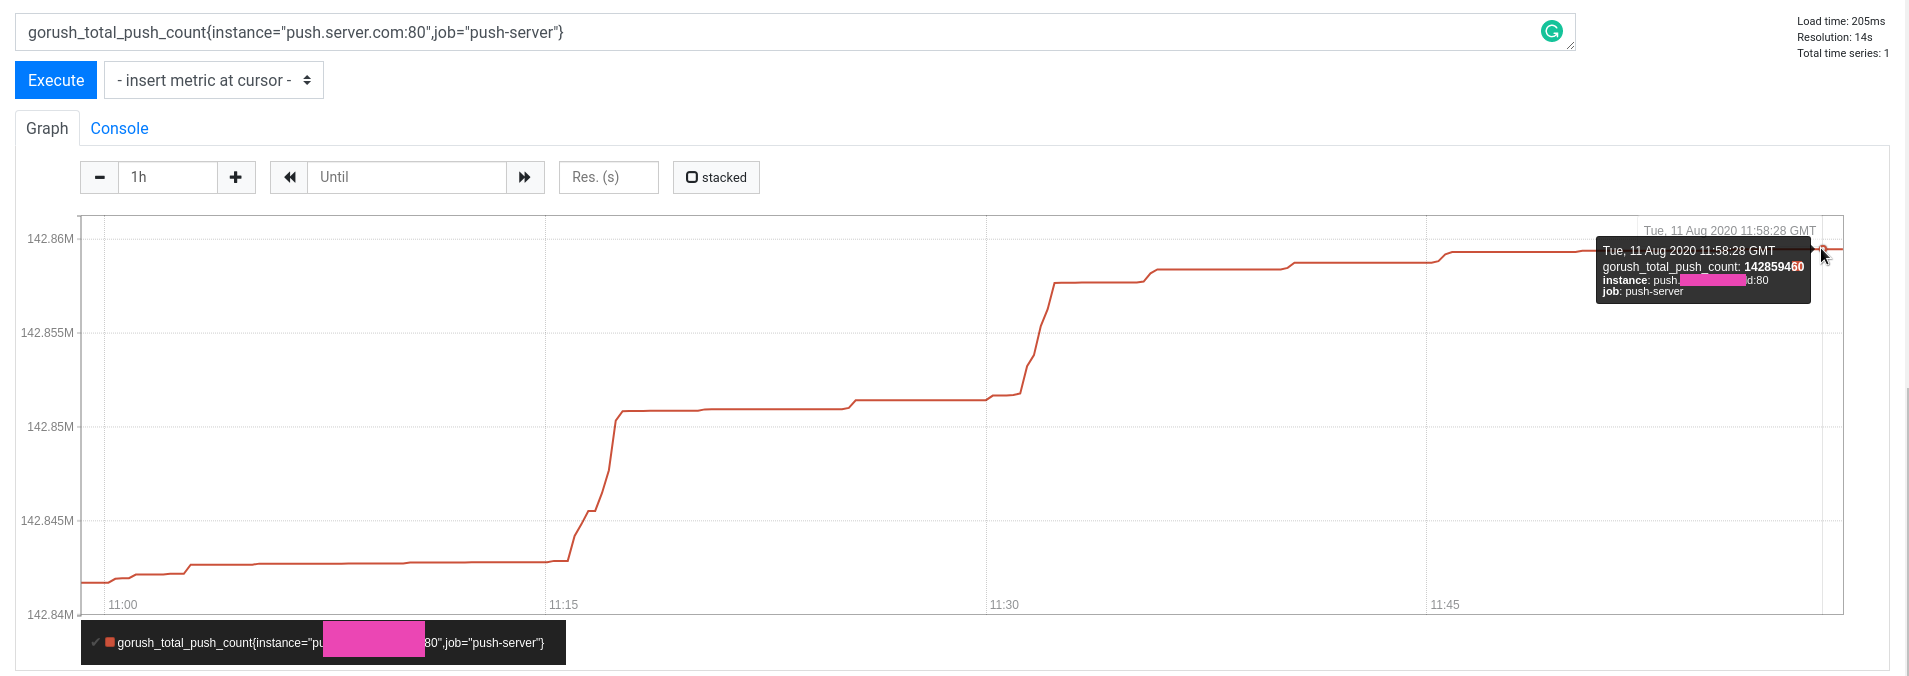
But here a trap: the gorush_total_push_count is cumulative metric, e.g. on the Production graph it will look like the next:
And in such a case our HPA will scale pods till the end of time.
Prometheus Adapter ConfigMap – seriesQuery and metricsQuery
To mitigate this let’s add an own metric.
The Prometheus Adapter has its own ConfigMap:
[simterm]
$ kubectl get cm prometheus-adapter
NAME                 DATA   AGE
prometheus-adapter   1      46h
[/simterm]
Wich contains the config.yaml, see its example here>>>.
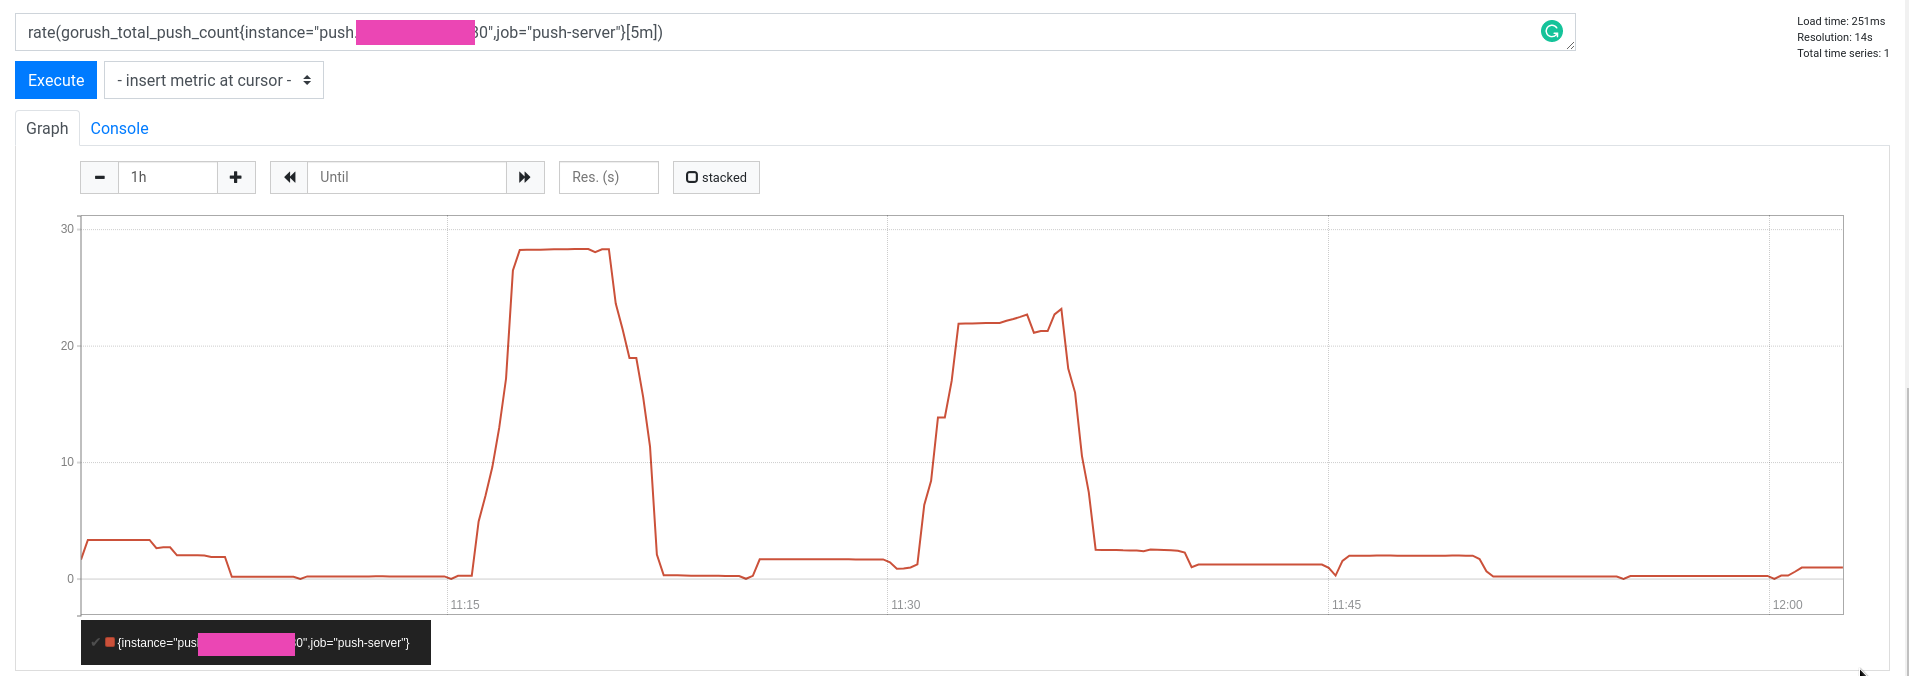
Create a PromQL query which will return pushes count per second:
rate(gorush_total_push_count{instance="push.server.com:80",job="push-server"}[5m])
Update the ConfigMap and add new query there:
apiVersion: v1
data:
  config.yaml: |
    rules:
    - seriesQuery: '{__name__=~"gorush_total_push_count"}'
      seriesFilters: []
      resources:
        overrides:
          namespace:
            resource: namespace
          pod:
            resource: pod
      name:
        matches: ""
        as: "gorush_push_per_second"
      metricsQuery: rate(<<.Series>>{<<.LabelMatchers>>}[5m])
Save and exit, check it:
[simterm]
$ kubectl get --raw="/apis/custom.metrics.k8s.io/v1beta1/namespaces/eks-dev-1-gorush/pods/*/gorush_push_per_second" | jq
Error from server (NotFound): the server could not find the metric gorush_push_per_second for pods
[/simterm]
Re-create the pod so it will apply the changes (see Kubernetes: ConfigMap and Secrets – data auto-reload in pods):
[simterm]
$ kubectl delete pod prometheus-adapter-7c56787c5c-kllq6
pod "prometheus-adapter-7c56787c5c-kllq6" deleted
[/simterm]
Check it:
[simterm]
$ kubectl get --raw="/apis/custom.metrics.k8s.io/v1beta1/namespaces/eks-dev-1-gorush/pods/*/gorush_push_per_second" | jq
{
  "kind": "MetricValueList",
  "apiVersion": "custom.metrics.k8s.io/v1beta1",
  "metadata": {
    "selfLink": "/apis/custom.metrics.k8s.io/v1beta1/namespaces/eks-dev-1-gorush/pods/%2A/gorush_push_per_second"
  },
  "items": [
    {
      "describedObject": {
        "kind": "Pod",
        "namespace": "eks-dev-1-gorush",
        "name": "gorush-5c6775748b-6r54h",
        "apiVersion": "/v1"
      },
      "metricName": "gorush_push_per_second",
      "timestamp": "2020-08-11T12:28:03Z",
      "value": "0",
      "selector": null
    },
...
[/simterm]
Update the НРА to use the gorush_push_per_second:
apiVersion: autoscaling/v2beta1
kind: HorizontalPodAutoscaler
metadata:
  name: gorush-hpa
spec:
  scaleTargetRef:
    apiVersion: apps/v1
    kind: Deployment
    name: gorush
  minReplicas: 1
  maxReplicas: 5
  metrics:
  - type: Pods
    pods:
      metricName: gorush_push_per_second
      targetAverageValue: 1m
Check it:
[simterm]
$ kubectl -n eks-dev-1-gorush get hpa
NAME         REFERENCE           TARGETS   MINPODS   MAXPODS   REPLICAS   AGE
gorush-hpa   Deployment/gorush   0/1m      1         5         1          68m
[/simterm]
Events:
[simterm]
...
0s    Normal   SuccessfulRescale   HorizontalPodAutoscaler   New size: 4; reason: pods metric gorush_push_per_second above target
0s    Normal   ScalingReplicaSet   Deployment   Scaled up replica set gorush-5c6775748b to 4
...
[/simterm]
And tje HPA now:
[simterm]
$ kubectl -n eks-dev-1-gorush get hpa
NAME         REFERENCE           TARGETS   MINPODS   MAXPODS   REPLICAS   AGE
gorush-hpa   Deployment/gorush   11m/1m    1         5         5          70m
[/simterm]
Done.
Useful links
- Kubernetes Autoscaling in Production: Best Practices for Cluster Autoscaler, HPA and VPA
- Ultimate Kubernetes Resource Planning Guide
- Horizontal Autoscaling in Kubernetes #2 – Custom Metrics
- Kubernetes HPA : ExternalMetrics+Prometheus
- Prometheus Custom Metrics Adapter
- Horizontal Pod Autoscaling (HPA) triggered by Kafka event
- Custom and external metrics for autoscaling workloads
- Prometheus Metrics Based Autoscaling in Kubernetes
- Kubernetes best practices: Resource requests and limits
- Знакомство с Kubernetes. Часть 19: HorizontalPodAutoscaler
- How to Use Kubernetes for Autoscaling
- Horizontal Pod Autoscaling by memory
- Autoscaling apps on Kubernetes with the Horizontal Pod Autoscaler
- Horizontally autoscale Kubernetes deployments on custom metrics
- Kubernetes pod autoscaler using custom metrics
- Kubernetes HPA Autoscaling with Custom and External Metrics
- Horizontal pod auto scaling by using custom metrics
- Horizontal Pod Autoscale with Custom Prometheus Metrics
- Kubernetes HPA using Custom Metrics
- Kubernetes HPA Autoscaling with Custom Metrics
- Building a K8s Autoscaler with Custom Metrics
![]()


