 The next task with our Kubernetes cluster is to set up its monitoring with Prometheus.
This task is complicated by the fact, that there is the whole bunch of resources needs to be monitored:
- from the infrastructure side – ЕС2 WokerNodes instances, their CPU, memory, network, disks, etc
- key services of Kubernetes itself – its API server stats, etcd, scheduler
- deployments, pods and containers state
- and need to collect some metrics from applications running in the cluster
To monitor all of these the following tools can be used:
metrics-server– CPU, memory, file-descriptors, disks, etc of the clustercAdvisor– a Docker daemon metrics – containers monitoringkube-state-metrics– deployments, pods, nodesnode-exporter: EC2 instances metrics – CPU, memory, network
What we will do in this post?
- will spin up a Prometheus server
- spin up a Redis server and the
redis-exporterto grab the Redis server metrics - will add a ClusterRole for the Prometheus
- will configure Prometheus Kubernetes Service Discovery to collect metrics:
- will take a view on the Prometheus Kubernetes Service Discovery roles
- will add more exporters:
- node-exporter
- kube-state-metrics
- cAdvisor metrics
- and the metrics-server
How this will work altogether?
The Prometheus Federation will be used:
- we already have Prometheus-Grafana stack in my project which is used to monitor already existing resources – this will be our “central” Prometheus server which will PULL metrics from other Prometheus server in a Kubernetes cluster (all our AWS VPC networks are interconnected via VPC peering and metrics will go via private subnetting)
- in an EKS cluster, we will spin up additional Prometheus server which will PULL metrics from the cluster and exporters and later will hand them over to the “central” Prometheus
helm install
In the 99% guides, I found during an investigation the Kubernetes and Prometheus monitoring all the installation and configuration was confined to the only one “helm install” command.
Helm it’s, of course, great – a templating, a package manager in one tool, but the problem is that it will do a lot of things under the hood, but now I want to understand what’s exactly is going on there.
By the fact, this is the following part of the AWS Elastic Kubernetes Service: a cluster creation automation, part 1 – CloudFormation (in English) and AWS: Elastic Kubernetes Service — автоматизация создания кластера, часть 2 — Ansible, eksctl (in Russian still), so there will be some Ansible in this post.
Versions used here:
- Kubernetes: (AWS EKS): v1.15.11
- Prometheus: 2.17.1
- kubectl: v1.18.0
Contents
kubectl context
First, configure access to your cluster – add a new context for your kubectl:
[simterm]
$ aws --region eu-west-2 eks update-kubeconfig --name bttrm-eks-dev-2
Added new context arn:aws:eks:eu-west-2:534***385:cluster/bttrm-eks-dev-2 to /home/admin/.kube/config
[/simterm]
Or switch to already existing if any:
[simterm]
$ kubectl config get-contexts
...
arn:aws:eks:eu-west-2:534****385:cluster/bttrm-eks-dev-1
...
$ kubectl config use-context arn:aws:eks:eu-west-2:534***385:cluster/bttrm-eks-dev-2
Switched to context "arn:aws:eks:eu-west-2:534***385:cluster/bttrm-eks-dev-2".
[/simterm]
ConfigMap Reloader
Because we will do a lot of changes to the ConfigMap of our future Prometheus – worth to add the Reloader now, so pods will apply those changes immediately without our intervention.
Create a directory:
[simterm]
$ mkdir -p roles/reloader/tasks
[/simterm]
And only one task there – the Reloader installation. Will use kubectl, and call it with the Ansible command module.
In theroles/reloader/tasks/main.yml add the following:
- name: "Install Reloader"
  command: "kubectl apply -f https://raw.githubusercontent.com/stakater/Reloader/master/deployments/kubernetes/reloader.yaml"
Enough for now – I just have no time to dig into k8s and its issues with the python-requests import.
Add this role to a playbook:
- hosts:
  - all
  become:
    true
  roles:
    - role: cloudformation
      tags: infra
    - role: eksctl
      tags: eks
    - role: reloader
      tags: reloader
Run:
[simterm]
$ ansible-playbook eks-cluster.yml --tags reloader
[/simterm]
And check:
[simterm]
$ kubectl get po
NAME                                 READY   STATUS    RESTARTS   AGE
reloader-reloader-55448df76c-9l9j7   1/1     Running   0          3m20s
[/simterm]
Start Prometheus server in Kubernetes
First, let’s start the Prometheus itself in the cluster.
Its config file will be saved as an ConfigMap object.
The cluster already crated and in future everything will be managed by Ansible, so add its directories structure here
[simterm]
$ mkdir -p roles/monitoring/{tasks,templates}
[/simterm]
A Namespace
All the resources related to the monitoring will be kept in a dedicated Kubernetes namespace.
In the roles/monitoring/templates/ directory add a config file, call it prometheus-ns.yml.j2 for example:
---
apiVersion: v1
kind: Namespace
metadata:
  name: monitoring
Add a new file roles/monitoring/tasks/main.yml to create the namespace:
- name: "Create the Monitoring Namespace"
  command: "kubectl apply -f roles/monitoring/templates/prometheus-ns.yml.j2"
Add the role to the playbook:
- hosts:
  - all
  become:
    true
  roles:
    - role: cloudformation
      tags: infra
    - role: eksctl
      tags: eks
    - role: reloader
      tags: reloader
    - role: monitoring
      tags: monitoring
Run to test:
[simterm]
$ ansible-playbook eks-cluster.yml --tags monitoring
[/simterm]
Check:
[simterm]
$ kubectl get ns
NAME              STATUS   AGE
default           Active   24m
kube-node-lease   Active   25m
kube-public       Active   25m
kube-system       Active   25m
monitoring        Active   32s
[/simterm]
The prometheus.yml ConfigMap
As already mentioned, the Prometheus config data will be kept in a ConfigMap.
Create a new file called roles/monitoring/templates/prometheus-configmap.yml.j2 – this is a minimal configuration:
---
apiVersion: v1
kind: ConfigMap
metadata:
  name: prometheus-config
  namespace: monitoring
data:
  prometheus.yml: |
    global:
      scrape_interval:     15s
      external_labels:
        monitor: 'eks-dev-monitor'
    scrape_configs:
      - job_name: 'prometheus'
        scrape_interval: 5s
        static_configs:
          - targets: ['localhost:9090']
Add it to the roles/monitoring/tasks/main.yml:
- name: "Create the Monitoring Namespace"
  command: "kubectl apply -f roles/monitoring/templates/prometheus-ns.yml.j2"

- name: "Create prometheus.yml ConfigMap"
  command: "kubectl apply -f roles/monitoring/templates/prometheus-configmap.yml.j2"
Now can check one more time – apply it up and check the ConfigMap content:
[simterm]
$ kubectl -n monitoring get configmap prometheus-config -o yaml
apiVersion: v1
data:
  prometheus.yml: |
    global:
      scrape_interval:     15s
      external_labels:
        monitor: 'eks-dev-monitor'
    scrape_configs:
      - job_name: 'prometheus'
        scrape_interval: 5s
        static_configs:
          - targets: ['localhost:9090']
kind: ConfigMap
...
[/simterm]
Prometheus Deployment and a LoadBalancer Service
Now we can start the Prometheus.
Create its deployment file – roles/monitoring/templates/prometheus-deployment.yml.j2:
---
apiVersion: apps/v1
kind: Deployment
metadata:
  name: prometheus-server
  labels:
    app: prometheus
  namespace: monitoring
  annotations:
    reloader.stakater.com/auto: "true"
#    service.beta.kubernetes.io/aws-load-balancer-internal: "true"
spec:
  replicas: 2
  selector:
    matchLabels:
      app: prometheus
  template:
    metadata:
      labels:
        app: prometheus
    spec:
      containers:
      - name: prometheus-server
        image: prom/prometheus
        volumeMounts:
          - name: prometheus-config-volume
            mountPath: /etc/prometheus/prometheus.yml
            subPath: prometheus.yml
        ports:
        - containerPort: 9090
      volumes:
        - name: prometheus-config-volume
          configMap:
            name: prometheus-config
---
kind: Service
apiVersion: v1
metadata:
  name: prometheus-server-alb
  namespace: monitoring
spec:
  selector:
    app: prometheus
  ports:
    - protocol: TCP
      port: 80
      targetPort: 9090
  type: LoadBalancer
Here:
- create two pods with Prometheus
- attach the prometheus-config
ConfigMap - create a
Servicewith theLoadBalancertype to access the Prometheus serve on the 9090 port – this will create an AWS LoadBalancer with the Classic type (not Application LB) with a Listener on the 80 port
Annotations here:
- reloader.stakater.com/auto: «true» – used for the Reloader service
- service.beta.kubernetes.io/aws-load-balancer-internal: «true» can be commented, for now, later the
Internalwill be used to configure VPC peering and Prometheus federation, at this moment let’s use Internet-facing
Add to the tasks:
...
- name: "Deploy Prometheus server and its LoadBalancer"
  command: "kubectl apply -f roles/monitoring/templates/prometheus-deployment.yml.j2"
Run:
[simterm]
$ ansible-playbook eks-cluster.yml --tags monitoring
...
TASK [monitoring : Deploy Prometheus server and its LoadBalancer] ****
changed: [localhost]
...
[/simterm]
Check pods:
[simterm]
$ kubectl -n monitoring get pod
NAME                                 READY   STATUS    RESTARTS   AGE
prometheus-server-85989544df-pgb8c   1/1     Running   0          38s
prometheus-server-85989544df-zbrsx   1/1     Running   0          38s
[/simterm]
And the LoadBalancer Service:
[simterm]
$ kubectl -n monitoring get svc
NAME                    TYPE           CLUSTER-IP       EXTERNAL-IP                                                               PORT(S)        AGE
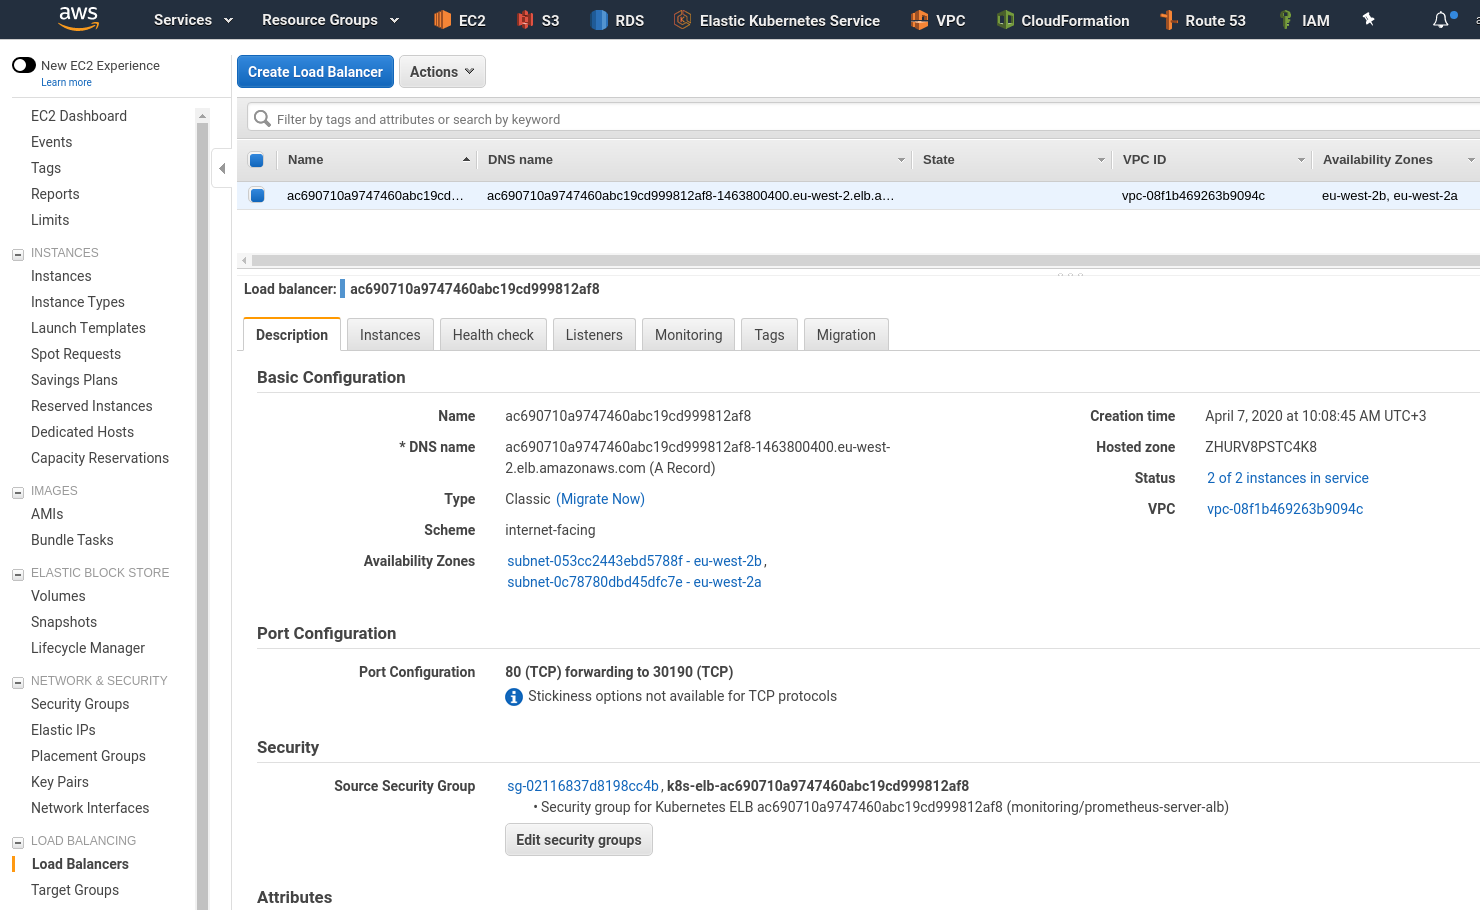
prometheus-server-alb   LoadBalancer   172.20.160.199   ac690710a9747460abc19cd999812af8-1463800400.eu-west-2.elb.amazonaws.com   80:30190/TCP   42s
[/simterm]
Or in the AWS dashboard:
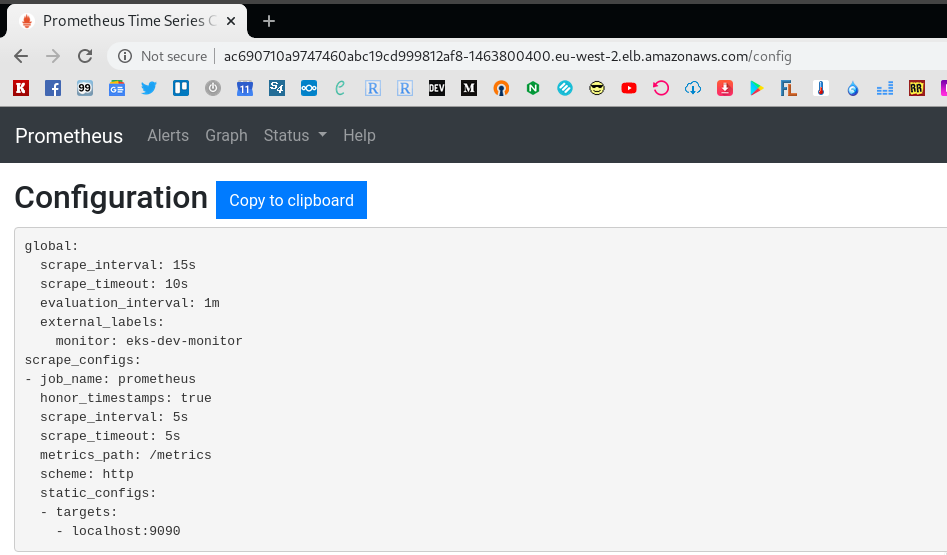
Check it – open in a browser:
if any issues with the LoadBalancer – the port-forwarding can be used here:
[simterm]
$ kubectl -n monitoring port-forward prometheus-server-85989544df-pgb8c 9090:9090
Forwarding from 127.0.0.1:9090 -> 9090
Forwarding from [::1]:9090 -> 9090
[/simterm]
In this way, Prometheus will be accessible with the localhost:9090 URL.
Monitoring configuration
Okay – we’ve started the Prometheus, now we can collect some metrics.
Let’s begin with the simplest task – spin up some service, an exporter for it, and configure Prometheus to collect its metrics.
Redis && redis_exporter
For this, we can use the Redis server and the redis_exporter.
Create a new deployment file roles/monitoring/templates/tests/redis-server-and-exporter-deployment.yml.j2:
---
apiVersion: extensions/v1beta1
kind: Deployment
metadata:
  name: redis
spec:
  replicas: 1
  template:
    metadata:
      annotations:
        prometheus.io/scrape: "true"
      labels:
        app: redis
    spec:
      containers:
      - name: redis
        image: redis
        resources:
          requests:
            cpu: 100m
            memory: 100Mi
        ports:
        - containerPort: 6379
      - name: redis-exporter
        image: oliver006/redis_exporter:latest
        resources:
          requests:
            cpu: 100m
            memory: 100Mi
        ports:
        - containerPort: 9121
---
kind: Service
apiVersion: v1
metadata:
  name: redis
spec:
  selector:
    app: redis
  ports:
  - name: redis
    protocol: TCP
    port: 6379
    targetPort: 6379
  - name: prom
    protocol: TCP
    port: 9121
    targetPort: 9121
Annotations here:
- prometheus.io/scrape – used for filters in pods and services, see the Roles part of this post UPDATE
- prometheus.io/port – non-default port can be specified here
- prometheus.io/path – and an exporter’s metrics path can be changed here from the default
/metrics
See Per-pod Prometheus Annotations.
Pay attention, that we didn’t set a namespace here – the Redis service and its exporter will be created in the default namespace, and we will see soon what will happen because of this.
Deploy it – manually, it’s a testing task, no need to add to the Ansible:
[simterm]
$ kubectl apply -f roles/monitoring/templates/tests/redis-server-and-exporter-deployment.yml.j2
deployment.extensions/redis created
service/redis created
[/simterm]
Check it – it has to have two containers running.
In the default namespace find a pod:
[simterm]
$ kubectl get pod
NAME                                 READY   STATUS    RESTARTS   AGE
redis-698cd557d5-xmncv               2/2     Running   0          10s
reloader-reloader-55448df76c-9l9j7   1/1     Running   0          23m
[/simterm]
And containers inside:
[simterm]
$ kubectl get pod redis-698cd557d5-xmncv -o jsonpath='{.spec.containers[*].name}'
redis redis-exporter
[/simterm]
Okay.
Now, add metrics collection from this exporter – update the prometheus-configmap.yml.j2 ConfigMap – add a new target, redis:
---
apiVersion: v1
kind: ConfigMap
metadata:
  name: prometheus-config
  namespace: monitoring
data:
  prometheus.yml: |

    global:
      scrape_interval:     15s
      external_labels:
        monitor: 'eks-dev-monitor'

    scrape_configs:

      - job_name: 'prometheus'
        scrape_interval: 5s
        static_configs:
          - targets: ['localhost:9090']

      - job_name: 'redis'
        static_configs:
          - targets: ['redis:9121']
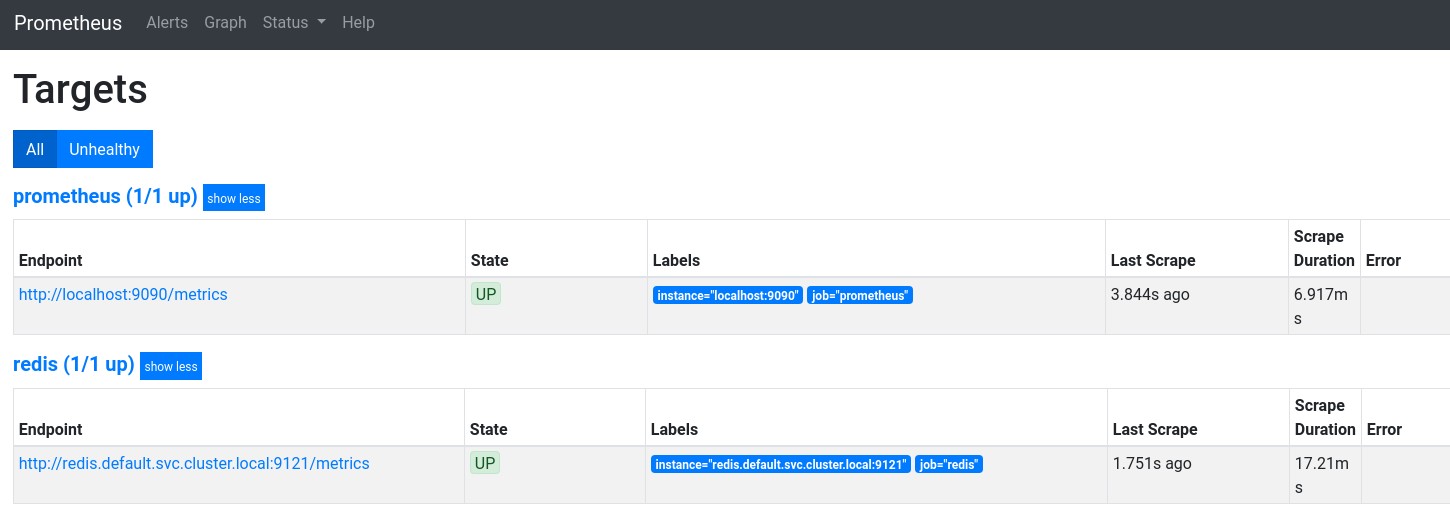
Deploy it, and check the Targets of the Prometheus:
Nice – a new Target appeared here.
But why it’s failed with the «Get http://redis:9121/metrics: dial tcp: lookup redis on 172.20.0.10:53: no such host» error?
Prometheus ClusterRole, ServiceAccount, and ClusterRoleBinding
So, as we remember we started our Prometheus in the monitoring namespace:
[simterm]
$ kubectl get ns monitoring
NAME         STATUS   AGE
monitoring   Active   25m
[/simterm]
While in the Redis deployment we didn’t set a namespace and, accordingly, its pod was created in the default namespace:
[simterm]
$ kubectl -n default get pod
NAME                                 READY   STATUS    RESTARTS   AGE
redis-698cd557d5-xmncv               2/2     Running   0          12m
[/simterm]
Or this way:
[simterm]
$ kubectl get pod redis-698cd557d5-xmncv -o jsonpath='{.metadata.namespace}'
default
[/simterm]
To make Prometheus available to get access to all namespace on the cluster – add a ClusterRole, ServiceAccount and ClusterRoleBinding, see the Kubernetes: part 5 — RBAC authorization with a Role and RoleBinding example post for more details.
Also, this ServiceAccount will be used for Prometheus Kubernetes Service Discovery.
Add a roles/monitoring/templates/prometheus-rbac.yml.j2 file:
---
apiVersion: rbac.authorization.k8s.io/v1beta1
kind: ClusterRole
metadata:
  name: prometheus
rules:
- apiGroups: [""]
  resources:
  - services
  - endpoints
  - pods
  - nodes
  - nodes/proxy
  - nodes/metrics
  verbs: ["get", "list", "watch"]
- apiGroups:
  - extensions
  resources:
  - ingresses
  verbs: ["get", "list", "watch"]
---
apiVersion: v1
kind: ServiceAccount
metadata:
  name: prometheus
  namespace: monitoring
---
apiVersion: rbac.authorization.k8s.io/v1beta1
kind: ClusterRoleBinding
metadata:
  name: prometheus
roleRef:
  apiGroup: rbac.authorization.k8s.io
  kind: ClusterRole
  name: prometheus
subjects:
- kind: ServiceAccount
  name: prometheus
  namespace: monitoring
Add its execution after creating the ConfigMap and before deployment of the Prometheus server:
- name: "Create the Monitoring Namespace"
  command: "kubectl apply -f roles/monitoring/templates/prometheus-ns.yml.j2"

- name: "Create prometheus.yml ConfigMap"
  command: "kubectl apply -f roles/monitoring/templates/prometheus-configmap.yml.j2"

- name: "Create Prometheus ClusterRole"
  command: "kubectl apply -f roles/monitoring/templates/prometheus-rbac.yml.j2"

- name: "Deploy Prometheus server and its LoadBalancer"
  command: "kubectl apply -f roles/monitoring/templates/prometheus-deployment.yml.j2"
Update the prometheus-deployment.yml – in its spec add the serviceAccountName:
...
  template:
    metadata:
      labels:
        app: prometheus
    spec:
      serviceAccountName: prometheus
      containers:
      - name: prometheus-server
        image: prom/prometheus
...
Besides this, to call for pods in another namespace we need to use an FQDN with the namespace specified, in this case, the address to access the Redis exporter will redis.default.svc.cluster.local, see the DNS for Services and Pods.
Update the ConfigMap – change the Redis address:
...
    scrape_configs:

      - job_name: 'prometheus'
        scrape_interval: 5s
        static_configs:
          - targets: ['localhost:9090']

      - job_name: 'redis'
        static_configs:
          - targets: ['redis.default.svc.cluster.local:9121']
Deploy with Ansible to update everything:
[simterm]
$ ansible-playbook eks-cluster.yml --tags monitoring
[/simterm]
Check the Targets now:
Prometheus Kubernetes Service Discovery
static_configs in Prometheus is a good thing, but what if you’ll have to collect metrics from hundreds of such services?
The solution is to use the kubernetes_sd_config feature.
kubernetes_sd_config roles
Kubernetes SD in Prometheus has a collection of so-called “roles”, which defines how to collect and display metrics.
Each such a Role has its own set of labels, see the documentation:
- node: will get by one target on each cluster’s WorkerNode кластера, will collect the kubelet’s metrics
- service: will find and return each Service and its Port
- pod: all pods and will return its containers as targets to grab metrics from
- endpoints: will create targets from each an Endpoint for each Service found in a cluster
- ingress: will create targets for each Path for each Ingress
The difference is only in the labels returned, and what address will be used for each such a target.
Configs examples (more at the end of this post):
Also, to connect to the cluster’s API server with SSL/TLS encryption need to specify a Central Authority certificate of the server to validate it, see the Accessing the API from a Pod.
And for the authorization on the API server, we will use a token from the bearer_token_file, which is mounted from the serviceAccountName: prometheus, which we’ve set in the deployment above.
node role
Let’s see what we will have in each such a role.
Begin with the node role – add to the scrape_configs, can copy-paste from the example:
...
      - job_name: 'kubernetes-nodes'
        scheme: https
        tls_config:
          ca_file: /var/run/secrets/kubernetes.io/serviceaccount/ca.crt
        bearer_token_file: /var/run/secrets/kubernetes.io/serviceaccount/token

        kubernetes_sd_configs:
        - role: node
Without relabeling for now – just run and check for targets
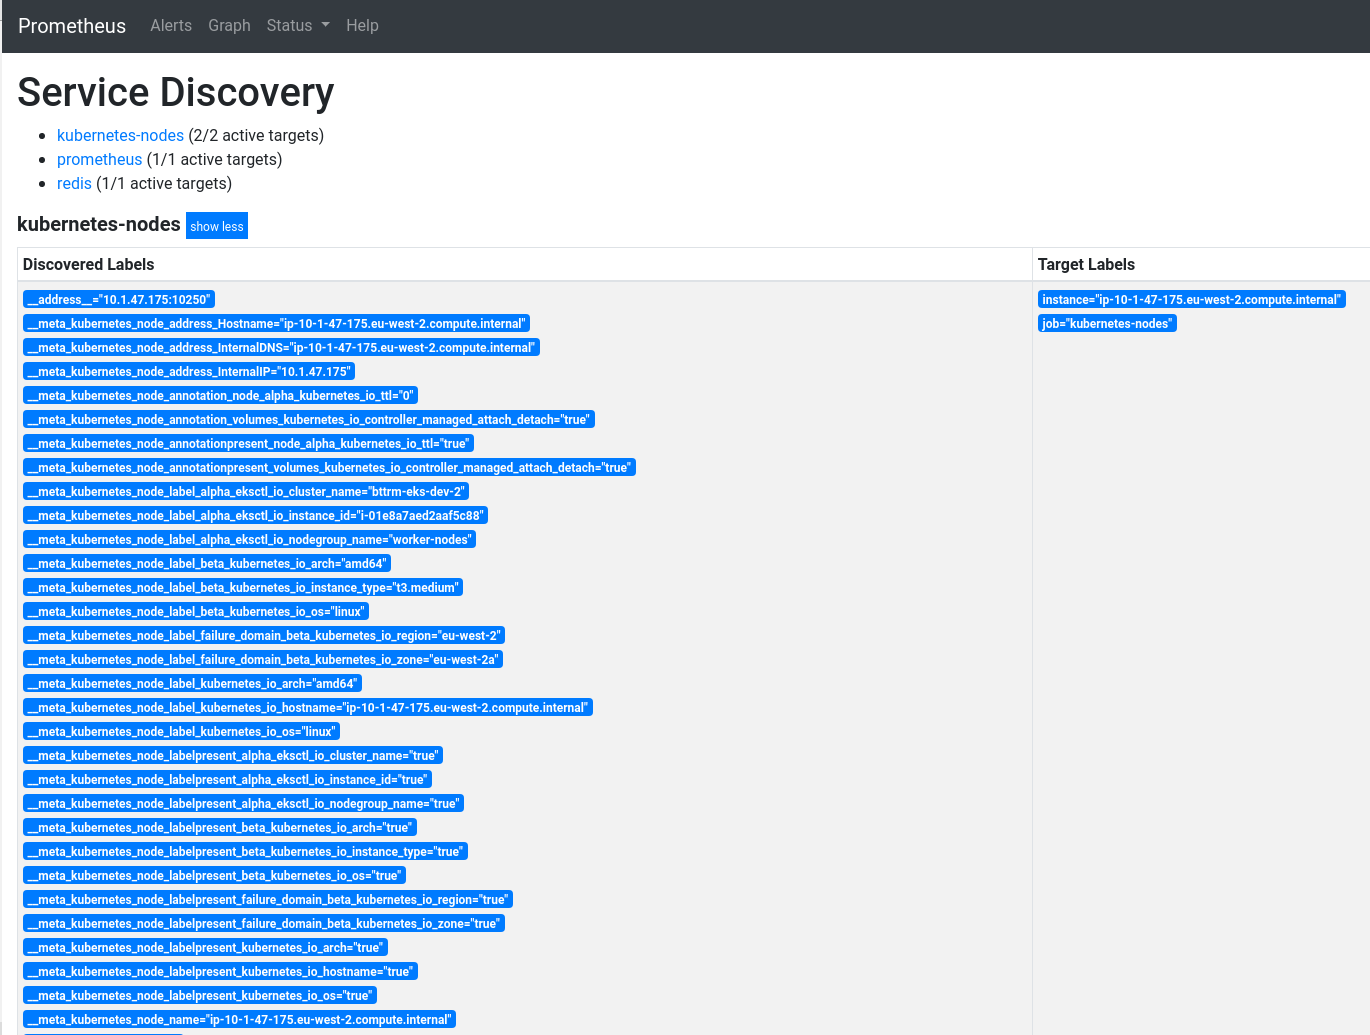
Check the Status > Service Discovery for targets and labels discovered
And kubelet_* metrics:
Add some relabeling see the relabel_config and Life of a Label.
What do they suggest there?
...
        relabel_configs:
        - action: labelmap
          regex: __meta_kubernetes_node_label_(.+)
        - target_label: __address__
          replacement: kubernetes.default.svc:443
        - source_labels: [__meta_kubernetes_node_name]
          regex: (.+)
          target_label: __metrics_path__
          replacement: /api/v1/nodes/${1}/proxy/metrics
...
- collect labels
__meta_kubernetes_node_label_alpha_eksctl_io_cluster_name,__meta_kubernetes_node_label_alpha_eksctl_io_nodegroup_nameetc, select with(.+)– will get labels likealpha_eksctl_io_cluster_name,alpha_eksctl_io_nodegroup_name, etc - update the
__address__label – set the kubernetes.default.svc:443 value to create an address to call targets - get a value from the
__meta_kubernetes_node_nameand update the__metrics_path__label – set the /api/v1/nodes/__meta_kubernetes_node_name/proxy/metrics
As result, Prometheus will construct a request to the kubernetes.default.svc:443/api/v1/nodes/ip-10-1-57-13.eu-west-2.compute.internal/proxy/metrics – and will grab metrics from this WorkerNode.
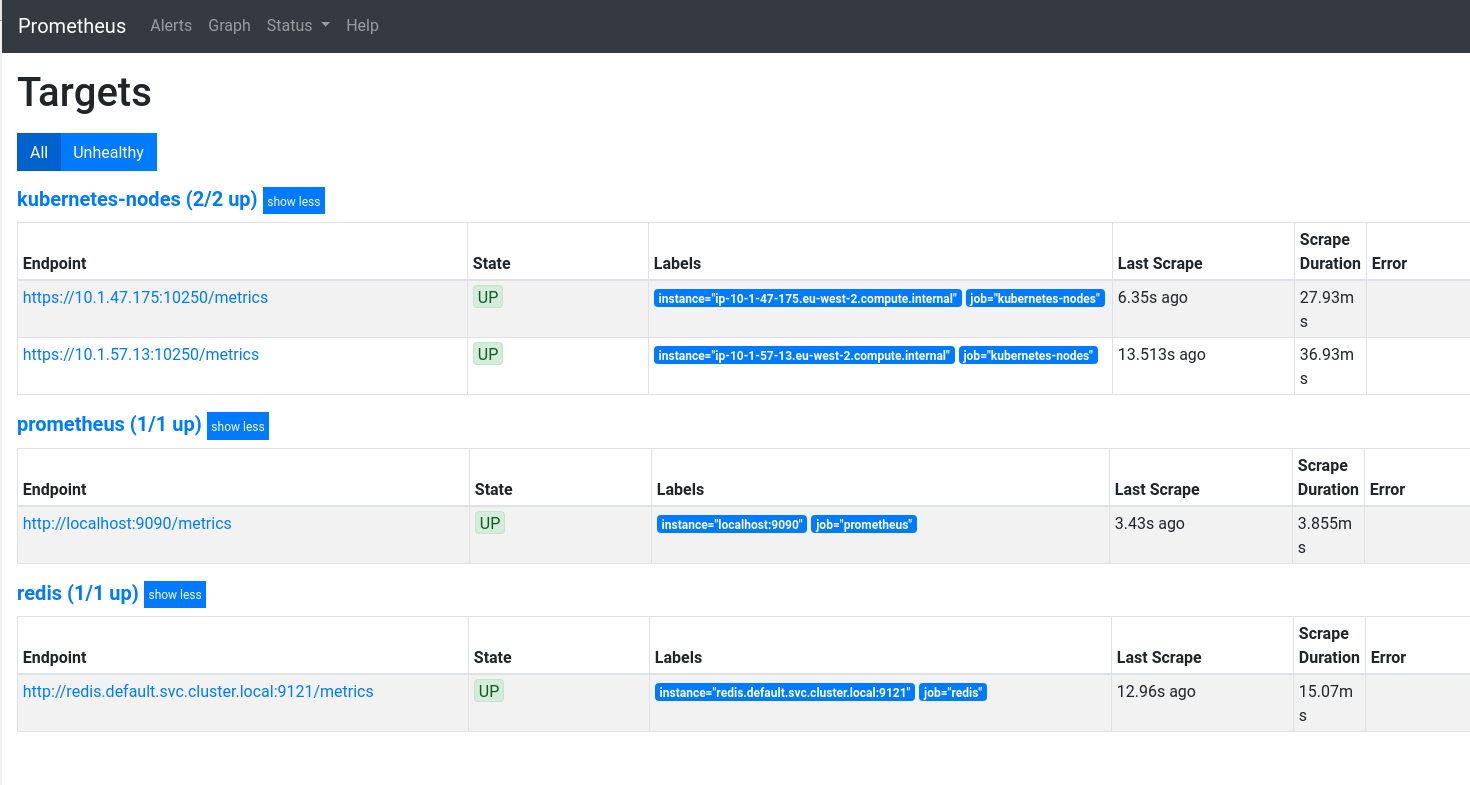
Update, check:
Nice!
pod role
Now, let’s see the pod role example from the same resources:
...
      - job_name: 'kubernetes-pods'
        kubernetes_sd_configs:
        - role: pod

        relabel_configs:
        - action: labelmap
          regex: __meta_kubernetes_pod_label_(.+)
        - source_labels: [__meta_kubernetes_namespace]
          action: replace
          target_label: kubernetes_namespace
        - source_labels: [__meta_kubernetes_pod_name]
          action: replace
          target_label: kubernetes_pod_name
Check:
All nodes were found, but why so much?
Let’s add the prometheus.io/scrape: “true” annotation check:
...
        relabel_configs:
        - source_labels: [__meta_kubernetes_pod_annotation_prometheus_io_scrape]
          action: keep
          regex: true
...
Which is already added to our Redis, for example:
...
  template:
    metadata:
      annotations:
        prometheus.io/scrape: "true"

...
And the result:
http://10.1.44.135:6379/metrics – is the Redis server without metrics.
Do you want to remove it? Add one more filter:
...
        - source_labels: [__meta_kubernetes_pod_container_name]
          action: keep
          regex: .*-exporter
...
I.e. we’ll collect only metrics with the “-exporter” string in the __meta_kubernetes_pod_container_name label.
Check:
Okay – we’ve seen how the Roles in Prometheus Kubernetes Service Discovery is working.
What we have left here?
- node-exporter
- kube-state-metrics
- cAdvisor
- metrics-server
node-exporter metrics
Add the node_exporter to collect metrics from EC2 instances.
Because a pod with exporter needs to be placed on each WorkerNode – use the DaemonSet type here.
Create a roles/monitoring/templates/prometheus-node-exporter.yml.j2 file – this will spin up a pod on each WorkerNode in the monitoring namespace, and will add a Service make Prometheus available to grab metrics from endpoints:
---
apiVersion: extensions/v1beta1
kind: DaemonSet
metadata:
  name: node-exporter
  labels:
    name: node-exporter
  namespace: monitoring
spec:
  template:
    metadata:
      labels:
        name: node-exporter
        app: node-exporter
      annotations:
         prometheus.io/scrape: "true"
    spec:
      hostPID: true
      hostIPC: true
      hostNetwork: true
      containers:
        - ports:
            - containerPort: 9100
              protocol: TCP
          resources:
            requests:
              cpu: 0.15
          securityContext:
            privileged: true
          image: prom/node-exporter
          args:
            - --path.procfs
            - /host/proc
            - --path.sysfs
            - /host/sys
            - --collector.filesystem.ignored-mount-points
            - '"^/(sys|proc|dev|host|etc)($|/)"'
          name: node-exporter
          volumeMounts:
            - name: dev
              mountPath: /host/dev
            - name: proc
              mountPath: /host/proc
            - name: sys
              mountPath: /host/sys
            - name: rootfs
              mountPath: /rootfs
      volumes:
        - name: proc
          hostPath:
            path: /proc
        - name: dev
          hostPath:
            path: /dev
        - name: sys
          hostPath:
            path: /sys
        - name: rootfs
          hostPath:
            path: /

---
kind: Service
apiVersion: v1
metadata:
  name: node-exporter
  namespace: monitoring
spec:
  selector:
    app: node-exporter
  ports:
  - name: node-exporter
    protocol: TCP
    port: 9100
    targetPort: 9100
Add its execution to the roles/monitoring/tasks/main.yml file:
...
- name: "Deploy node-exporter to WorkerNodes"
  command: "kubectl apply -f roles/monitoring/templates/prometheus-node-exporter.yml.j2"
And let’s think about how we can collect metrics now.
The first question is – which Role to use here? We need to specify the 9100 port – then we can’t use the node role – it has no Port value:
[simterm]
$ kubectl -n monitoring get node
NAME                                        STATUS   ROLES    AGE     VERSION
ip-10-1-47-175.eu-west-2.compute.internal   Ready    <none>   3h36m   v1.15.10-eks-bac369
ip-10-1-57-13.eu-west-2.compute.internal    Ready    <none>   3h37m   v1.15.10-eks-bac369
[/simterm]
What about the Service role?
The address will be set to the Kubernetes DNS name of the service and respective service port
Let’s see:
[simterm]
$ kubectl -n monitoring get svc
NAME                    TYPE           CLUSTER-IP       EXTERNAL-IP  PORT(S)        AGE
node-exporter           ClusterIP      172.20.242.99    <none>       9100/TCP       37m
[/simterm]
Okay, what about labels for the service role? All good, but it has no labels for pods on the Worker Nodes – and we need to collect metrics from each node_exporter pod on each WorkerNode.
Let’s go further – the endpoints role:
[simterm]
$ kubectl -n monitoring get endpoints
NAME                    ENDPOINTS                          AGE
node-exporter           10.1.47.175:9100,10.1.57.13:9100   44m
prometheus-server-alb   10.1.45.231:9090,10.1.53.46:9090   3h24m
[/simterm]
10.1.47.175:9100,10.1.57.13:9100 – aha, here they are!
So – we can use the endpoints role which also has the __meta_kubernetes_endpoint_node_name label.
Try it:
...
      - job_name: 'node-exporter'
        kubernetes_sd_configs:
          - role: endpoints
        relabel_configs:
        - source_labels: [__meta_kubernetes_endpoints_name]
          regex: 'node-exporter'
          action: keep
Check targets:
And metrics:
 See requests examples for
 node_exporter in the Grafana: создание dashboard post (in Russian).
kube-state-metrics
To collect metrics about Kubernetes resources we can use the kube-state-metrics.
Add its installation to the roles/monitoring/tasks/main.yml:
...
- git:
    repo: 'https://github.com/kubernetes/kube-state-metrics.git'
    dest: /tmp/kube-state-metrics

- name: "Install kube-state-metrics"
  command: "kubectl apply -f /tmp/kube-state-metrics/examples/standard/"
The deployment itself can be observed in the https://github.com/kubernetes/kube-state-metrics/blob/master/examples/standard/deployment.yaml file.
We can skip Service Discovery here as we will have the only kube-state-metrics service, so use the static_configs:
...
      - job_name: 'kube-state-metrics'
        static_configs:
          - targets: ['kube-state-metrics.kube-system.svc.cluster.local:8080']
Check targets:
And metrics, for example – kube_deployment_status_replicas_available:
cAdvisor
The cAdvisor is too well-known – the most widely used system to collect data about containers.
it’s already unbounded to the Kubernetes, so no need for a dedicated reporter – just grab tits metrics. An example can be found in the same https://github.com/prometheus/prometheus/blob/master/documentation/examples/prometheus-kubernetes.yml#L102 file.
Update the roles/monitoring/templates/prometheus-configmap.yml.j2:
...
      - job_name: 'cAdvisor'
        scheme: https
        tls_config:
          ca_file: /var/run/secrets/kubernetes.io/serviceaccount/ca.crt
        bearer_token_file: /var/run/secrets/kubernetes.io/serviceaccount/token
        kubernetes_sd_configs:
        - role: node

        relabel_configs:
        - action: labelmap
          regex: __meta_kubernetes_node_label_(.+)
        - target_label: __address__
          replacement: kubernetes.default.svc:443
        - source_labels: [__meta_kubernetes_node_name]
          regex: (.+)
          target_label: __metrics_path__
          replacement: /api/v1/nodes/${1}/proxy/metrics/cadvisor
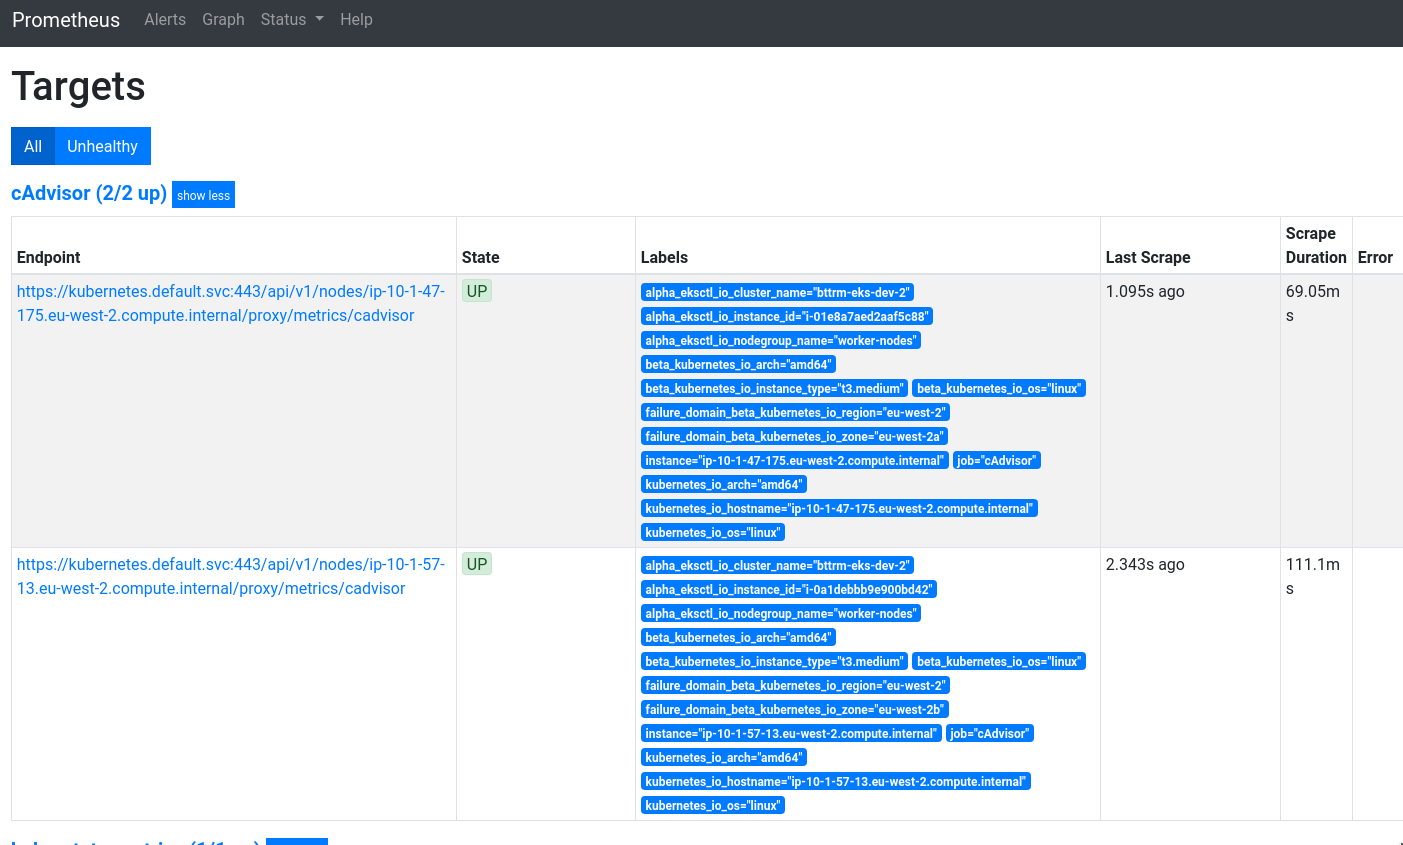
Deploy, check:
We have two Kubernetes WorkerNode in our cluster, and we can see metrics from both – great:
metrics-server
There are exporters for it too, but I don’t need them now – just install it to make Kubernetes Limits work and to use the kubectl top.
Its installation was a bit more complicated earlier, see the Kubernetes: running metrics-server in AWS EKS for a Kubernetes Pod AutoScaler, but now on the EKS it works out of the box.
Update the roles/monitoring/tasks/main.yml:
...
- git:
    repo: "https://github.com/kubernetes-sigs/metrics-server.git"
    dest: "/tmp/metrics-server"

- name: "Install metrics-server"
  command: "kubectl apply -f /tmp/metrics-server/deploy/kubernetes/"
...
Deploy, check pods in the kube-system namespace:
[simterm]
$ kubectl -n kube-system get pod
NAME                                 READY   STATUS    RESTARTS   AGE
aws-node-s7pvq                       1/1     Running   0          4h42m
...
kube-proxy-v9lmh                     1/1     Running   0          4h42m
kube-state-metrics-6c4d4dd64-78bpb   1/1     Running   0          31m
metrics-server-7668599459-nt4pf      1/1     Running   0          44s
[/simterm]
The metrics-server pod is here – good.
And try the top node in a couple of minutes:
[simterm]
$ kubectl top node
NAME                                        CPU(cores)   CPU%   MEMORY(bytes)   MEMORY%
ip-10-1-47-175.eu-west-2.compute.internal   47m          2%     536Mi           14%
ip-10-1-57-13.eu-west-2.compute.internal    58m          2%     581Mi           15%
[/simterm]
And for pods:
[simterm]
$ kubectl top pod
NAME                                 CPU(cores)   MEMORY(bytes)
redis-6d9cf9d8cb-dfnn6               2m           5Mi
reloader-reloader-55448df76c-wsrfv   1m           7Mi
[/simterm]
That’s all, in general.
Useful links
- Kubernetes Monitoring with Prometheus -The ultimate guide
- Monitoring multiple federated clusters with Prometheus – the secure way
- Monitoring Your Kubernetes Infrastructure with Prometheus
- Volume Monitoring in Kubernetes with Prometheus
- Trying Prometheus Operator with Helm + Minikube
- How to monitor your Kubernetes cluster with Prometheus and Grafana
- Monitoring Redis with builtin Prometheus
- Kubernetes in Production: The Ultimate Guide to Monitoring Resource Metrics with Prometheus
- How To Monitor Kubernetes With Prometheus
- Using Prometheus + grafana + node-exporter
- Running Prometheus on Kubernetes
- Prometheus Self Discovery on Kubernetes
- Kubernetes – Endpoints
Configs
- doks-monitoring/manifest/prometheus-configmap.yaml
- prometheus/documentation/examples/prometheus-kubernetes.yml
- charts/stable/prometheus/templates/server-configmap.yaml
Misc
![]()
