The very useful thing is to monitor how efficiently the cluster is being used, especially if applications are deployed by developers who do not delve into requests much and set inflated values ”in reserve”. A reserve, of course, is needed – but simply requesting resources is a bad idea.
For example, you have a WorkerNode that has 4 vCPUs (4.000 milicpu) and 16 GB of RAM, and you create a Kubernetes Deployment in which you set requests for Pods to 2.5m and 4 GB of memory. After launching one Pod, it will request more than half of the available processor time, and to launch the second one Kubernetes will report a lack of resources on the available nodes, which will lead to the launch of another WorkerNode, which, of course, will affect the overall cost of the cluster.
To avoid this, there are several utilities such as Kubernetes Resource Report and Kubecost.
Contents
Kube Resource Report
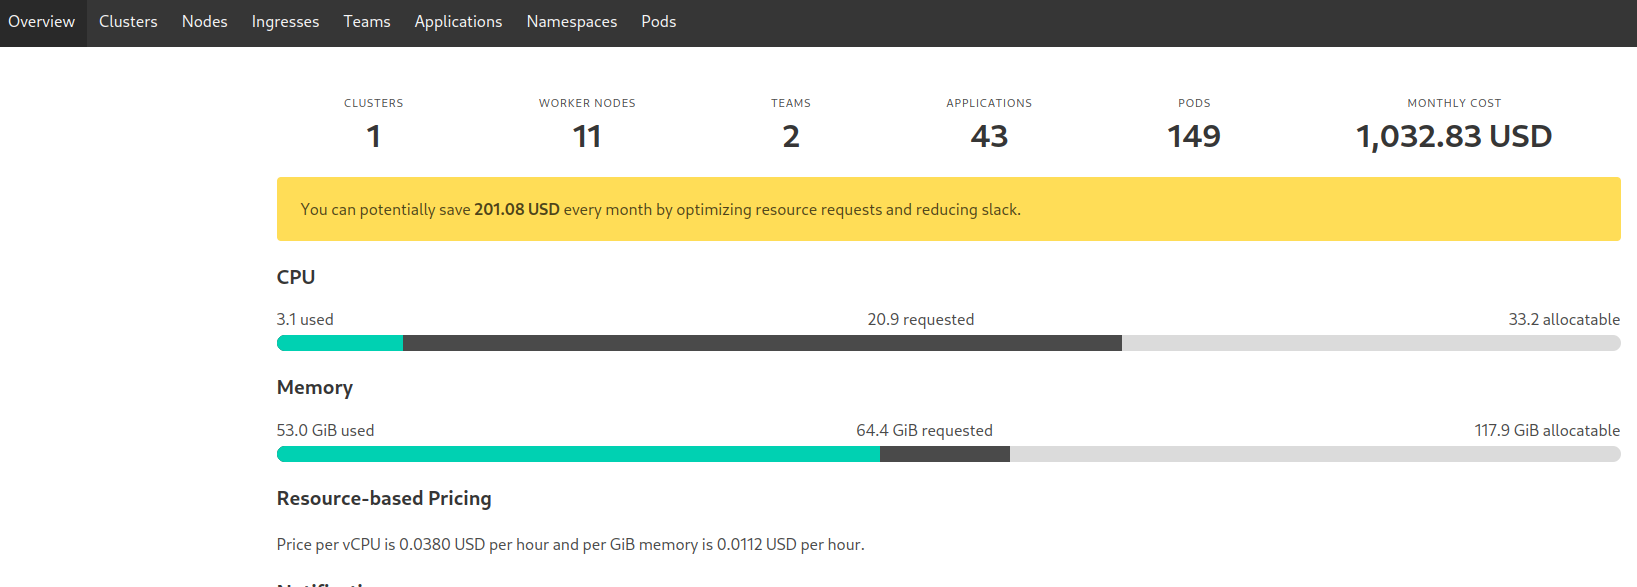
Kubernetes Resource Report is the easiest to run and by features: it simply displays resources, grouping them by type, and displays statistics – how much CPU/MEM is requested, and how much is actually used.
I like it precisely because of its simplicity – just launch it, once every couple of weeks look at what is happening in the cluster, and if necessary ping the developers with the question “Do you really need 100500 gigabytes of memory for this application?”
There is a Helm chart, but it is rarely updated, so it’s easier to install from the manifests.
Create a Namespace:
[simterm]
$ kk create ns kube-resource-report
namespace/kube-resource-report created
[/simterm]
Download the kube-resource-report repository:
[simterm]
$ git clone https://codeberg.org/hjacobs/kube-resource-report
$ cd kube-resource-report/
[/simterm]
In the deploy directory there is already a Kustomize file, let’s add the installation to it in our Namespace:
[simterm]
$ echo "namespace: kube-resource-report" >> deploy/kustomization.yaml
[/simterm]
Check it:
[simterm]
$ cat deploy/kustomization.yaml
apiVersion: kustomize.config.k8s.io/v1beta1
kind: Kustomization
resources:
  - deployment.yaml
  - rbac.yaml
  - service.yaml
  - configmap.yaml
namespace: kube-resource-report
[/simterm]
And install:
[simterm]
$ kubectl apply -k deploy/
serviceaccount/kube-resource-report created
clusterrole.rbac.authorization.k8s.io/kube-resource-report created
clusterrolebinding.rbac.authorization.k8s.io/kube-resource-report created
configmap/kube-resource-report created
service/kube-resource-report created
deployment.apps/kube-resource-report created
[/simterm]
Open access to its Service:
[simterm]
$ kubectl -n kube-resource-report port-forward svc/kube-resource-report 8080:80
[/simterm]
And open the report in the browser:
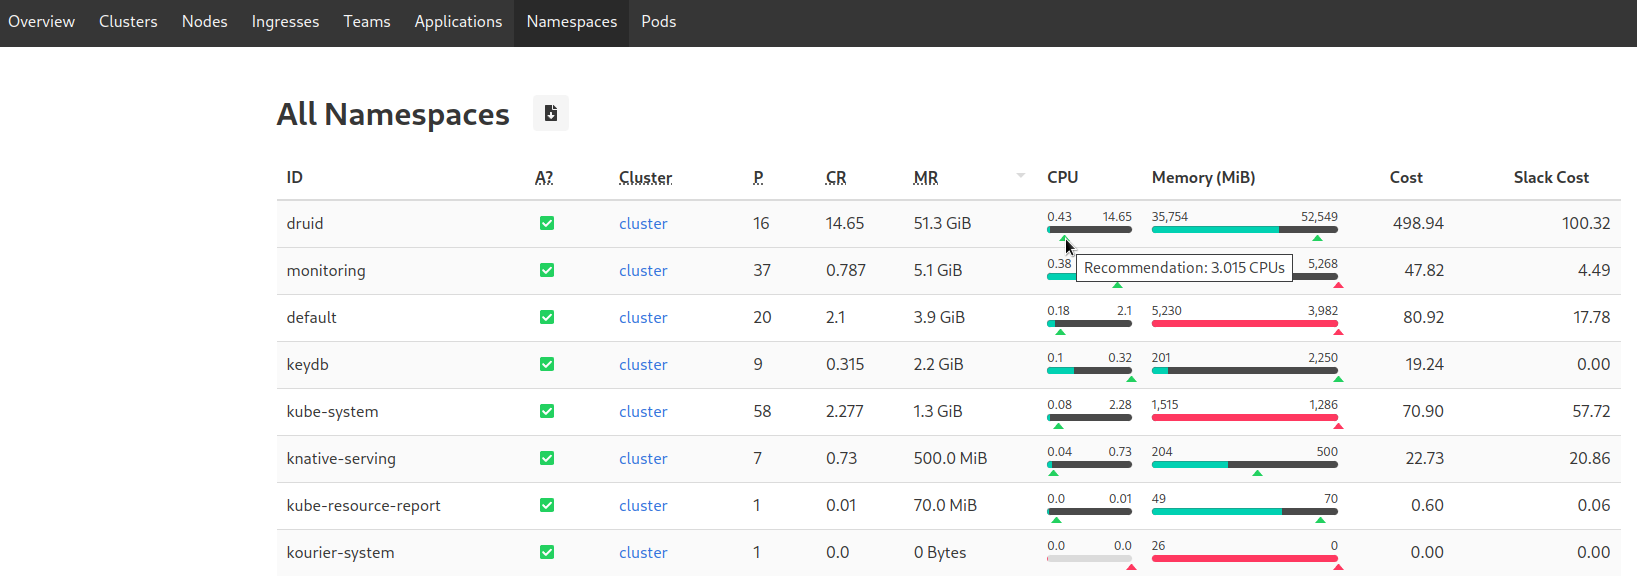
Next, for example, go to Namespaces, and sort the columns by CR (CPU Requested):
When you hover over the slider, the Kube Resource Report will suggest the optimal value from its point of view.
Then think for yourself, considering your application, whether the requested resources are really required, or can be reduced.
In this case, we have Apache Druid with 16 pods, each running a JVM that loves processor and memory, and it is desirable to allocate 1 processor core for each Java execution thread, so OK – let it be 14.65 of the requested processor.
Kubecost
Kubecost is the Kube Resource Report on steroids. It can count traffic, send alerts, generate metrics for Prometheus, has its own Grafana dashboards, can connect to multiple Kubernetes clusters, and much more.
Not without bugs, but in general, the tool is pleasant and powerful.
The cost of the Business license at $499, and is a bit overpriced, in my opinion. However, the Free version is enough for basic things.
“Under the hood” uses its own Prometheus instance to store data. You can disable and use an external one – but it’s not recommended.
Installation
The main available options are described in the Github documentation, plus you can get the default values of its Helm chart.
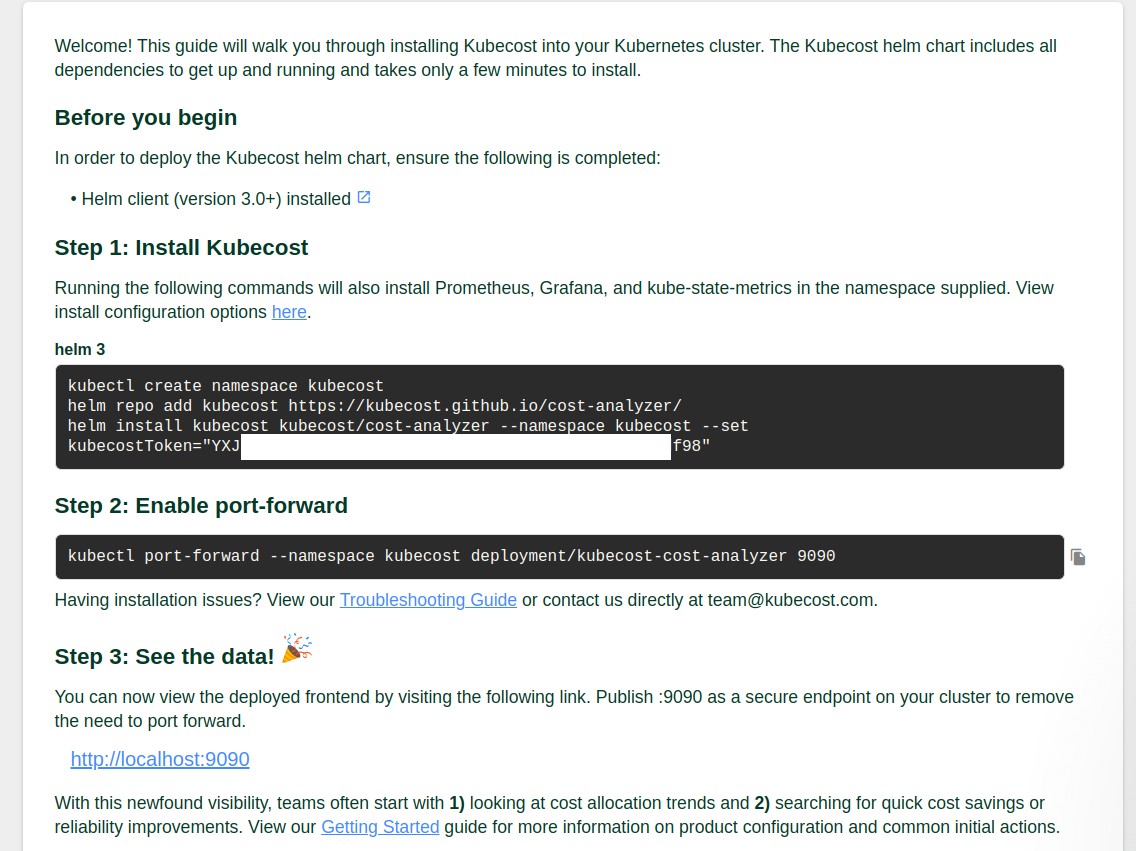
Requires registration to receive the license key – go to https://www.kubecost.com/install.html, specify your mail, and will be immediately redirected to the installation instructions with your key:
Helm chart values
First, let’s create our own values.
If you have already deployed the Kube Prometheus Stack, and have Grafana and NodeExporter, then it makes sense to disable them in Kubecost. In addition, disable kube-state-metrics, so that the data in the monitoring will not be duplicated.
In order for Prometheus to start collecting Kubecost metrics from our own stack, set the creation of a ServiceMonitor and add it labels – then it will be possible to generate our own alerts and use the Grafana dashboard .
But if you disable the launch of the built-in Grafana, kubecost-cost-analyzer will not start its Pod, don’t know if it’s a bug or a feature. But it has its own dashboards that can be useful, so you can leave it.
Also, you can turn on the networkCosts, but I still didn’t manage to see adequate traffic costs – perhaps I didn’t cook it correctly.
networkCosts can be quite gluttonous in terms of resources, so need to monitor the use of the CPU.
Actually, my initial values.yaml:
kubecostToken: "c2V***f98"

kubecostProductConfigs:
  clusterName: development-qa-data-services

prometheus:
  kube-state-metrics:
    disabled: true
  nodeExporter:
    enabled: false
  serviceAccounts:
    nodeExporter:
      create: false

serviceMonitor:
  enabled: true
  additionalLabels:
    release: prometheus

networkCosts:
  enabled: true
  podMonitor:
    enabled: true
  config:
    services:
      amazon-web-services: true
Install to the kubecost Namespace:
[simterm]
$ helm repo add kubecost https://kubecost.github.io/cost-analyzer/
$ helm upgrade --install -n kubecost --create-namespace -f values.yaml kubecost kubecost/cost-analyzer
[/simterm]
Open the port:
[simterm]
$ kubectl -n kubecost port-forward svc/kubecost-cost-analyzer 9090:9090
[/simterm]
Check the Pods:
[simterm]
$ kubectl -n kubecost get pod
NAME                                         READY   STATUS    RESTARTS   AGE
kubecost-cost-analyzer-5f5b85bf59-f22ld      2/2     Running   0          59s
kubecost-grafana-6bd995d6f9-kslh2            2/2     Running   0          63s
kubecost-network-costs-22dps                 1/1     Running   0          64s
kubecost-network-costs-m7rf5                 1/1     Running   0          64s
kubecost-network-costs-tcdvn                 1/1     Running   0          64s
kubecost-network-costs-xzvsz                 1/1     Running   0          64s
kubecost-prometheus-server-ddb597d5c-dvrgc   2/2     Running   0          6m49s
[/simterm]
And open access to the kubecost-cost-analyzer Service:
[simterm]
$ kubectl -n kubecost port-forward svc/kubecost-cost-analyzer 9090:9090
[/simterm]
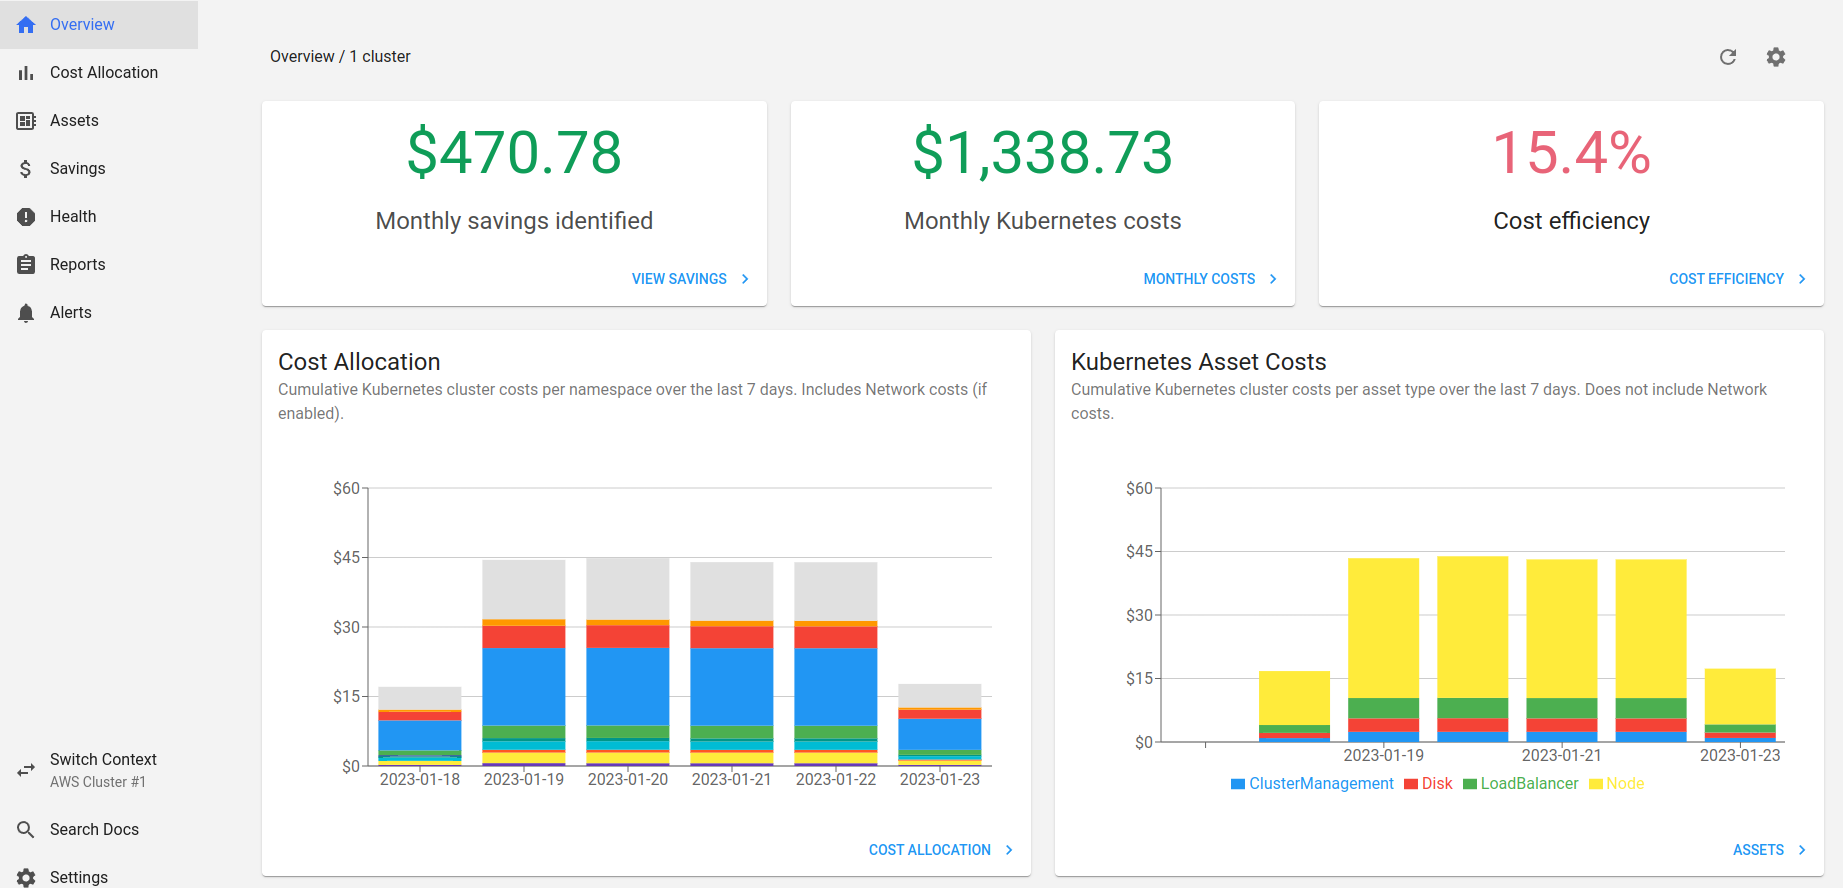
Navigate to the http://localhost:9090.
Here is a screenshot from Kubecost, which has been running on one of our clusters for almost a week:
Let’s briefly go through the main menu items.
Assets
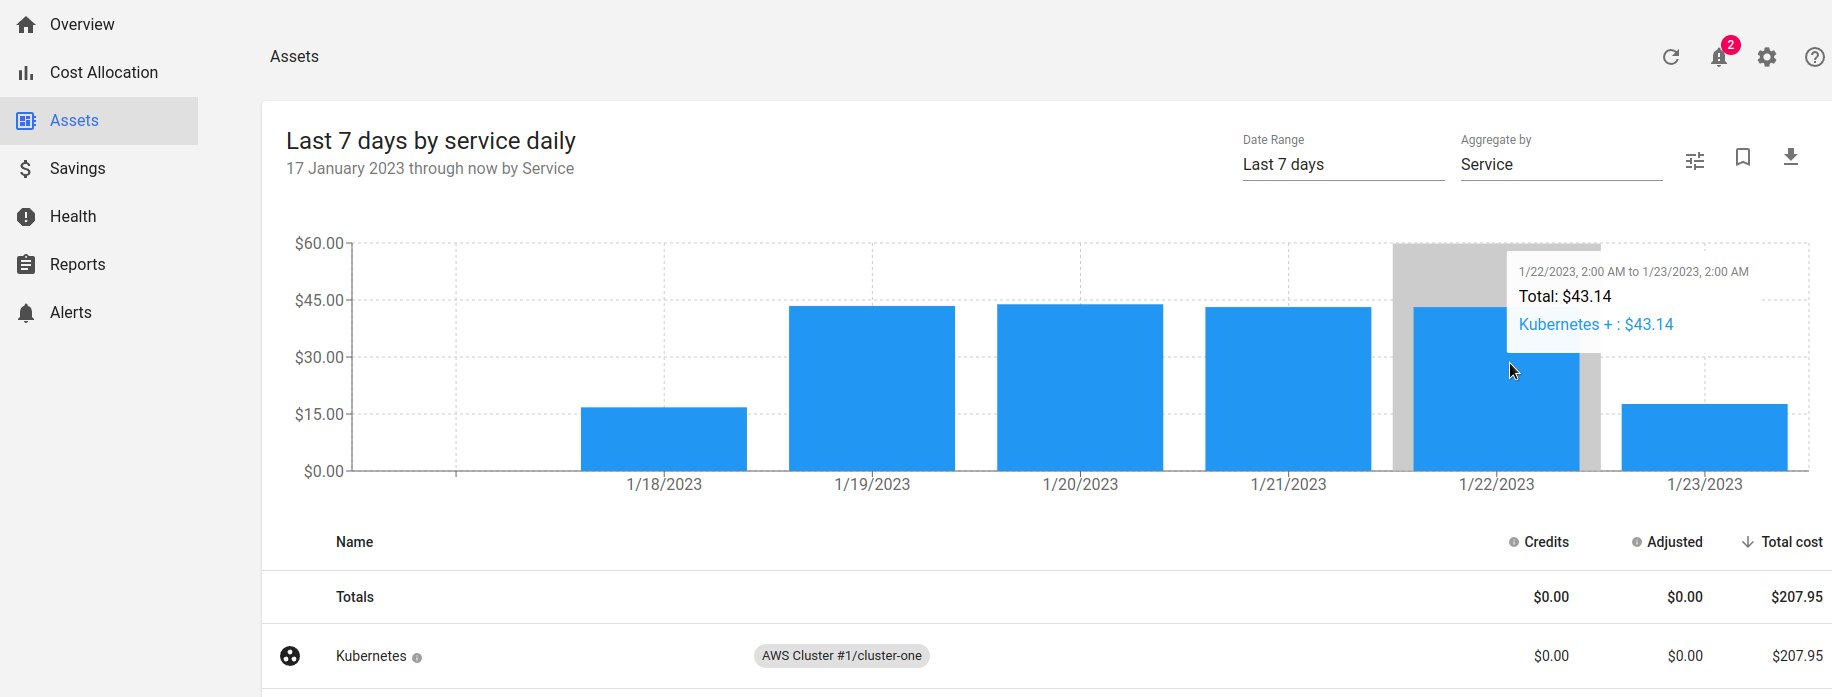
To understand the costs, it’s better to start with the Assets item, which displays the cost of the cluster’s “hardware”:
We see that our cluster costs $43 per day.
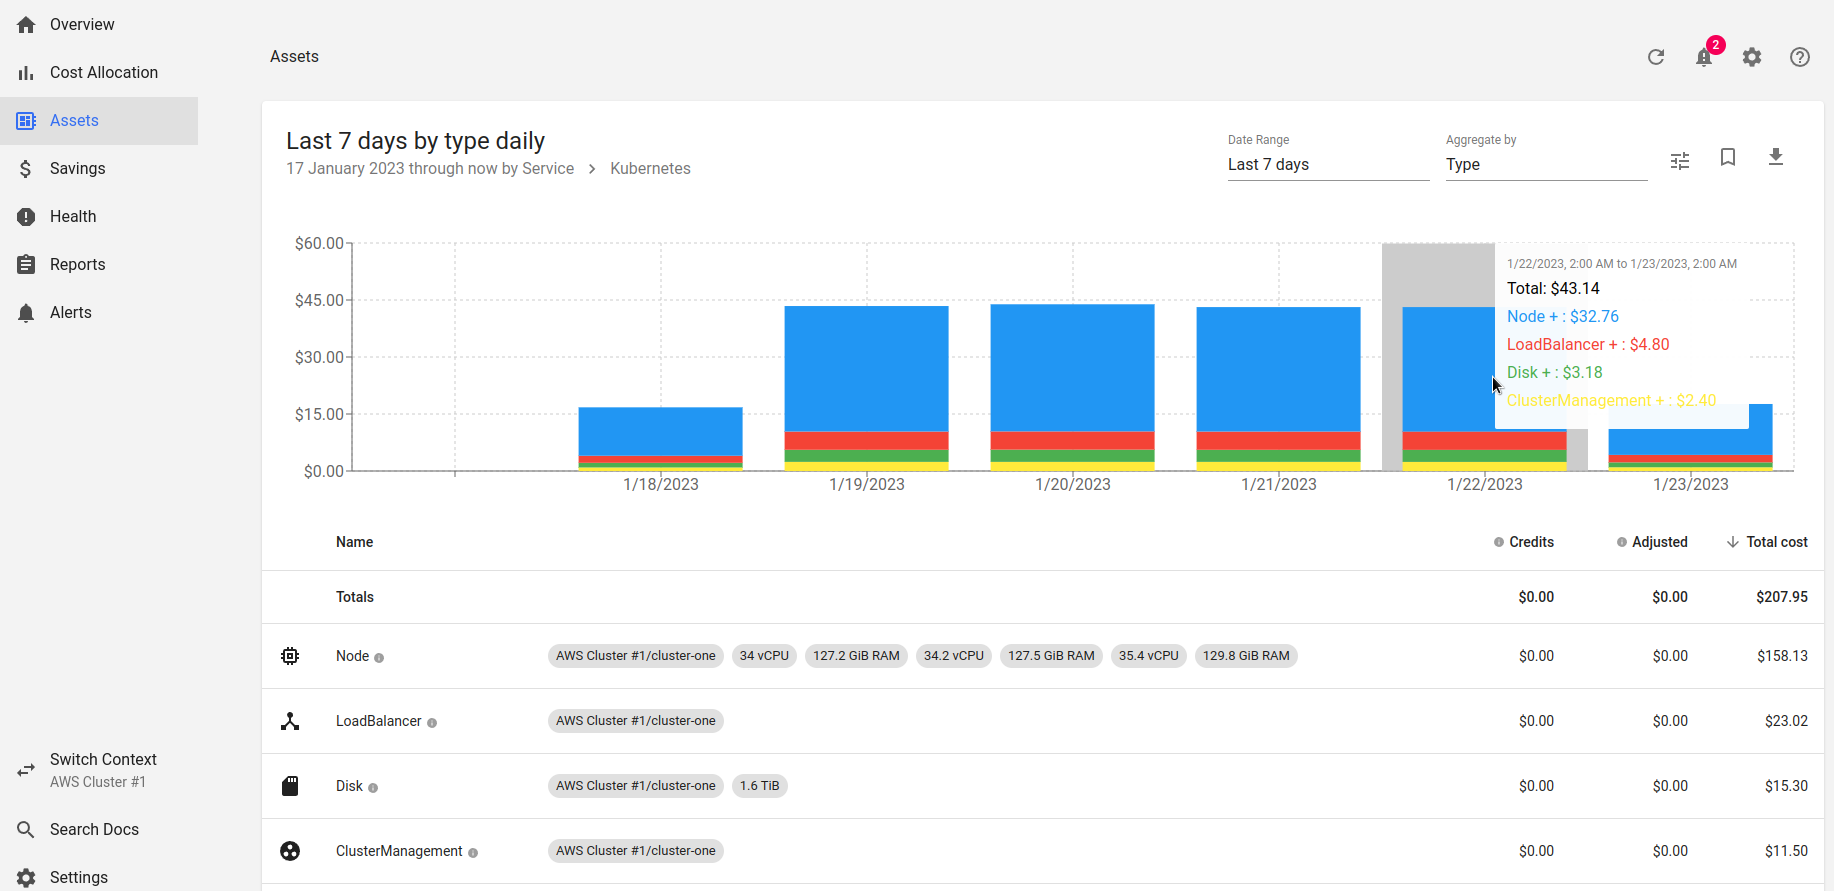
You can dive deeper into the details of the cluster, and see a breakdown by resources – WorkerNodes, load balancers, disks, and the cost of the AWS Elastic Kubernetes Service itself:
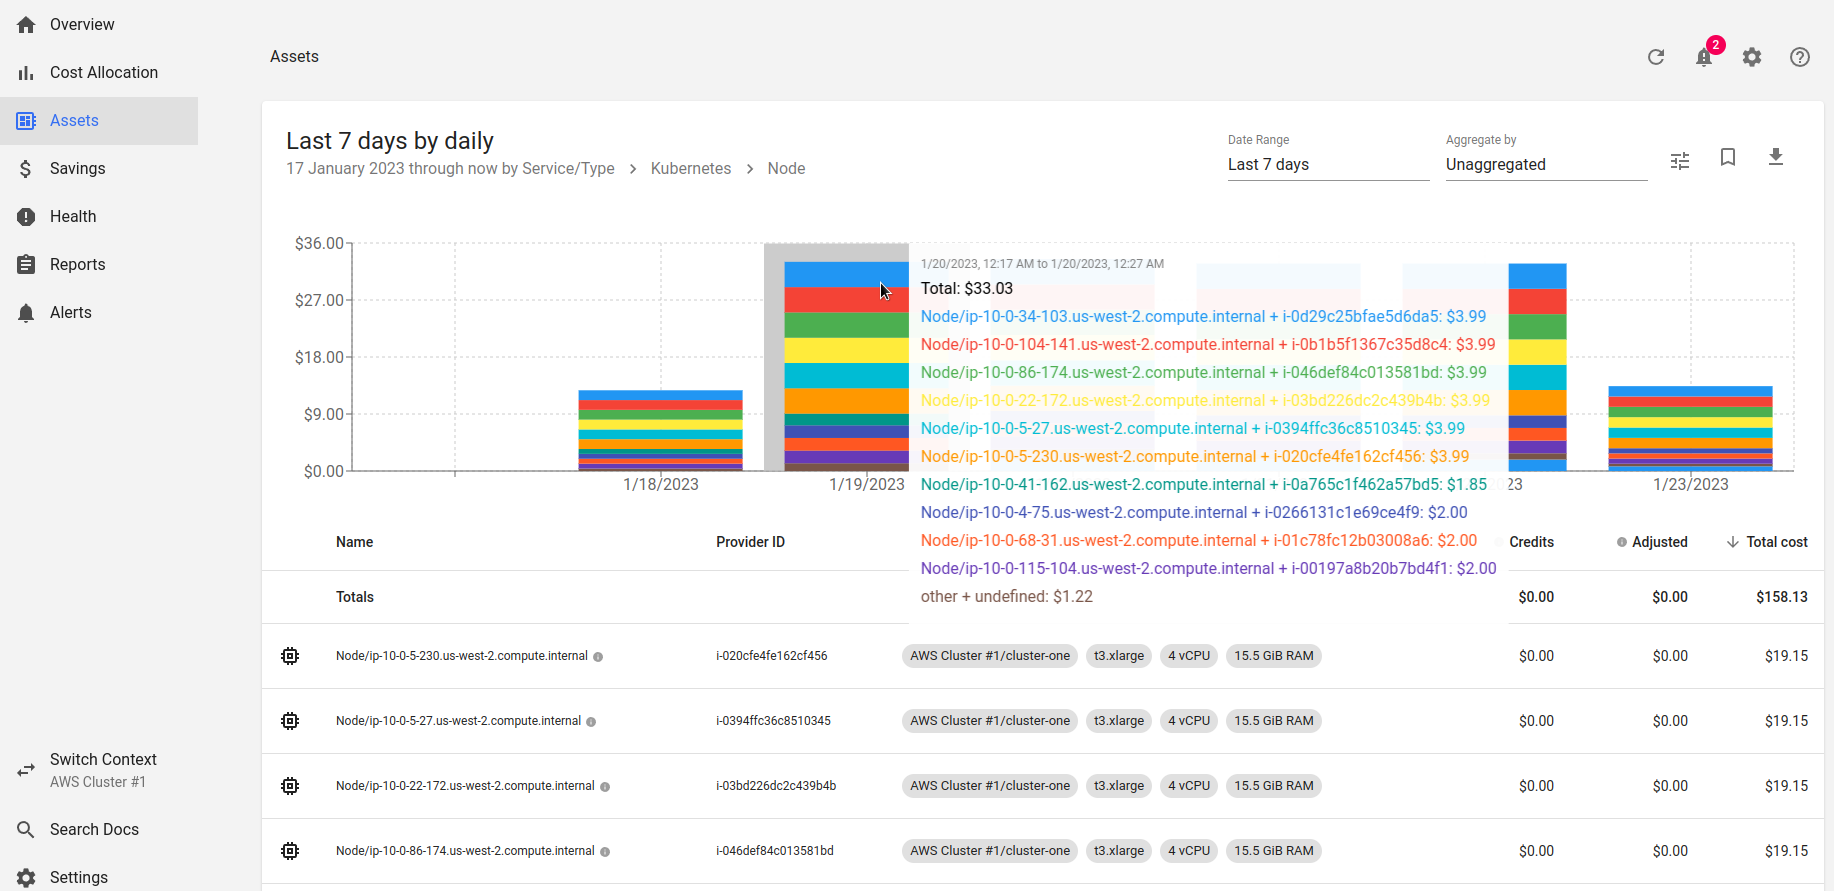
Let’s go more deeper, in Nodes:
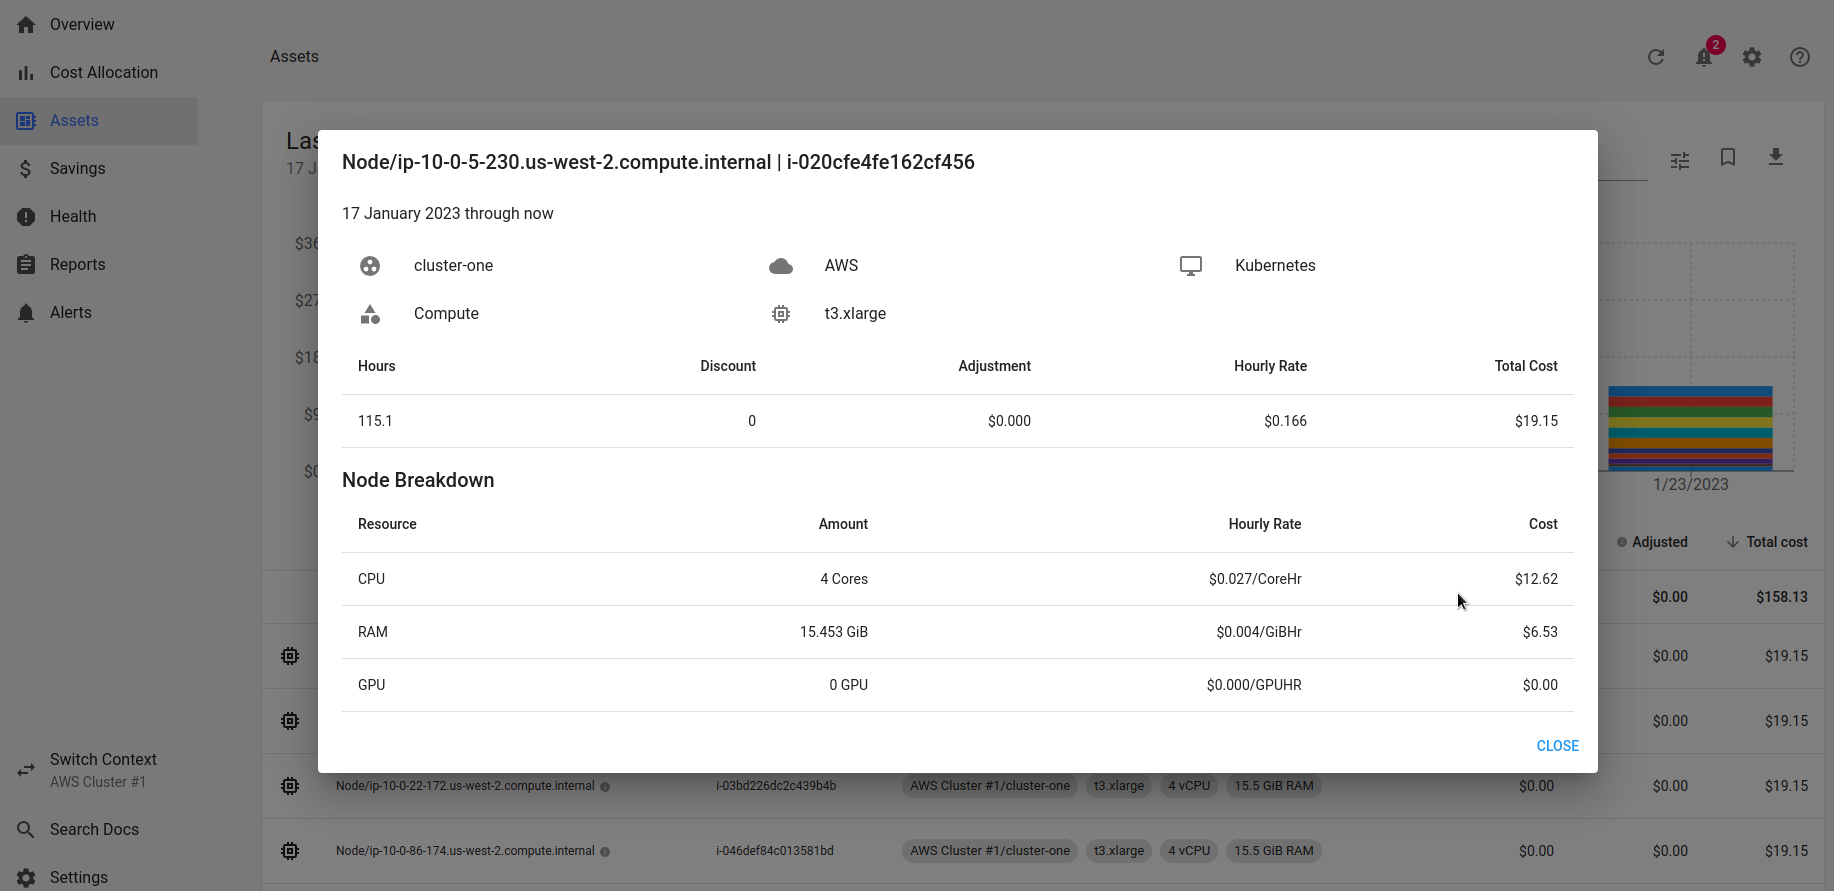
And can see the cost details for a specific node:
Let’s check:
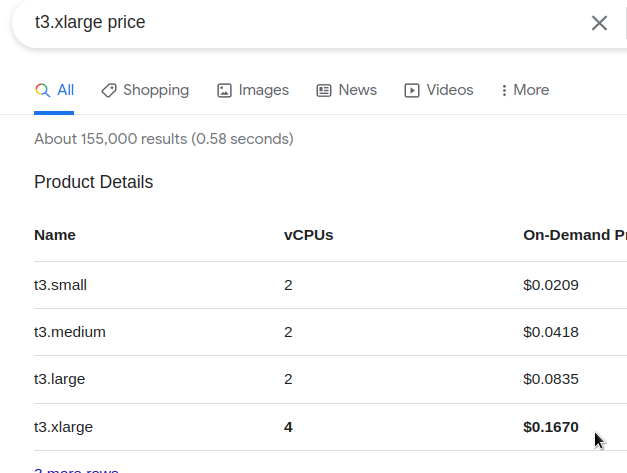
0.167 per hour, like Kubecost reported in the Hourly Rate.
To set up costs for AWS Spot Instances, see the Spot Instance data feed and AWS Spot Instances.
Cost Allocation
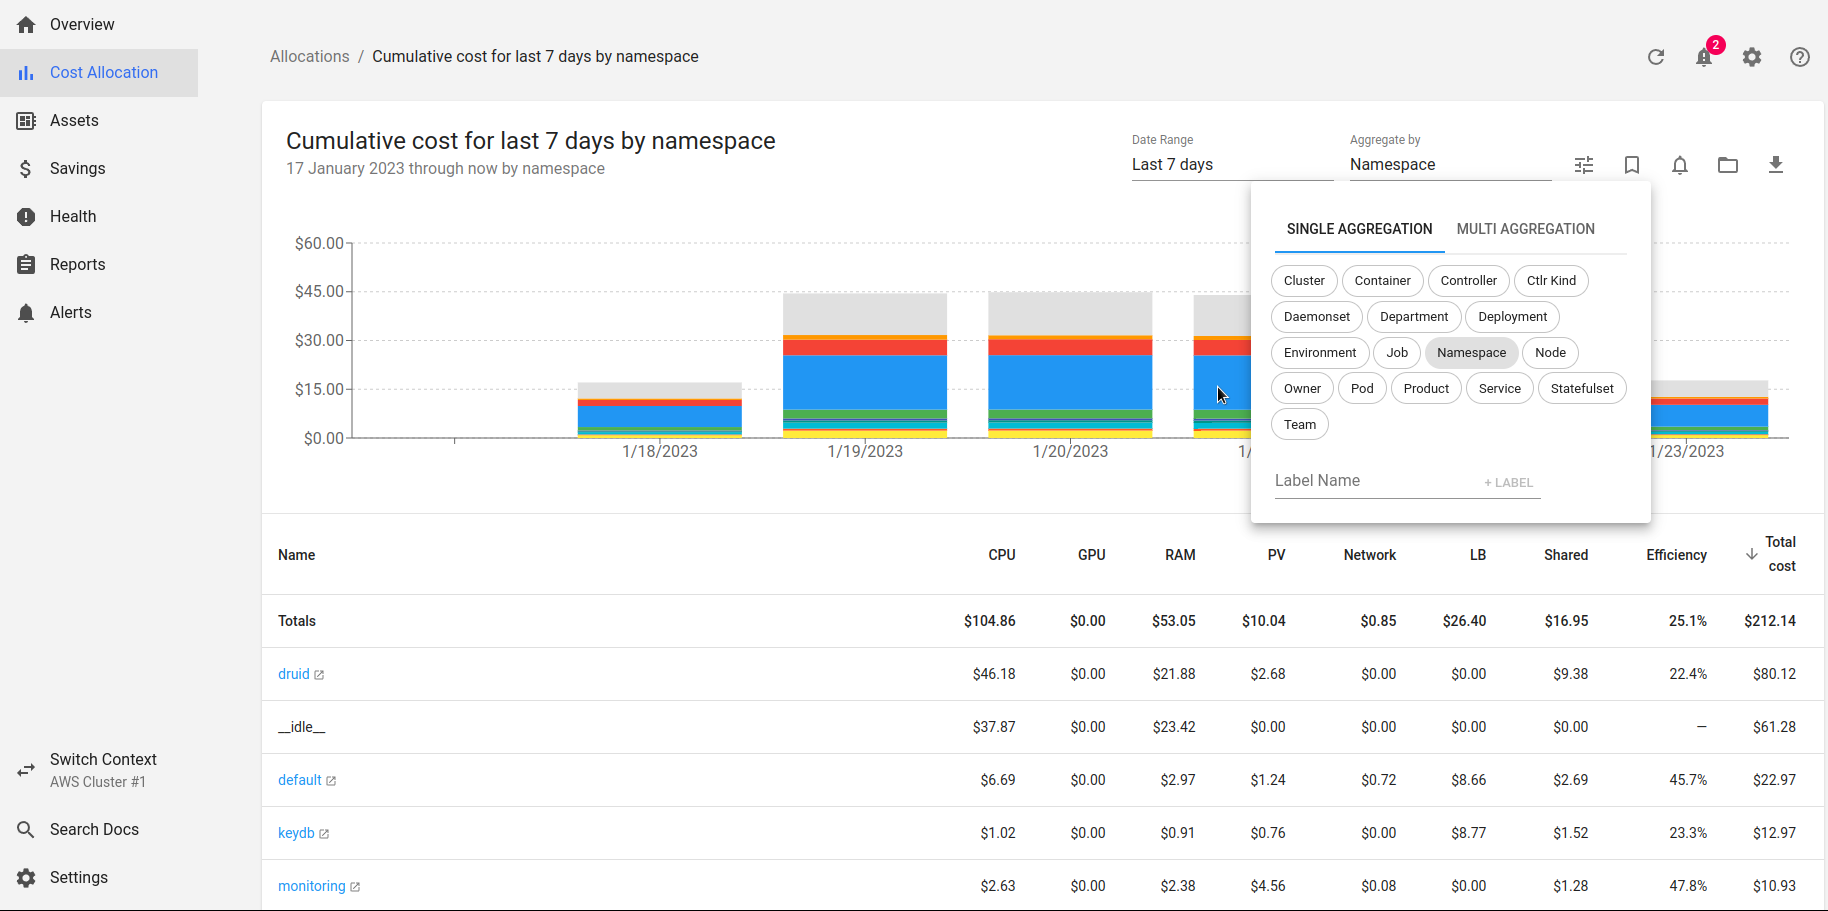
Shows where resources are spent in Kubernetes itself:
Kubecost considers the cost of CPU and RAM per WorkerNodes and displays the cost of each namespace accordingly depending on its requests and usage.
Here is our Apache Druid has the CPU requests for as much as $48 per week or $4.08 per day.
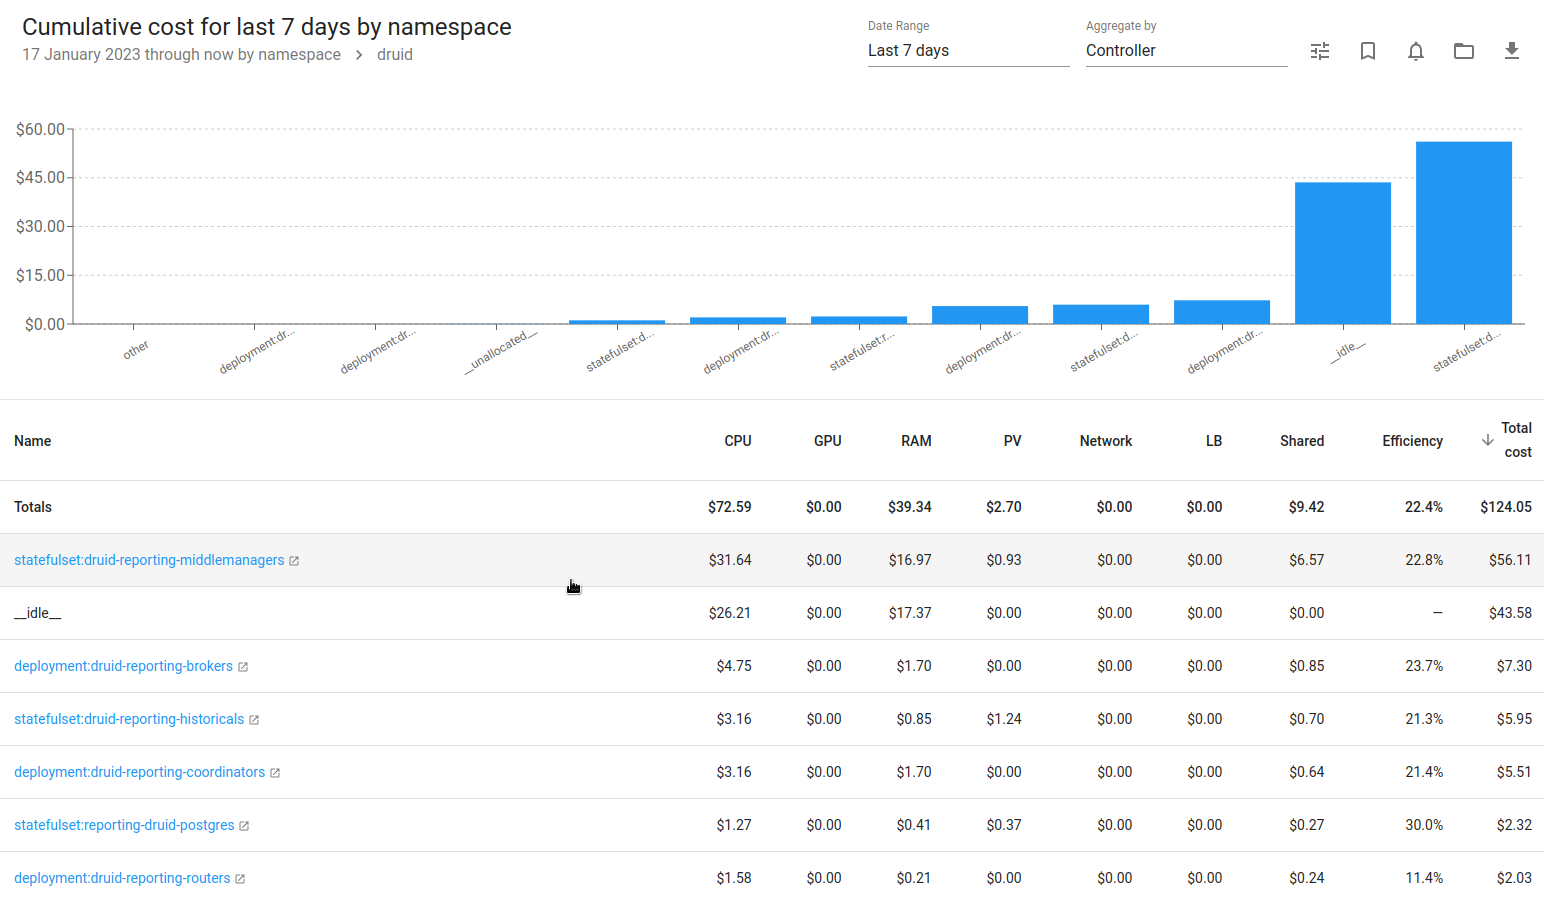
Go deeper, and get a breakdown by the specific controller – StatefulSet, Deployment:
Колонки тут:
- CPU, RAM: cost of used resources depending on the cost of WorkerNode resources
- PV: PersistentVolume cost in the selected controller, i.e. for StaefulSet for MiddleManagers we have PV which is AWS EBS which costs us money
- Network: need to check, too low values, as for me
- LB: LoadBalancers by cost in AWS
- Shared: Shared resources that will not be counted separately, such as namespace
kube-system, configured in http://localhost:9090/settings > Shared Cost - Efficiency: utilization vs requests by the formula:
((CPU Usage / CPU Requested) * CPU Cost) + (RAM Usage / RAM Requested) * RAM Cost) / (RAM Cost + CPU Cost))
the main indicator of resource efficiency, see Efficiency and Idle
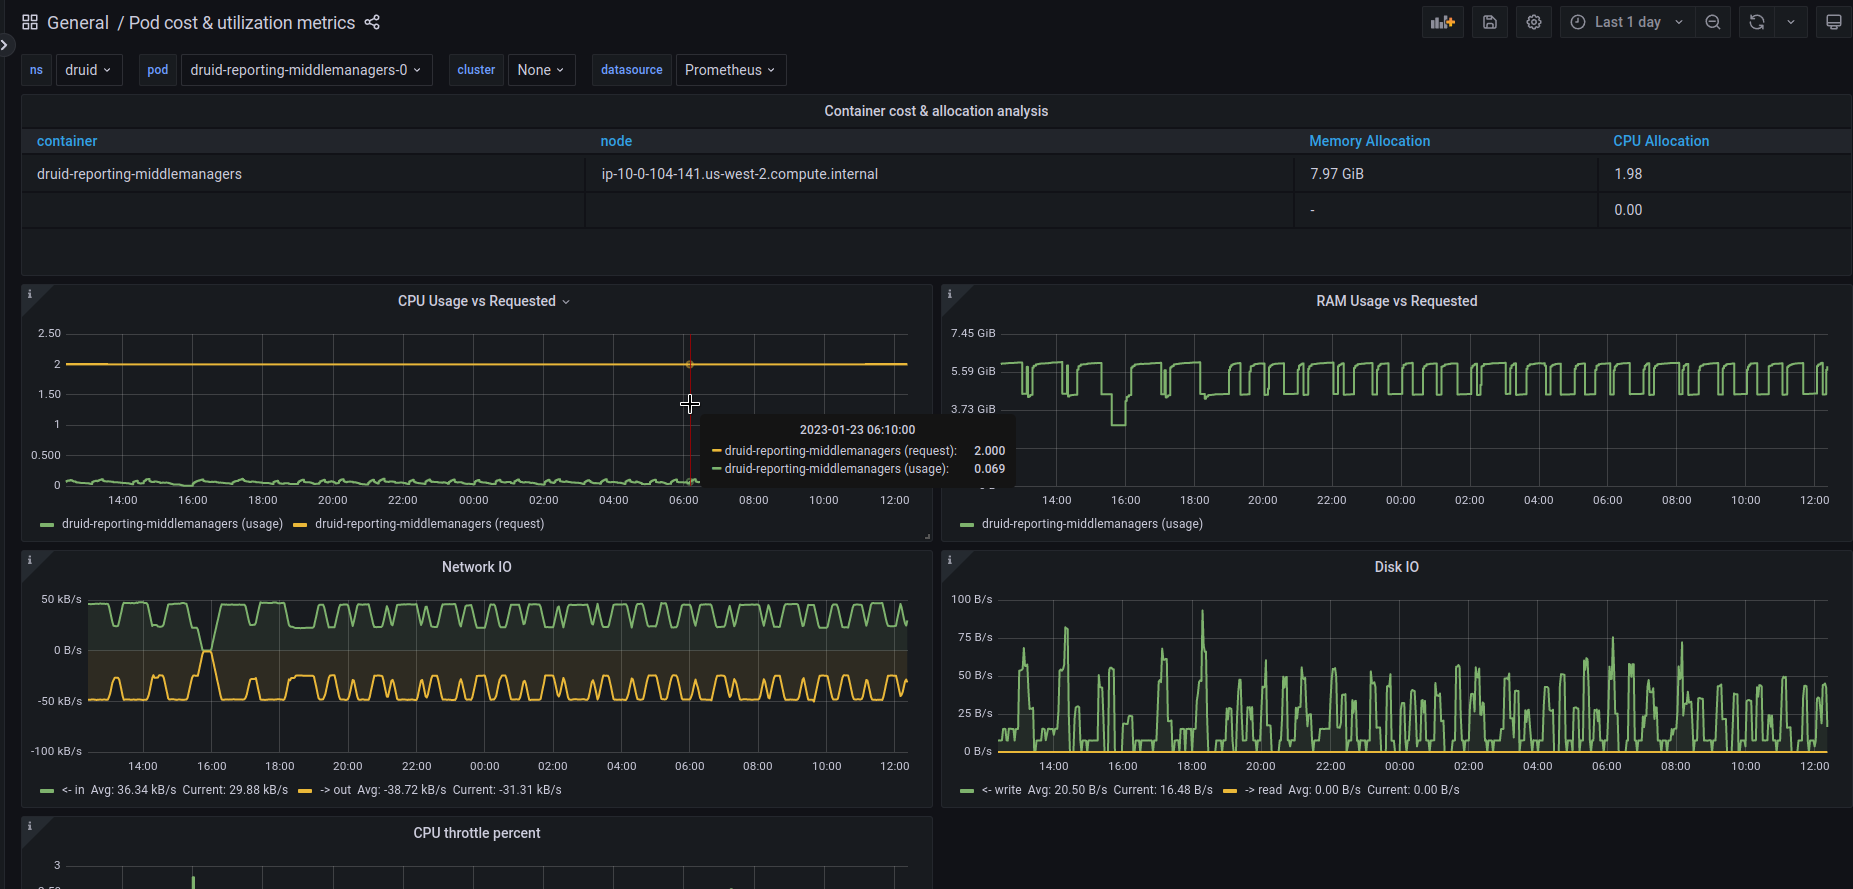
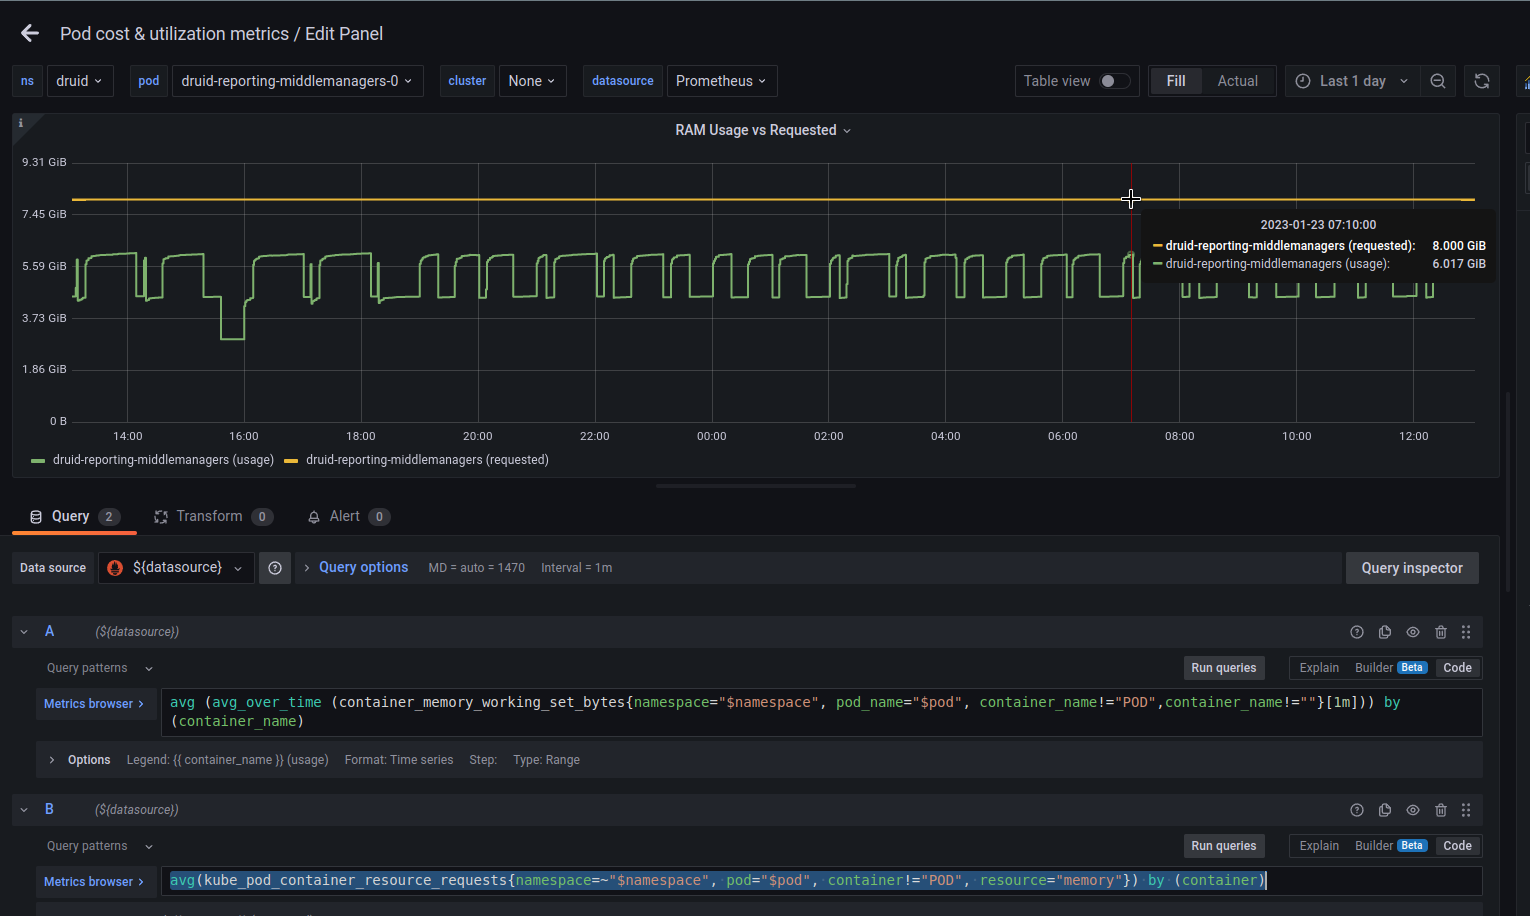
If you go deeper, there will be a link to the built-in Grafana, where you can see the resource usage of a specific Pod:
Although metrics for RAM Requested are not displayed out of the box.
To check the metrics, you can go to the built-in Prometheus:
[simterm]
$ kubectl -n kubecost port-forward svc/kubecost-prometheus-server 9091:80
[/simterm]
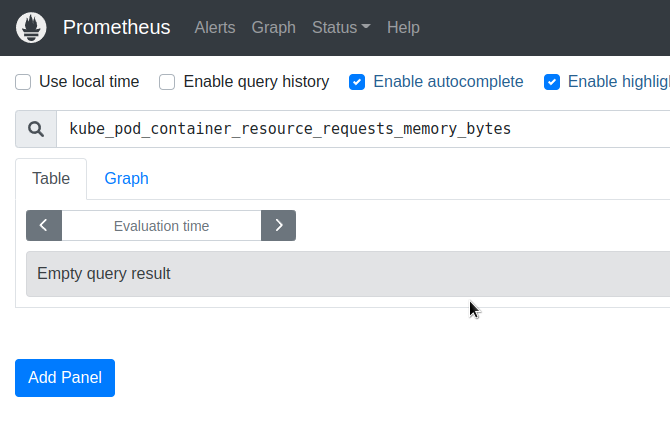
And indeed, the kube_pod_container_resource_requests_memory_bytes is empty:
Because the metric is now called kube_pod_container_resource_requests with resource="memory", so need to update the query in this Grafana:
avg(kube_pod_container_resource_requests{namespace=~"$namespace", pod="$pod", container!="POD", resource="memory"}) by (container)
__idle__
The __idle__ expenses are the difference between the cost of resources allocated for existing objects (Pods, Deployments) – their requests and real usage, and the “idle hardware” on which they work, i.e. unoccupied CPU/memory that can be used to launch new resources.
Savings
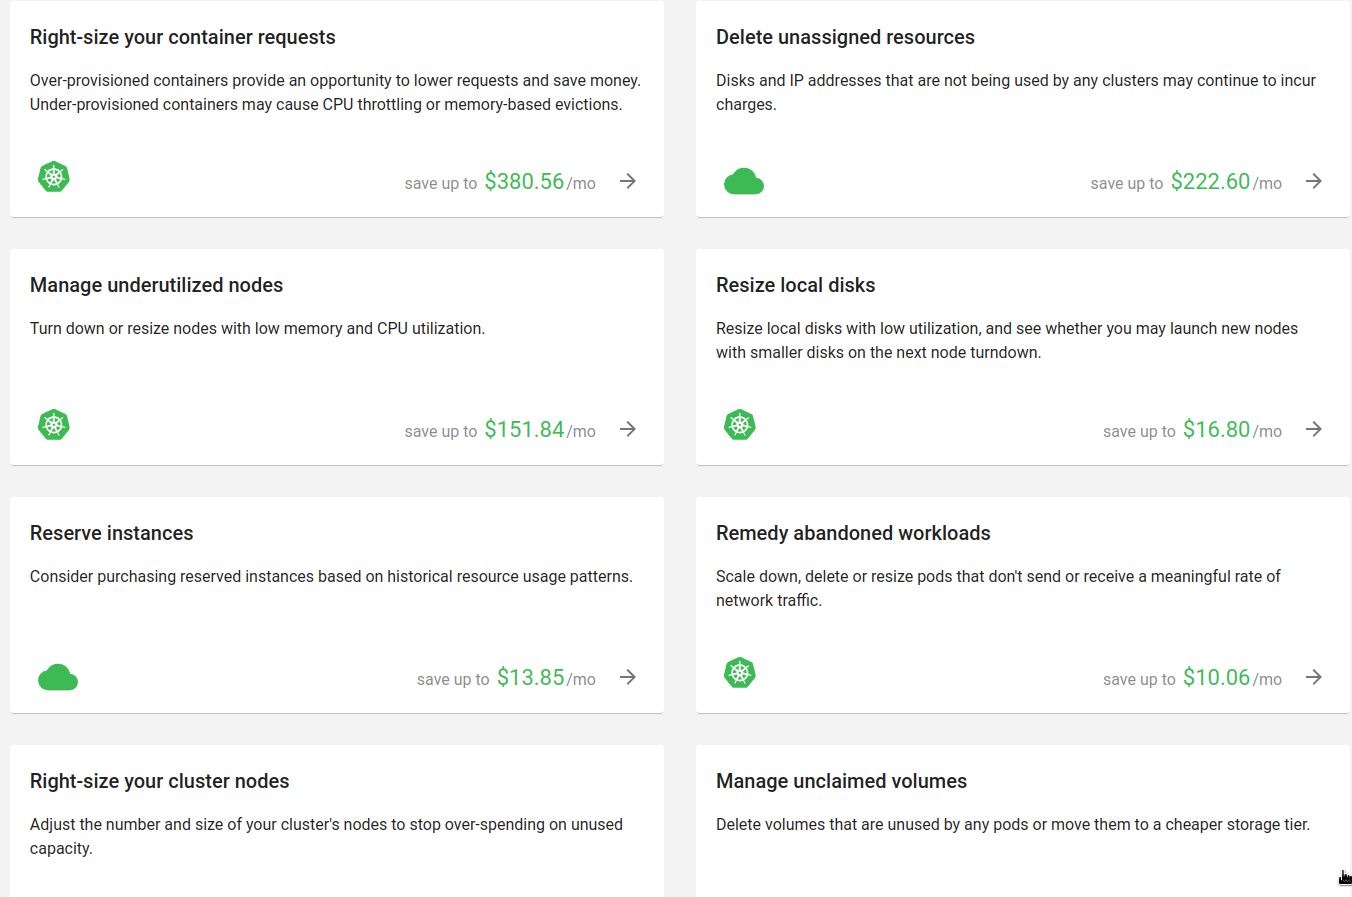
Here are some tips for costs optimization:
For example, the “Right-size your container requests” contains recommendations for configuring requests for resources – an analog of reports in the Kubernetes Resource Report:
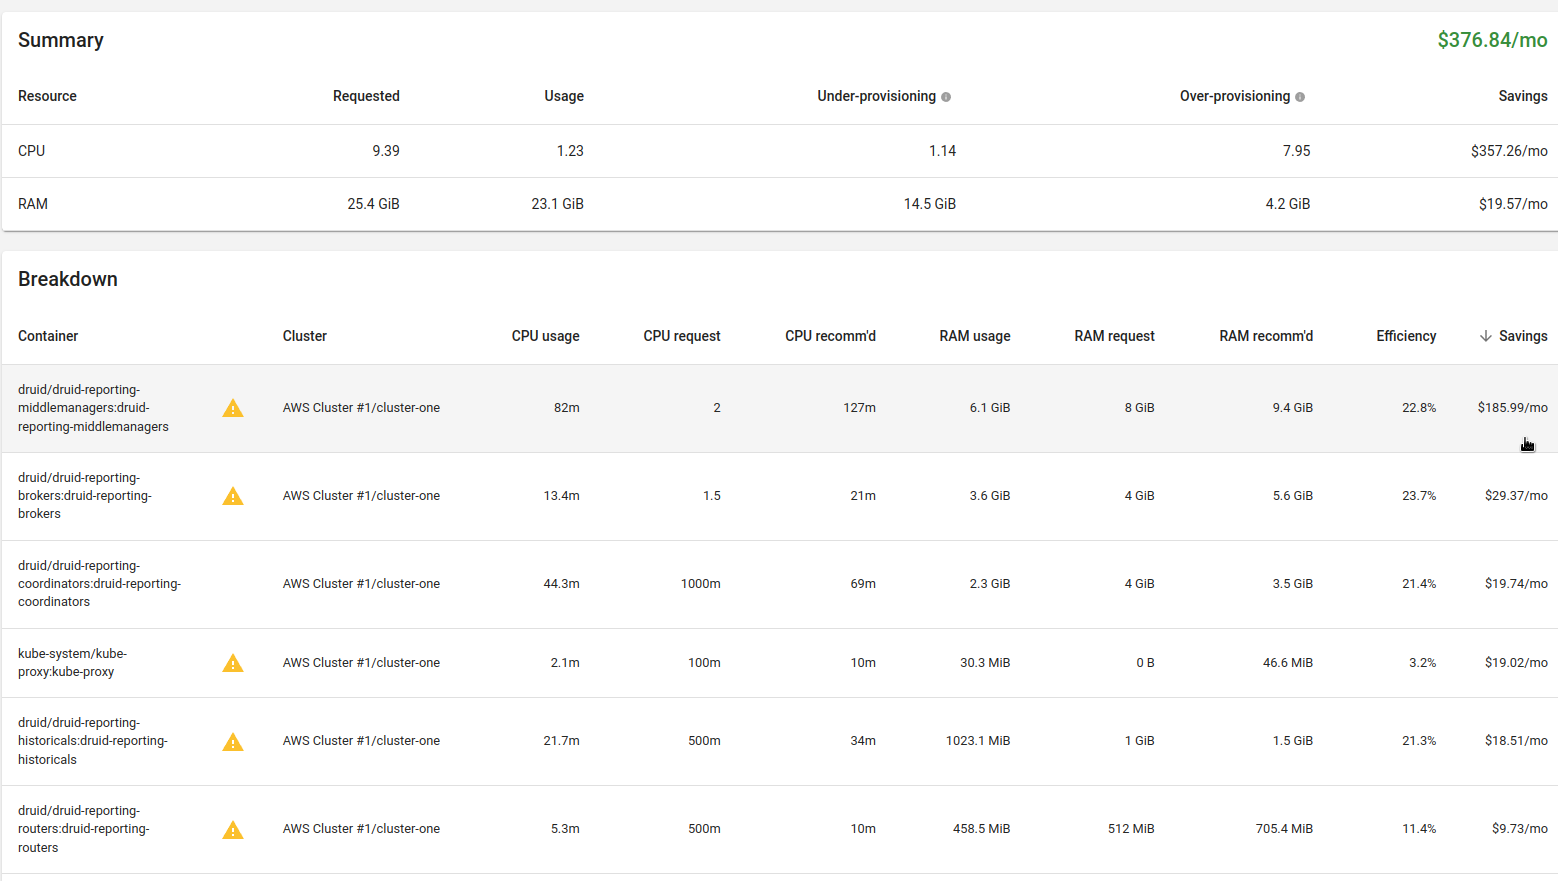
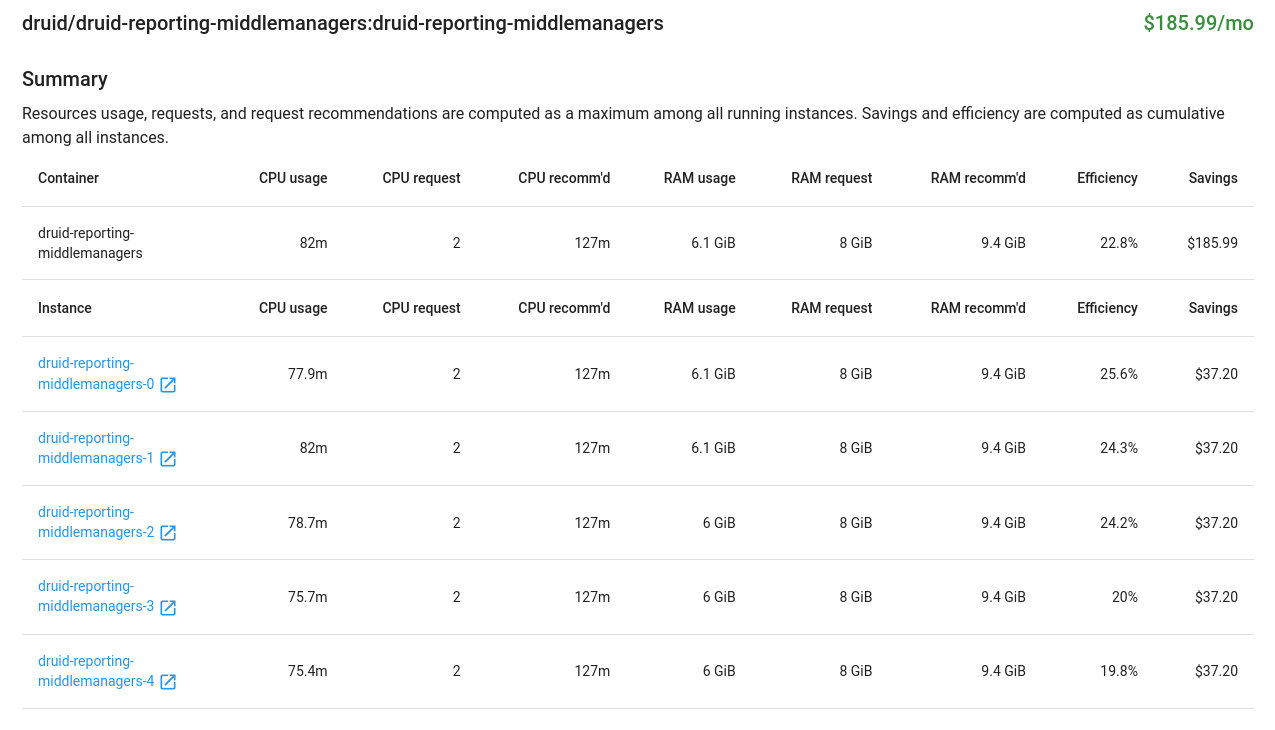
Let’s look at the Apache Druid again:
This is an over-request for CPU, and Kubecost recommends reducing these requests:
But we already spoke about Druid above – there is JVM, for each MiddleManager we run one Supervisor with two Tasks, and it is desirable to allocate a full core for each Task. So, leave it as it is.
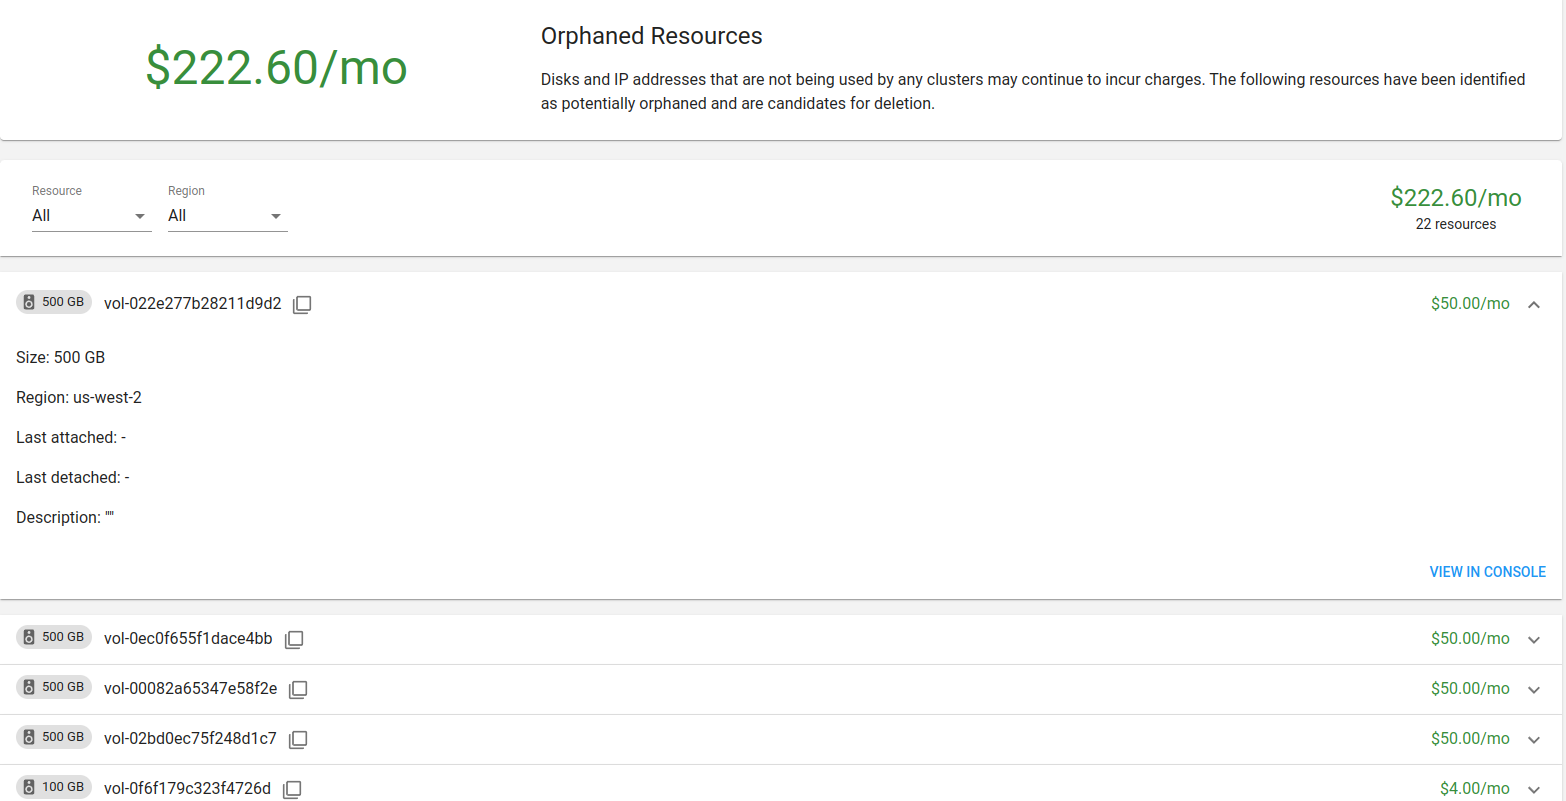
The useful part is the “Delete unassigned resources” – we, for example, found a bunch of unused EBS:
Health
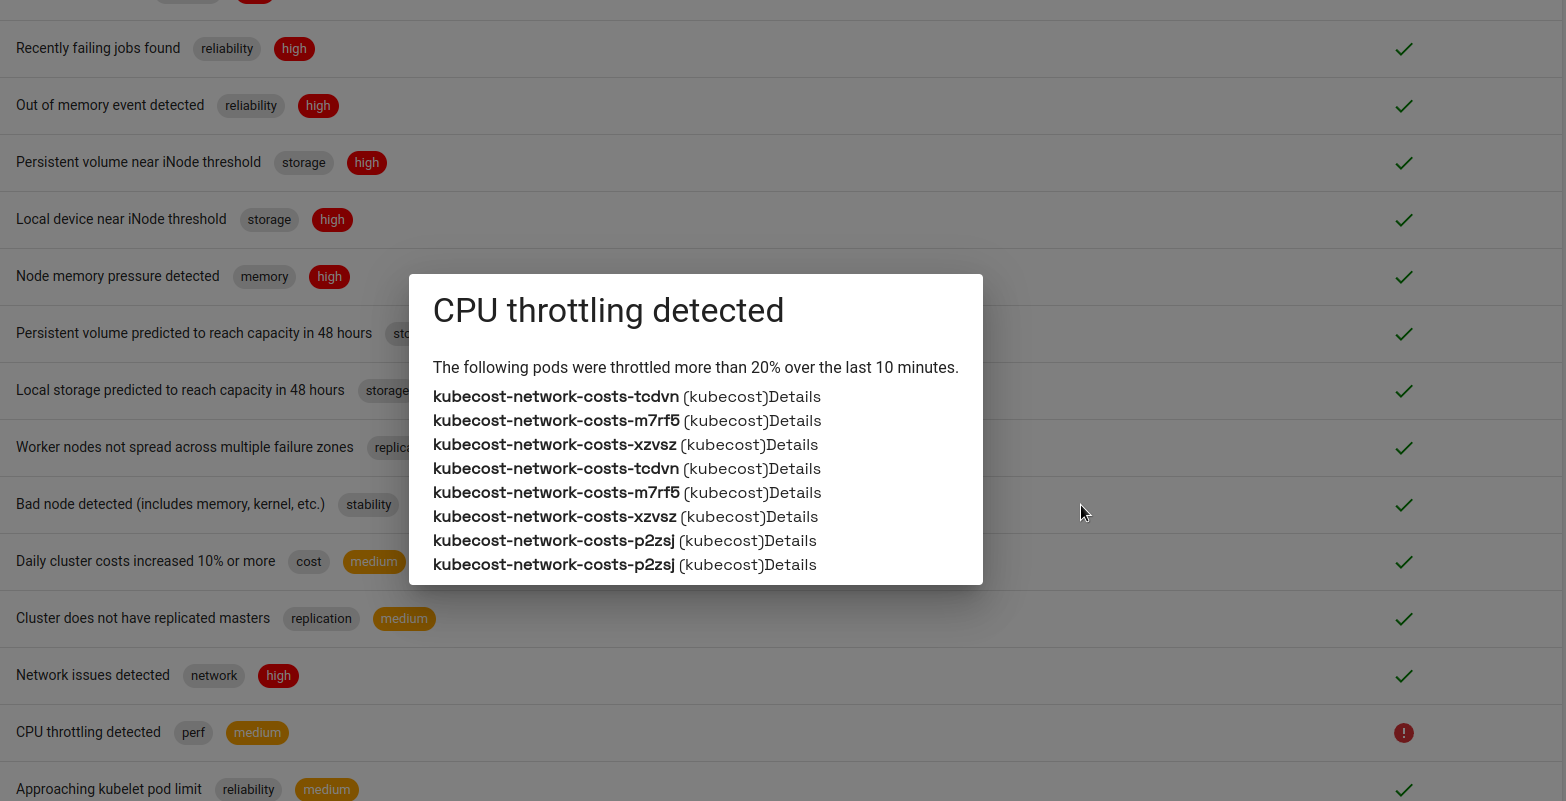
Also, a useful thing that displays the main problems with the cluster:
kubecost-network-costs actively uses the CPU, above its requests, and Kubernetes throttles it.
Alerts
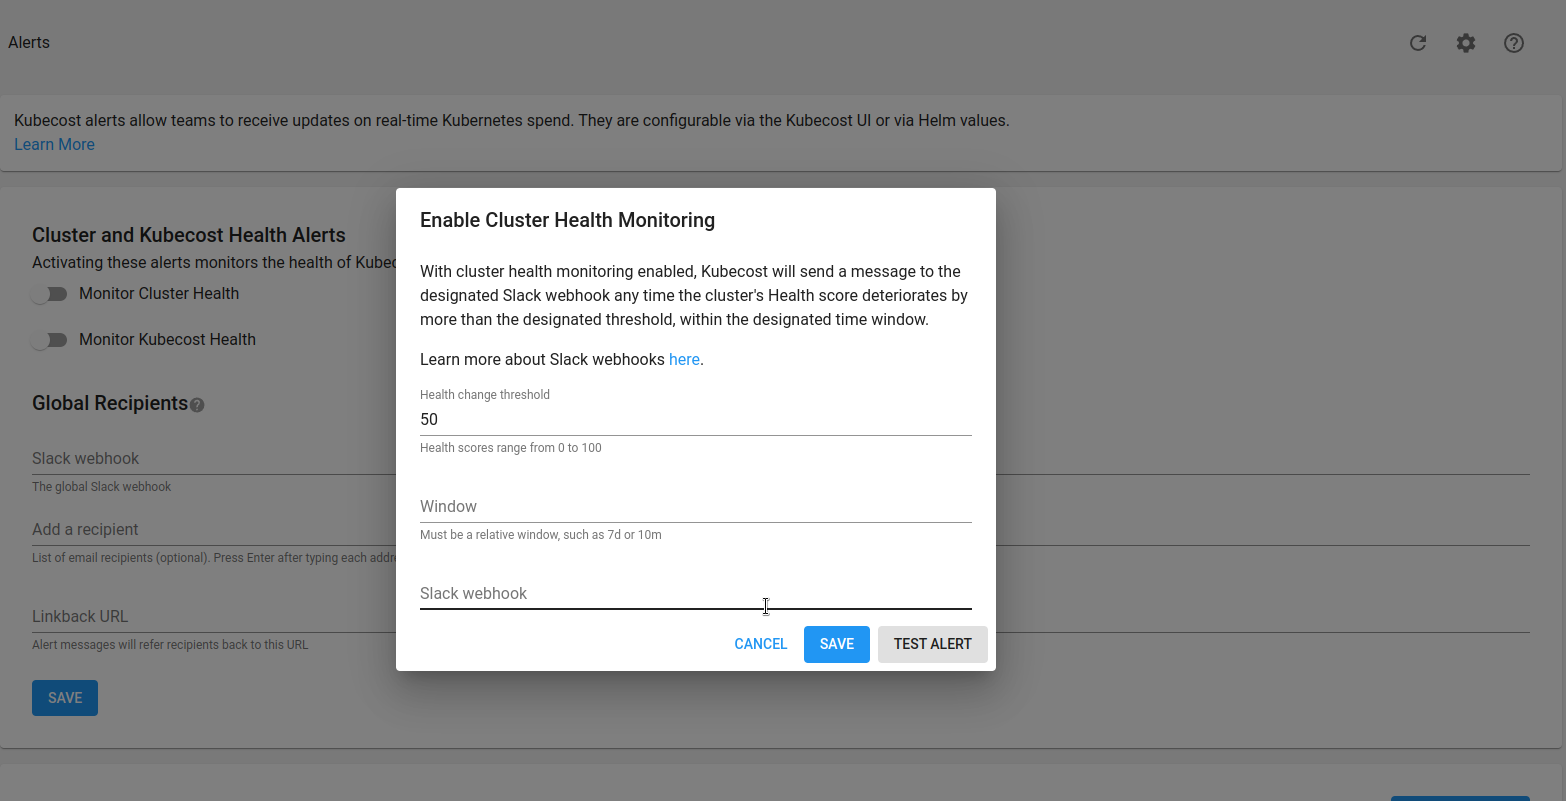
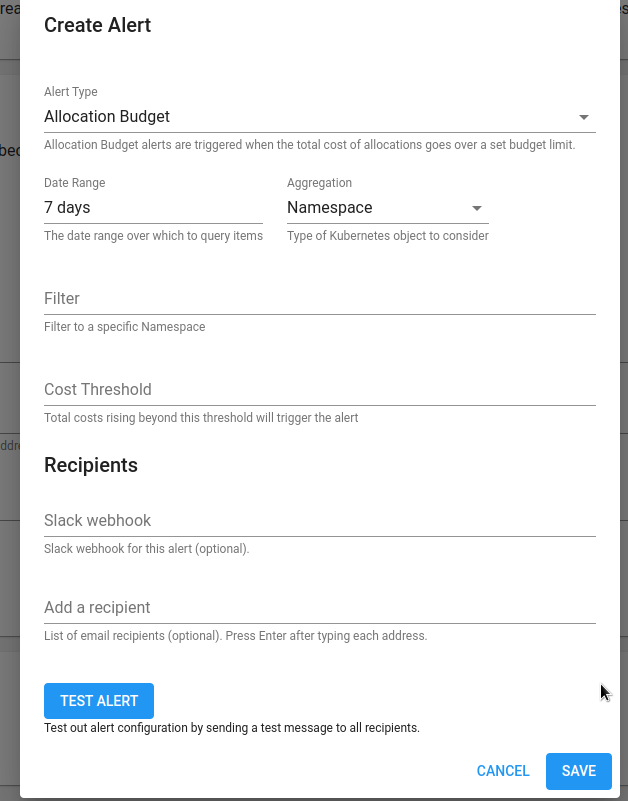
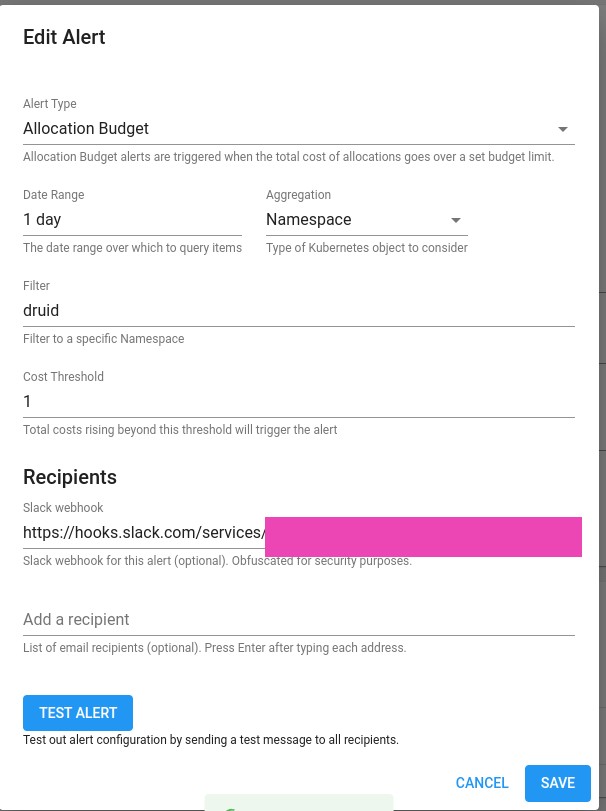
Here we can set up alerts, but I was able to set up sending only via Slack Webhook:
Documentation – Alerts.
Prometheus Alertmanager can be configured via values, but it uses its own, built-in, which is running along with Prometheus, but I didn’t find how to set up routes for it.
An example of an alert that can be configured in Kubecost:
global:
  notifications:
    alertConfigs:
      alerts:
        - type: budget
          threshold: 1
          window: 1d
          aggregation: namespace
          filter: druid
    alertmanager:
      enabled: true
      fqdn: http://prometheus-kube-prometheus-alertmanager.monitoring.svc
Here we added an alert with the type budget, in which we check the cost of the namespace druid for the last 1 day, and an alert if it becomes more expensive than $1.
Update the setup:
[simterm]
$ helm upgrade --install -n kubecost -f values.yaml kubecost kubecost/cost-analyzer
[/simterm]
The alert appears in the list:
But does not respond to pressing the Test button, and the alert does not appear in the local Alertmanager.
Slack webhook
Let’s try it with Slack webhook, the documentation is here>>>.
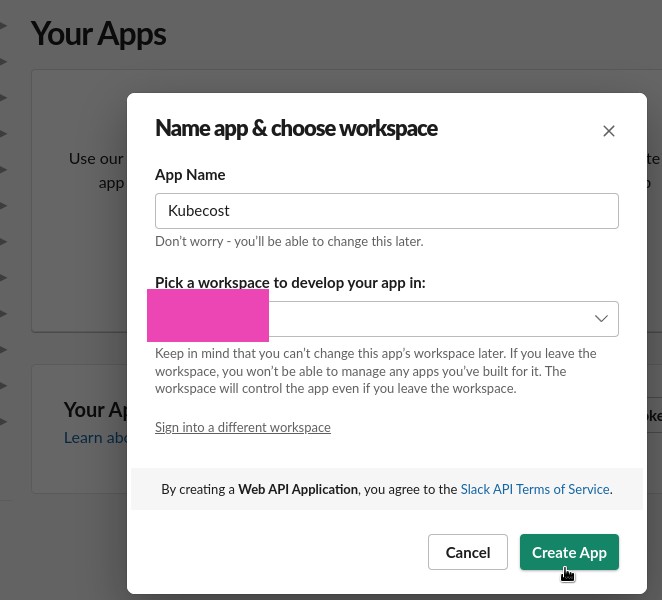
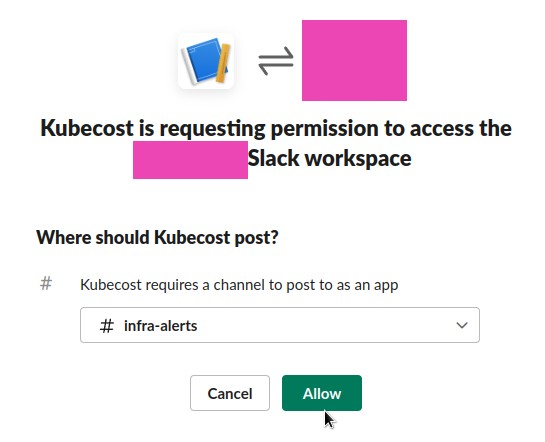
Create an Application:
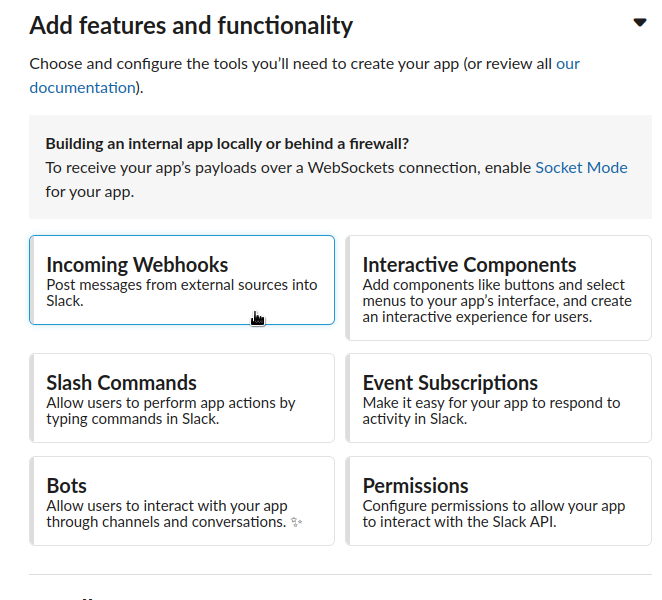
Go to the Webhooks:
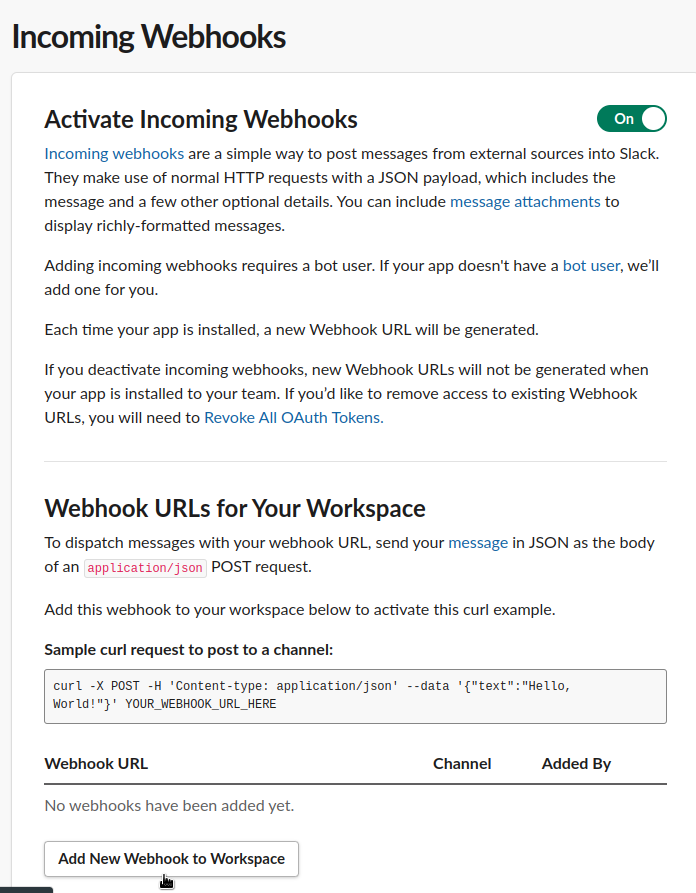
Activate it and click on the Add New Webhook:
Choose a channel to send alerts to:
Add the URL to the Kubecost, and test:
Final values.yaml
In the end, for the test, I got the following values:
kubecostToken: "c2V***f98"
kubecostProductConfigs:
  clusterName: development-qa-data-services
global:
  notifications:
    alertConfigs:
      globalSlackWebhookUrl: https://hooks.slack.com/services/T03***c1f
      alerts:
        - type: assetBudget
          threshold: 30
          window: 1d
          aggregation: type
          filter: 'Node'

        - type: assetBudget
          threshold: 4
          window: 1d
          aggregation: type
          filter: 'LoadBalancer'

        - type: assetBudget
          threshold: 3
          window: 1d
          aggregation: type
          filter: 'Disk'

        - type: assetBudget
          threshold: 40
          window: 3d
          aggregation: cluster
          filter: 'development-qa-data-services'

        - type: spendChange
          relativeThreshold: 0.01  # change relative to baseline average cost. Must be greater than -1 (can be negative).
          window: 1d
          baselineWindow: 7d       # previous window, offset by window
          aggregation: namespace
          filter: default, druid

        - type: spendChange
          relativeThreshold: 0.01
          window: 1d
          baselineWindow: 7d
          aggregation: cluster
          filter: 'development-qa-data-services'

        - type: health              # Alerts when health score changes by a threshold
          window: 10m
          threshold: 1
prometheus:
  kube-state-metrics:
    disabled: true
  nodeExporter:
    enabled: false
  serviceAccounts:
    nodeExporter:
      create: false

#serviceMonitor:
#  enabled: true
#  additionalLabels:
#    release: prometheus

networkCosts:
  enabled: true
  podMonitor:
    enabled: true
  config:
    destinations:
      direct-classification:
      - region: "us-west-2"
        zone: "us-west-2c"
        ips:
          - "10.0.64.0/19"
          - "10.0.160.0/20"
          - "10.0.208.0/21"
      - region: "us-west-2"
        zone: "us-west-2d"
        ips:
          - "10.0.216.0/21"
          - "10.0.96.0/19"
          - "10.0.176.0/20"
    services:
      amazon-web-services: true
Here are test alerts that can, in principle, be pulled into production.
I disabled ServiceMonitor to receive metrics in the external Prometheus because I don’t see the point yet – Kubecost will alert via Slack Webhook with its own alerts, and the dashboards in the built-in Grafana is good enough.
Also, I added the direct-classification for the networkCosts – let’s see, maybe it will show more correct traffic data.
#TODO
What has not yet been resolved by me:
- alerts via Alertmanager
- Kubecost does not see the Node Exporter (check at http://localhost:9090/diagnostics ), but this does not seem to affect anything – it receives the main metrics from cAdvisor
- networking costs are too low
Didn’t tested:
- did not set up Cost Usage Reports for AWS, see AWS Cloud Integration
- did not configure AWS Spot Instances pricing
- did not add Ingress, since we have AWS ALB Controller, and we need to do authorization, and SAML in Kubecost is available only in Premium
In general, that’s all.
The system is interesting and useful, but there are some bugs and difficulties that need to be dealt with.
![]()
