 Apache Druid is a columnar database, focused on working with large amounts of data, combining the features and benefits of Time-Series Database, Data Warehouse, and a search engine.
The general task is to set up monitoring of the Druid cluster in Kubernetes, so at first, we will see what it is in general and how it works, and then we launch the Druid to configure its monitoring.
To run Druid itself in Kubernetes, we use druid-operator, to collect metrics – druid-exporter, to monitor – Kubernetes Prometheus Stack, and we will run all this in Minikube.
Contents
Apache Druid overview
The main feature of Druid for me personally is that the system was originally developed for use in clouds such as AWS and Kubernetes, therefore it has excellent scaling, data storage, and recovery capabilities in case one of the services crashes.
Also, Apache Druid is:
- columnar data storage format: only the necessary table is loaded for processing, which significantly increases the speed of query processing. In addition, for fast scanning and data aggregation, Druid optimizes column storage according to its data type.
- scalable distributed system: Druid clusters can be located on tens and hundreds of individual servers
- data parallel processing: Druid can process each request in parallel on independent instances
- self-healing and self-balancing: at any time, you can add or remove new nodes to the cluster, while the cluster itself performs balancing requests and switching between them without any downtime. Moreover, Druid allows you to perform version upgrades without downtime.
- actually, cloud-native and fault-tolerant architecture: Druid was originally designed to work in distributed systems. After receiving new data, he immediately copies them to his Deep Storage, which can be data storage services such as Amazon S3, HDFS, or a network file system, and allows you to restore data even if all Druid servers fall. In a case when only a part of the Druid’s servers fell – the built-in data replication will allow you to continue executing queries (it’s already itching me to kill his nodes and look at the Druid’s reaction – but not this time)
- indexes for fast searches: Druid uses compressed Bitmap indexes, allowing you to quickly search across multiple columns
- Time-based partitioning: by default, Druid partitions data by time, allowing additional segments to be created across other fields. As a result, when executing queries with time intervals, only the necessary data segments will be used
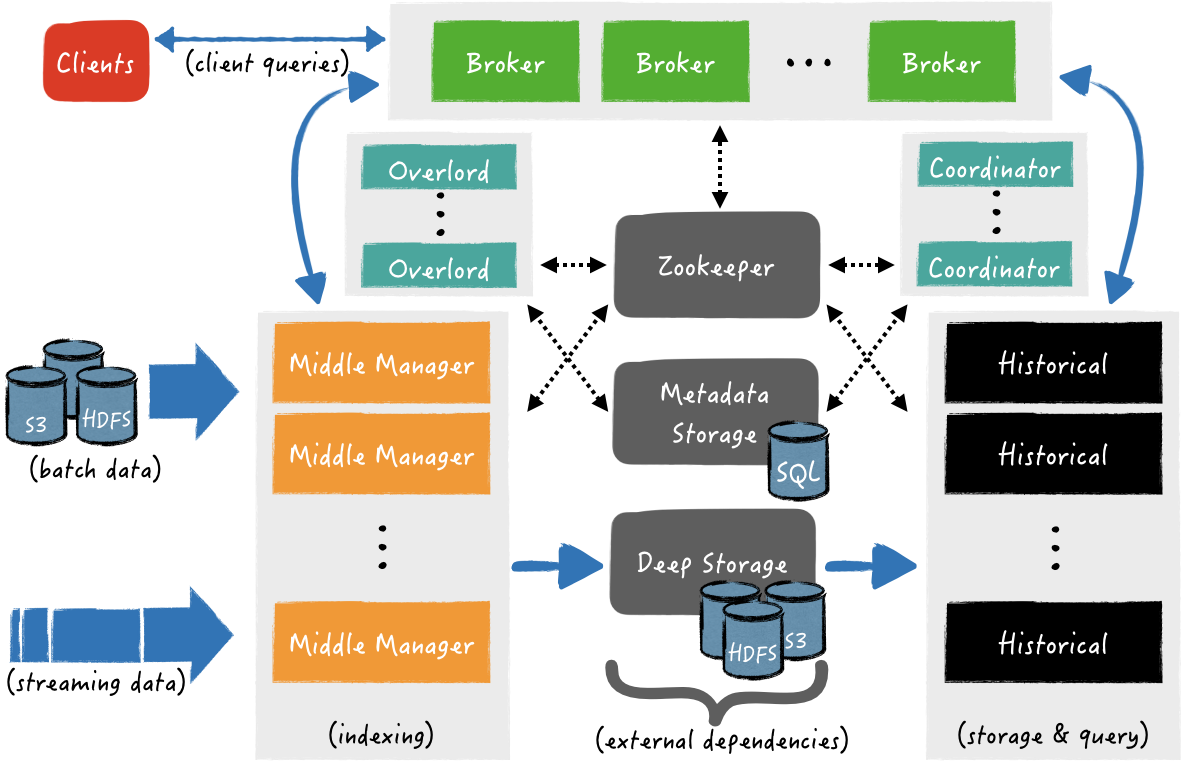
Druid Architecture and Components
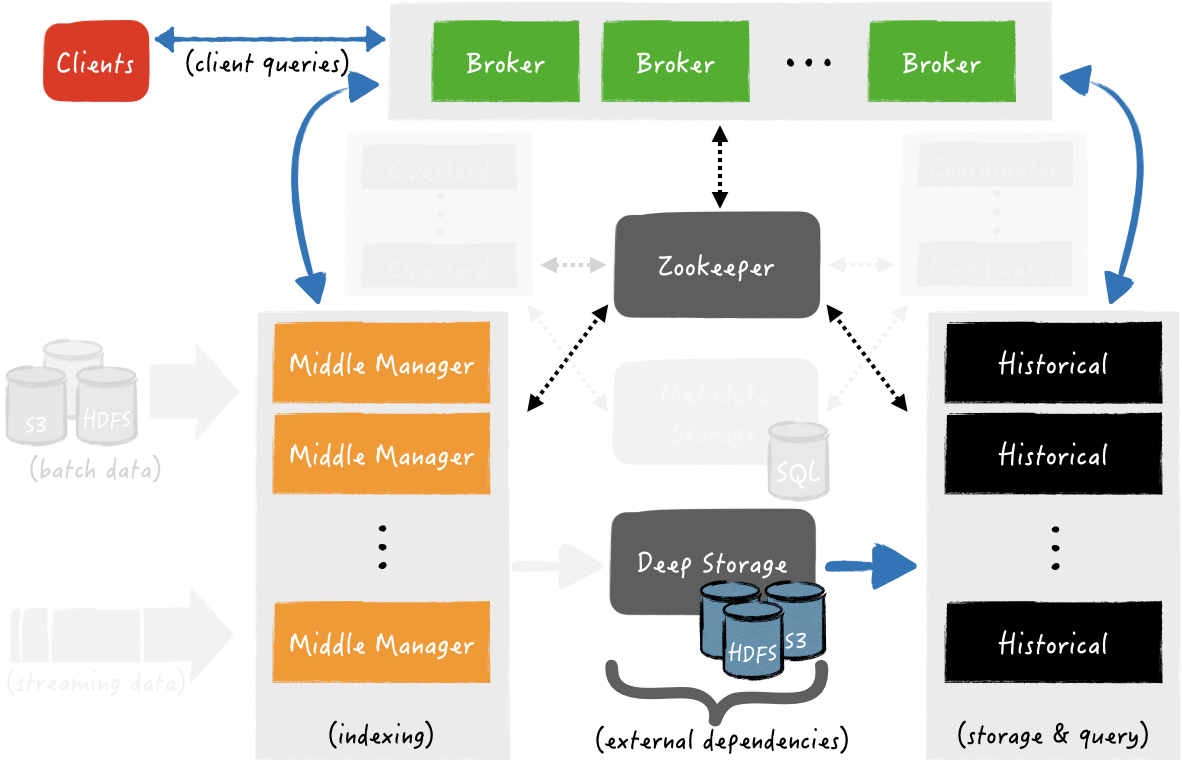
General architecture:
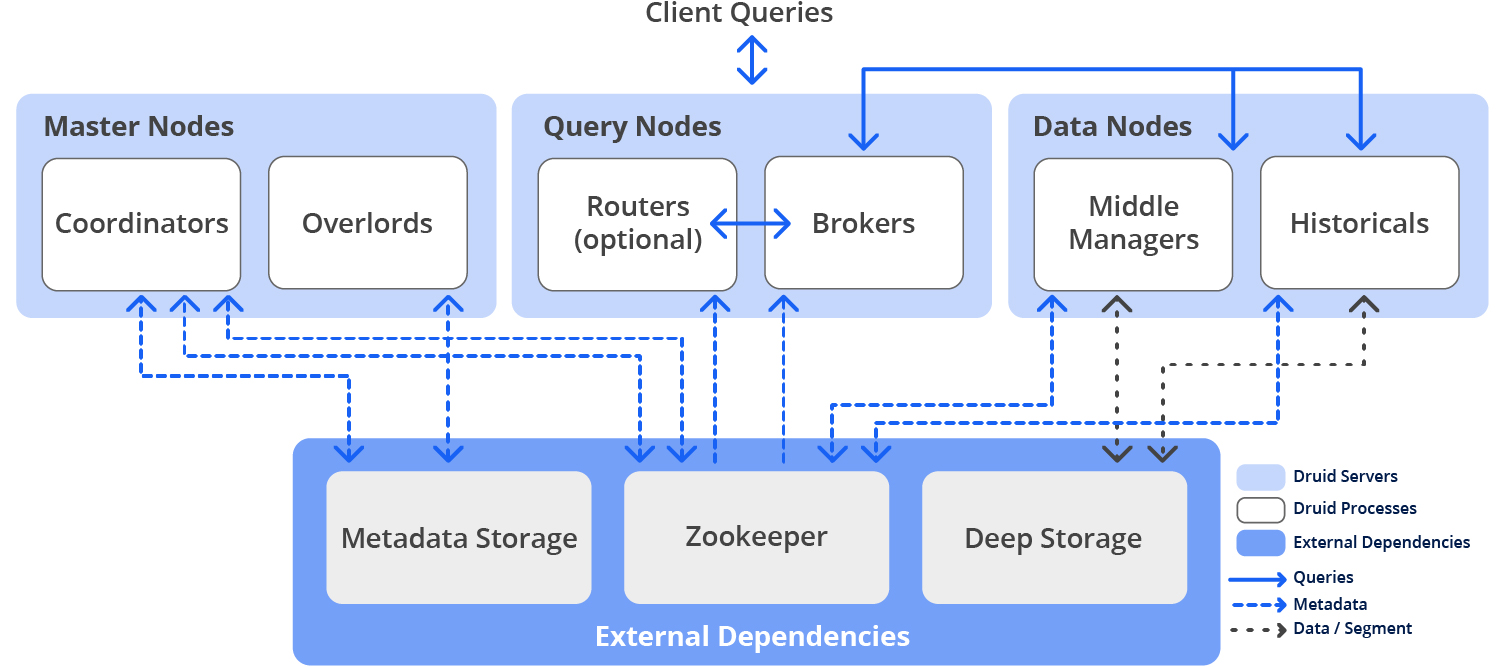
Three-server configuration – Master, Query, Data
Druid has several internal services used to work with data, and these services can be grouped into three types of servers – Master, Query, and Data, see Pros and cons of colocation.
Master servers – managing the addition of new data and availability (ingest/indexing) – responsible for launching new tasks to add new data and coordinating data availability:
- Coordinator: responsible for placing data segments on specific nodes with Historical processes
- Overlord: responsible for placing tasks for adding incoming data to Middle Managers and for coordinating the transfer of created segments to the Deep Store
Query servers – customer requests management
- Broker: receives requests from clients, determines which of the Historical or Middle Manager processes/nodes contain the necessary segments, and from the initial client request, forms and sends a sub-query (sub-query) to each of these processes, after which it receives responses from them, forms a general response from them with data for the client, and sends it to him.
At the same time, Historicals responds to subqueries that refer to data segments that are already stored in the Deep Store, and Middle Manager responds to queries that refer to recently received data that is still in memory and not sent to the Deep Store - Router: an optional service that provides a common API for working with Brokers, Overlords, and Coordinators, although you can use them directly. In addition, Router provides Druid Console – WebUI for working with the cluster, we will see it a little later
Data servers – manage the addition of new data to the cluster and store data for clients:
- Historical: “main workhorses” (c) of the Druid, who serve the storage and queries for “historical” data, i.e. those that are already in the Deep Store – download segments from there to the local disk of the host on which the Historical process is running, and generate responses based on this data for clients
- Middle Manager: handles adding new data to the cluster – they read data from external sources and create new data segments from them, which are then loaded into the Deep Store
- Peons: multiple tasks can be responsible for adding data to a cluster. To log and isolate resources, the Middle Manager creates Peons, which are separate JVM processes and are responsible for performing a specific task from the Middle Manager. Always runs on the same host where the Middle Manager process that spawned the Peon process is running.
- Indexer: an alternative to Middle Manager and Peon – instead of creating a separate JVM for each task from Middle Manager, Indexer executes them in separate threads of its JVM.
Developed as a simpler alternative to Middle Manager and Peon, currently an experimental feature, but will replace Middle Manager and Peon in the future
In addition to internal processes, Druid also uses external services for work – Deep storage, Metadata storage, and ZooKeeper:
- deep storage: is used to store all the data added to the system and is a distributed storage available to each Druid server. It can be Amazon S3, HDFS, or NFS
- metadata storage: used to store internal metadata such as segment usage information and current tasks. The role of such storage can be classic SUDB such as PostgreSQL or MySQL
- ZooKeeper: used for service discovery and coordination of services (in Kubernetes, you can use
druid-kubernetes-extensionsinstead, we’ll try it too, but another time)
Druid data flow
And let’s see how data is added (Data ingest) and answers to clients (Data query, Query Answering).
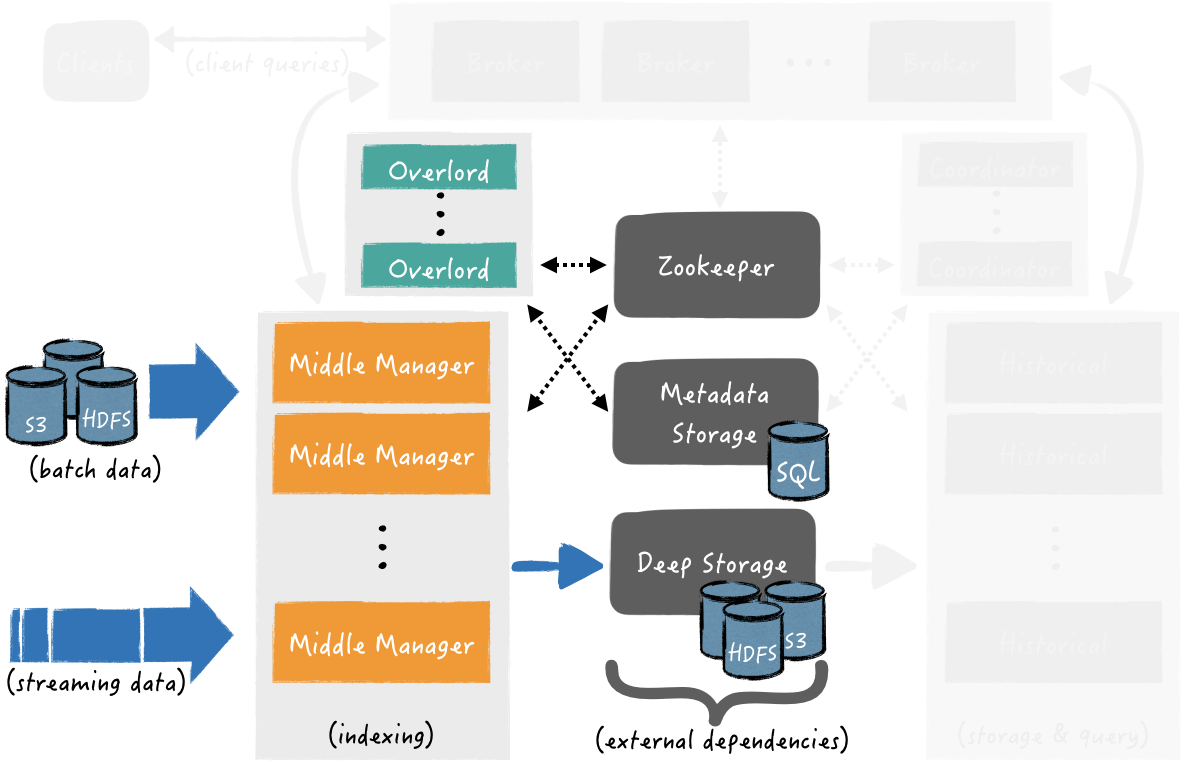
Data ingest
Adding data can be divided into two stages: in the first, Middle Manager instances run indexing tasks, these tasks create data segments and send them to the Deep Store.
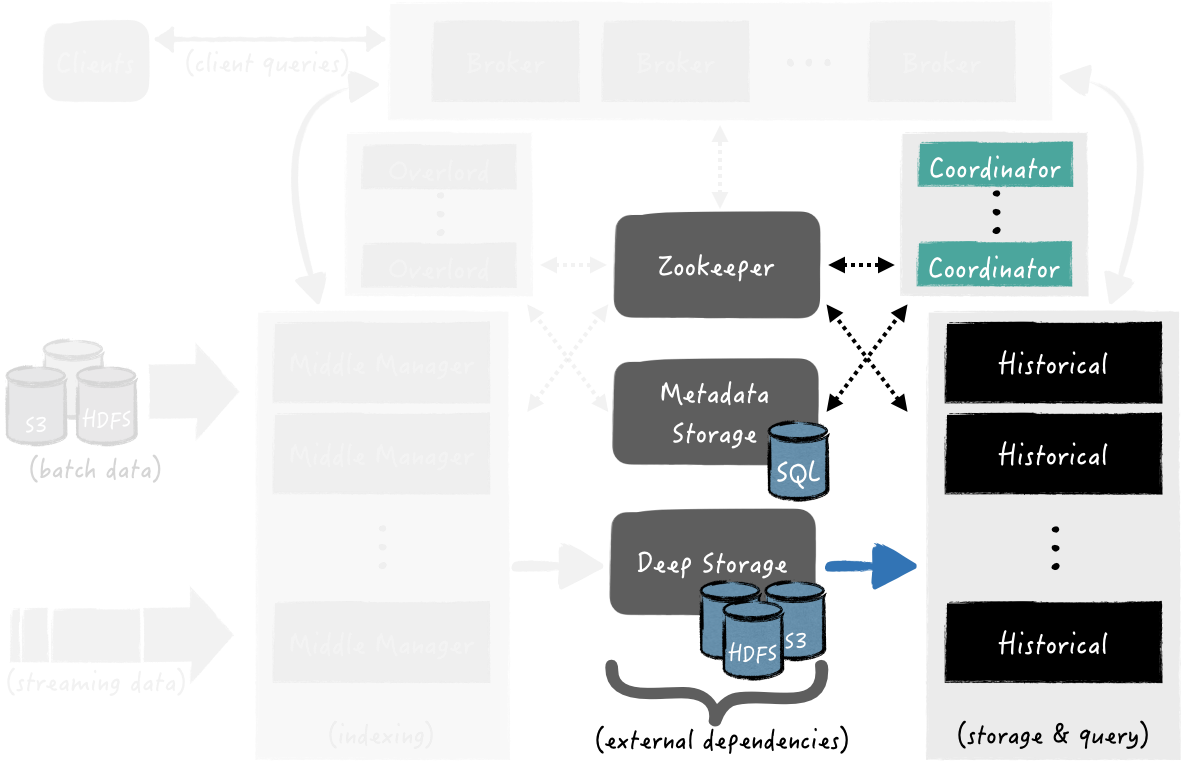
In the second, Historical instances download data segments from the Deep store to use them when forming responses to customer inquiries.
The first stage is getting data from external sources, indexing and creating data segments, and uploading them to the Deep store:
At the same time, in the process of creating data segments, they are already available for executing queries on them.
In the second stage – the Coordinator polls the Metadata store in search of new segments. As soon as the Coordinator process finds them, it selects the Historical instance, which must download the segment from the Deep store so that it becomes available for processing requests:
The Coordinator polls the Metadata Store for new segments. As soon as it finds them, the Coordinator selects the Historical instance, which should download the segment from the Deep store. When the segment is loaded – Historical is ready to use it to process requests
Data query
Clients send requests to Broker directly or via Router.
When such a request is received, the Broker determines which processes are servicing the required data segments.
If the data requires segments both from the Deep store (some old ones) and from the Middle Manager (which we get right now from the stream), then the Broker forms and sends separate subrequests to the Historical and Middle Managers, where each of them will perform its part and will return the data to the Broker. The broker aggregates them and answers the client with the final result.
Next, let’s try to deploy this whole thing and poke it with a twig, and then add monitoring from above.
Running Druid in Kubernetes
Run Minikube, add memory and CPU to run all the pods quietly, here we allocate 24 RAM and 8 cores – Java is there, let it eat:
[simterm]
$ minikube start --memory 12000 --cpus 8
😄  minikube v1.26.1 on Arch "rolling"
✨  Automatically selected the virtualbox driver
👍  Starting control plane node minikube in cluster minikube
🔥  Creating virtualbox VM (CPUs=8, Memory=12000MB, Disk=20000MB) ...
🐳  Preparing Kubernetes v1.24.3 on Docker 20.10.17 ...
    ▪ Generating certificates and keys ...
    ▪ Booting up control plane ...
    ▪ Configuring RBAC rules ...
🔎  Verifying Kubernetes components...
    ▪ Using image gcr.io/k8s-minikube/storage-provisioner:v5
🌟  Enabled addons: storage-provisioner, default-storageclass
🏄  Done! kubectl is now configured to use "minikube" cluster and "default" namespace by default
[/simterm]
Check:
[simterm]
$ minikube status
minikube
type: Control Plane
host: Running
kubelet: Running
apiserver: Running
kubeconfig: Configured
[/simterm]
And nodes:
[simterm]
$ kubectl get node
NAME       STATUS   ROLES           AGE   VERSION
minikube   Ready    control-plane   41s   v1.24.3
[/simterm]
Let’s move on to installing the Apache Druid operator.
Druid Operator install
Create a Namespace for the operator:
[simterm]
$ kubectl create namespace druid-operator
namespace/druid-operator created
[/simterm]
Set the operator to this namespace:
[simterm]
$ git clone https://github.com/druid-io/druid-operator.git
$ cd druid-operator/
$ helm -n druid-operator install cluster-druid-operator ./chart
[/simterm]
Check pod:
[simterm]
$ kubectl -n druid-operator get pod
NAME                                     READY   STATUS    RESTARTS   AGE
cluster-druid-operator-9c8c44f78-8svhc   1/1     Running   0          49s
[/simterm]
Move on to creating a cluster.
Spin Up Druid Cluster
Create a namespace:
[simterm]
$ kubectl create ns druid
namespace/druid created
[/simterm]
Install Zookeeper:
[simterm]
$ kubectl -n druid apply -f examples/tiny-cluster-zk.yaml
service/tiny-cluster-zk created
statefulset.apps/tiny-cluster-zk created
[/simterm]
To create a test cluster, use the config from the examples – examples/tiny-cluster.yaml.
Create a cluster:
[simterm]
$ kubectl -n druid apply -f examples/tiny-cluster.yaml
druid.druid.apache.org/tiny-cluster created
[/simterm]
Check resources:
[simterm]
$ kubectl -n druid get all
NAME                                    READY   STATUS              RESTARTS   AGE
pod/druid-tiny-cluster-brokers-0        0/1     ContainerCreating   0          21s
pod/druid-tiny-cluster-coordinators-0   0/1     ContainerCreating   0          21s
pod/druid-tiny-cluster-historicals-0    0/1     ContainerCreating   0          21s
pod/druid-tiny-cluster-routers-0        0/1     ContainerCreating   0          21s
pod/tiny-cluster-zk-0                   1/1     Running             0          40s

NAME                                      TYPE        CLUSTER-IP   EXTERNAL-IP   PORT(S)                      AGE
service/druid-tiny-cluster-brokers        ClusterIP   None         <none>        8088/TCP                     21s
service/druid-tiny-cluster-coordinators   ClusterIP   None         <none>        8088/TCP                     21s
service/druid-tiny-cluster-historicals    ClusterIP   None         <none>        8088/TCP                     21s
service/druid-tiny-cluster-routers        ClusterIP   None         <none>        8088/TCP                     21s
service/tiny-cluster-zk                   ClusterIP   None         <none>        2181/TCP,2888/TCP,3888/TCP   40s

NAME                                               READY   AGE
statefulset.apps/druid-tiny-cluster-brokers        0/1     21s
statefulset.apps/druid-tiny-cluster-coordinators   0/1     21s
statefulset.apps/druid-tiny-cluster-historicals    0/1     21s
statefulset.apps/druid-tiny-cluster-routers        0/1     21s
statefulset.apps/tiny-cluster-zk                   1/1     40s
[/simterm]
Wait for the pods to switch to Running (it took about 5 minutes), and forward the port to the Druid Router:
[simterm]
$ kubectl port-forward svc/druid-tiny-cluster-routers 8888:8088 -n druid
Forwarding from 127.0.0.1:8888 -> 8088
Forwarding from [::1]:8888 -> 8088
[/simterm]
Open Druid Console – http://localhost:8888:
You can look into Druid Services – we will see the same services that we saw in the form of Kubernetes pods:
Here is a good short video with an example of loading test data – for the sake of interest, you can walk.
Let’s move on to installing Prometheus.
Installing Kube Prometheus Stack
Create a namespace:
[simterm]
$ kubectl create ns monitoring
namespace/monitoring created
[/simterm]
Install KPS:
[simterm]
$ helm -n monitoring install kube-prometheus-stack prometheus-community/kube-prometheus-stack
NAME: kube-prometheus-stack
LAST DEPLOYED: Tue Sep 13 15:24:22 2022
NAMESPACE: monitoring
STATUS: deployed
...
[/simterm]
Check pods:
[simterm]
$ kubectl -n monitoring get po
NAME                                                        READY   STATUS              RESTARTS   AGE
alertmanager-kube-prometheus-stack-alertmanager-0           0/2     ContainerCreating   0          22s
kube-prometheus-stack-grafana-595f8cff67-zrvxv              3/3     Running             0          42s
kube-prometheus-stack-kube-state-metrics-66dd655687-nkxpb   1/1     Running             0          42s
kube-prometheus-stack-operator-7bc9959dd6-d52gh             1/1     Running             0          42s
kube-prometheus-stack-prometheus-node-exporter-rvgxw        1/1     Running             0          42s
prometheus-kube-prometheus-stack-prometheus-0               0/2     Init:0/1            0          22s
[/simterm]
Wait a few minutes until everyone becomes Running, and open access to Prometheus:
[simterm]
$ kubectl -n monitoring port-forward svc/kube-prometheus-stack-prometheus 9090:9090
Forwarding from 127.0.0.1:9090 -> 9090
Forwarding from [::1]:9090 -> 9090
[/simterm]
Open access to Grafana:
[simterm]
$ kubectl -n monitoring port-forward svc/kube-prometheus-stack-grafana 8080:80
Forwarding from 127.0.0.1:8080 -> 3000
Forwarding from [::1]:8080 -> 3000
[/simterm]
Grafana dashboard
To get the password from Grafana – we find its Secret:
[simterm]
$ kubectl -n monitoring get secret | grep graf
kube-prometheus-stack-grafana                                  Opaque               3      102s
[/simterm]
Get its value:
[simterm]
$ kubectl -n monitoring get secret kube-prometheus-stack-grafana -o jsonpath="{.data.admin-password}" | base64 --decode ; echo
prom-operator
[/simterm]
For Grafana there is a ready community дашборда, we can add it for now, but later then we will make our own.
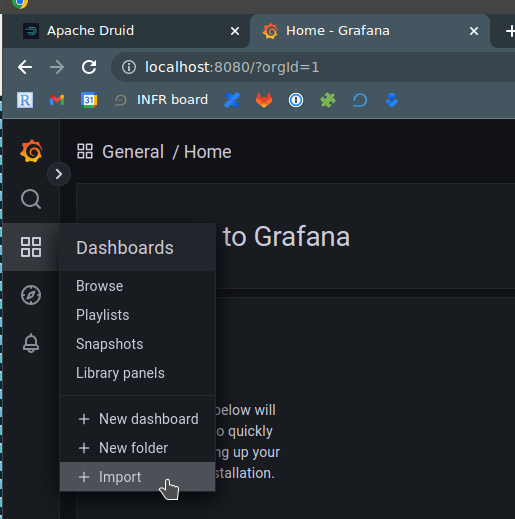
Open localhost:8080 in a browser, log in and go to Dashboards > Import:
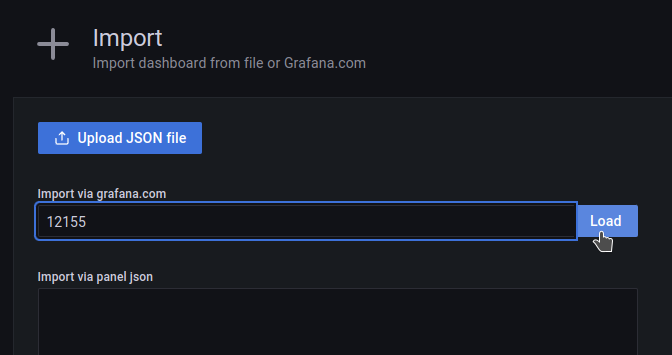
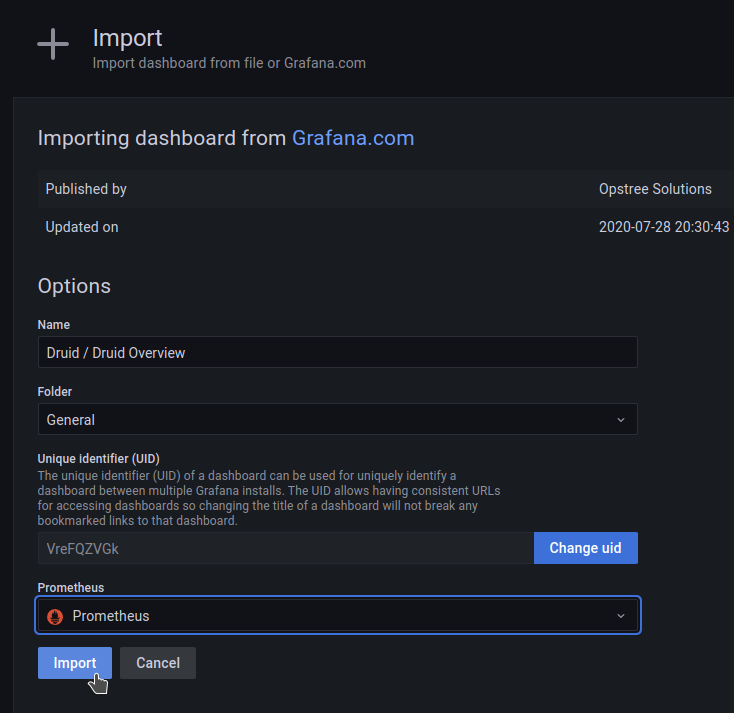
Set ID 12155, load:
Choose Prometheus as a datasource:
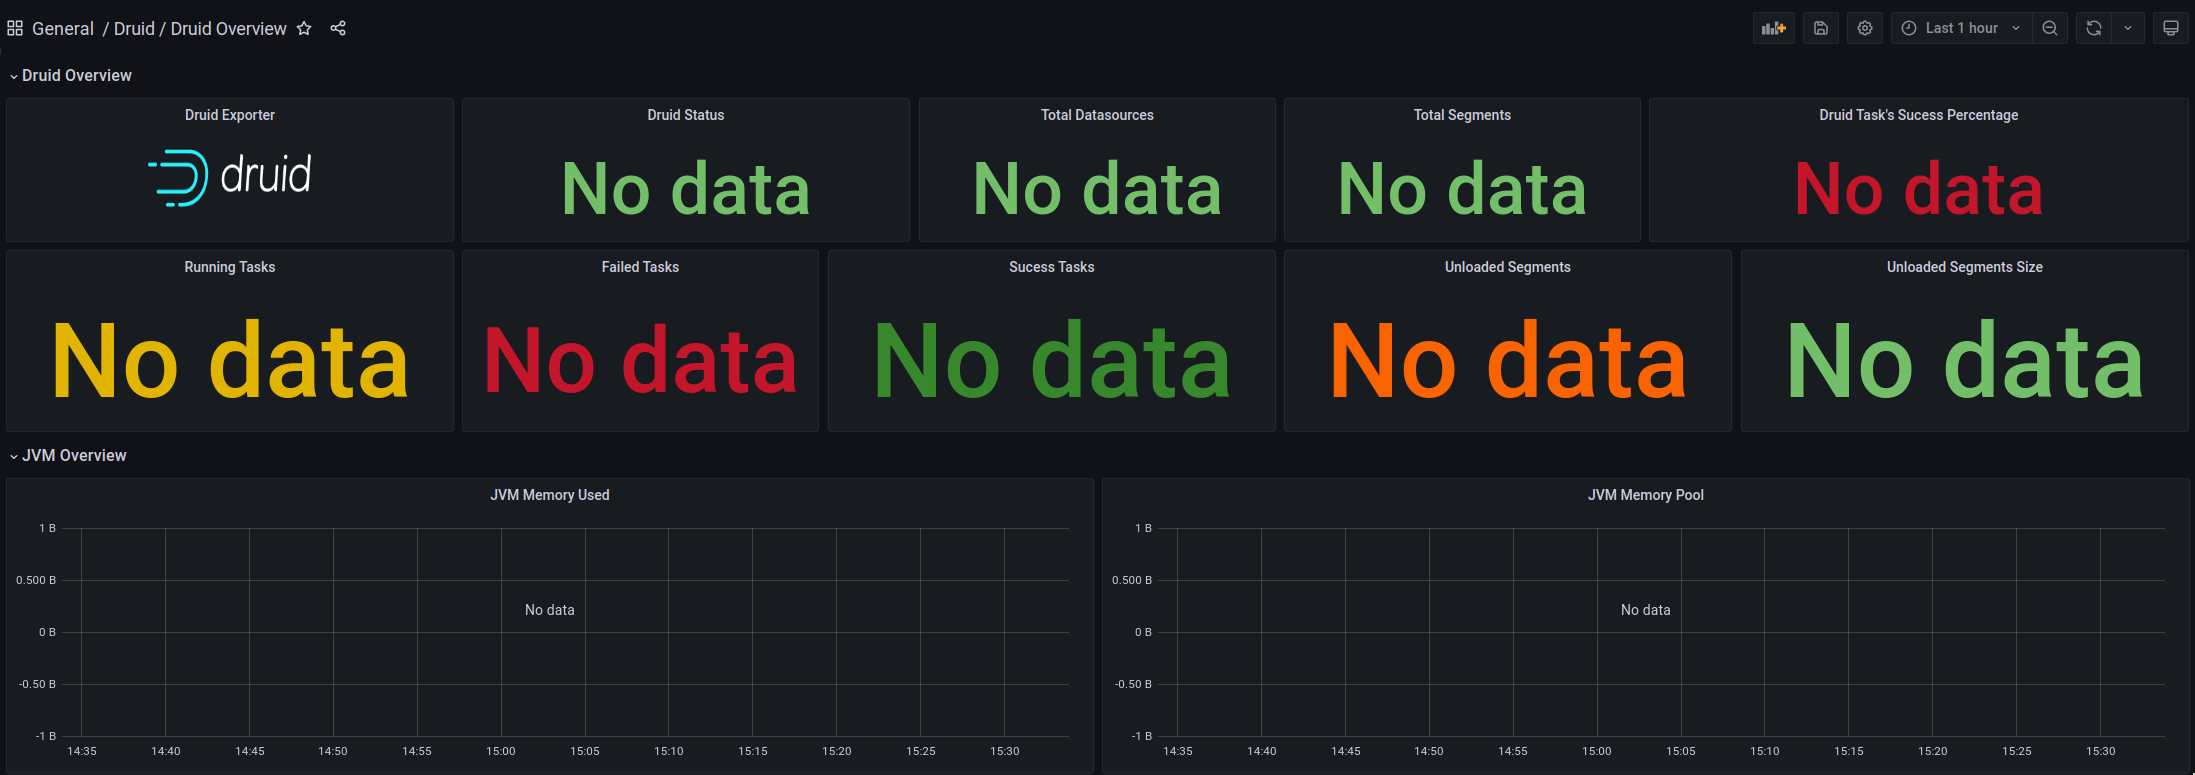
 And we got a dashboard, but so far without any data:
Running Druid Exporter
Clone the repository:
[simterm]
$ cd ../
$ git clone https://github.com/opstree/druid-exporter.git
$ cd druid-exporter/
[/simterm]
Check Druid Router’s Kubernetes Service – we need its full name to configure the Exporter:
[simterm]
$ kubectl -n druid get svc
NAME                              TYPE        CLUSTER-IP   EXTERNAL-IP   PORT(S)                      AGE
...
druid-tiny-cluster-routers        ClusterIP   None         <none>        8088/TCP                     4m3s
...
[/simterm]
Install the exporter in the namespace monitoring, in the druidURL parameter we specify the URL of the Router service of our Druid cluster we just looked above, its port, then we enable the creation of Kubernetes ServiceMonitor and the namespace in which Prometheus (monitoring) works for us:
[simterm]
$ helm -n monitoring install druid-exporter ./helm/ --set druidURL="http://druid-tiny-cluster-routers.druid.svc.cluster.local:8088" --set druidExporterPort="8080" --set logLevel="debug" --set logFormat="text" --set serviceMonitor.enabled=true --set serviceMonitor.namespace="monitoring"
NAME: druid-exporter
LAST DEPLOYED: Tue Sep 13 15:28:25 2022
NAMESPACE: monitoring
STATUS: deployed
...
[/simterm]
Open access to the Exporter Service:
[simterm]
$ kubectl -n monitoring port-forward svc/druid-exporter-prometheus-druid-exporter 8989:8080
Forwarding from 127.0.0.1:8989 -> 8080
Forwarding from [::1]:8989 -> 8080
[/simterm]
Check metrics:
[simterm]
$ curl -s localhost:8989/metrics | grep -v '#' | grep druid_
druid_completed_tasks 0
druid_health_status{druid="health"} 1
druid_pending_tasks 0
druid_running_tasks 0
druid_waiting_tasks 0
[/simterm]
Okay – already something, although not enough yet. Let’s add data collection to Prometheus, and then we will add more metrics.
Prometheus ServiceMonitor
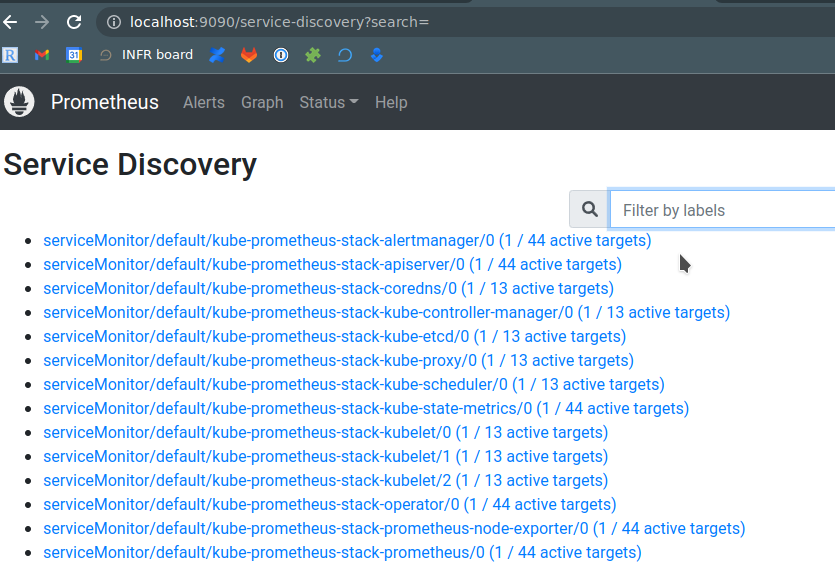
Check Prometheus Service Discovery – all our ServiceMonitors should be here:
Check if Druid ServiceMonitor is created in Kubernetes:
[simterm]
$ kubectl -n monitoring get servicemonitors
NAME                                             AGE
druid-exporter-prometheus-druid-exporter         87s
...
[/simterm]
Checking the Prometheus resource – its serviceMonitorSelector:
[simterm]
$ kubectl -n monitoring get prometheus -o yaml | yq .items[].spec.serviceMonitorSelector.matchLabels
{
  "release": "kube-prometheus-stack"
}
[/simterm]
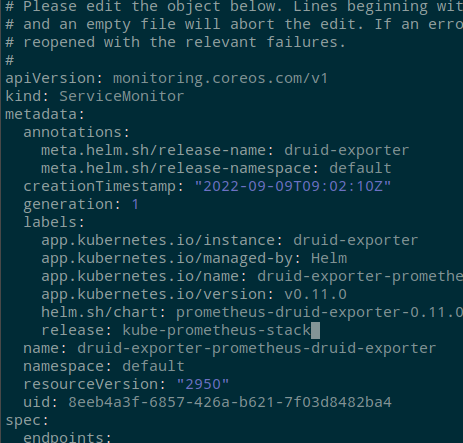
Edit the Druid ServiceMonitor:
[simterm]
$ kubectl -n monitoring edit servicemonitor druid-exporter-prometheus-druid-exporter
[/simterm]
Add the label release: kube-prometheus-stack, so that Prometheus starts collecting metrics from this ServiceMonitor:
Wait a minute or two, check the monitors again:
Check metrics:
Okay – now we have Druid Cluster, we have Prometheus, which collects metrics – it remains to configure these same metrics.
Apache Druid Monitoring
Druid’s monitoring setup includes Emitters and Monitors: emitters “push” metrics from the Druid “out”, and monitors determine which metrics will be available. At the same time, for some metrics it is required to include additional extensions.
См:
All services have common metrics, for example query/time, and your own, for example, there is a metric for Broker named sqlQuery/time, and these additional metrics can be enabled for a specific service through its runtime.properties.
Druid Metrics Emitters
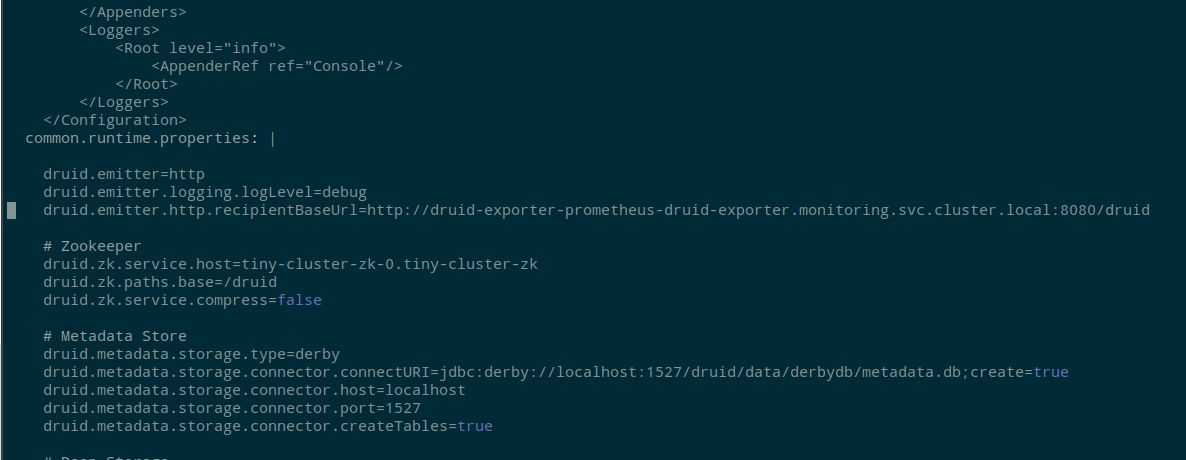
To enable metrics emission – edit examples/tiny-cluster.yaml, and to the common.runtime.properties add the followong:
druid.emitter=http
druid.emitter.logging.logLevel=debug
druid.emitter.http.recipientBaseUrl=http://druid-exporter-prometheus-druid-exporter.monitoring.svc.cluster.local:8080/druid
Save, update the cluster:
[simterm]
$ kubectl -n druid apply -f examples/tiny-cluster.yaml
druid.druid.apache.org/tiny-cluster configured
[/simterm]
Wait a minute or two for the pods to restart and start collecting metrics, check the metrics in the Exporter:
[simterm]
$ curl -s localhost:8989/metrics | grep -v '#' | grep druid_ | head
druid_completed_tasks 0
druid_emitted_metrics{datasource="",host="druid-tiny-cluster-brokers-0:8088",metric_name="avatica-remote-JsonHandler-Handler/Serialization",service="druid-broker"} 0
druid_emitted_metrics{datasource="",host="druid-tiny-cluster-brokers-0:8088",metric_name="avatica-remote-ProtobufHandler-Handler/Serialization",service="druid-broker"} 0
druid_emitted_metrics{datasource="",host="druid-tiny-cluster-brokers-0:8088",metric_name="avatica-server-AvaticaJsonHandler-Handler/RequestTimings",service="druid-broker"} 0
druid_emitted_metrics{datasource="",host="druid-tiny-cluster-brokers-0:8088",metric_name="avatica-server-AvaticaProtobufHandler-Handler/RequestTimings",service="druid-broker"} 0
druid_emitted_metrics{datasource="",host="druid-tiny-cluster-brokers-0:8088",metric_name="jetty-numOpenConnections",service="druid-broker"} 1
druid_emitted_metrics{datasource="",host="druid-tiny-cluster-coordinators-0:8088",metric_name="compact-task-count",service="druid-coordinator"} 0
druid_emitted_metrics{datasource="",host="druid-tiny-cluster-coordinators-0:8088",metric_name="compactTask-availableSlot-count",service="druid-coordinator"} 0
druid_emitted_metrics{datasource="",host="druid-tiny-cluster-coordinators-0:8088",metric_name="compactTask-maxSlot-count",service="druid-coordinator"} 0
druid_emitted_metrics{datasource="",host="druid-tiny-cluster-coordinators-0:8088",metric_name="coordinator-global-time",service="druid-coordinator"} 2
[/simterm]
Got new druid_emitted_metrics – nice.
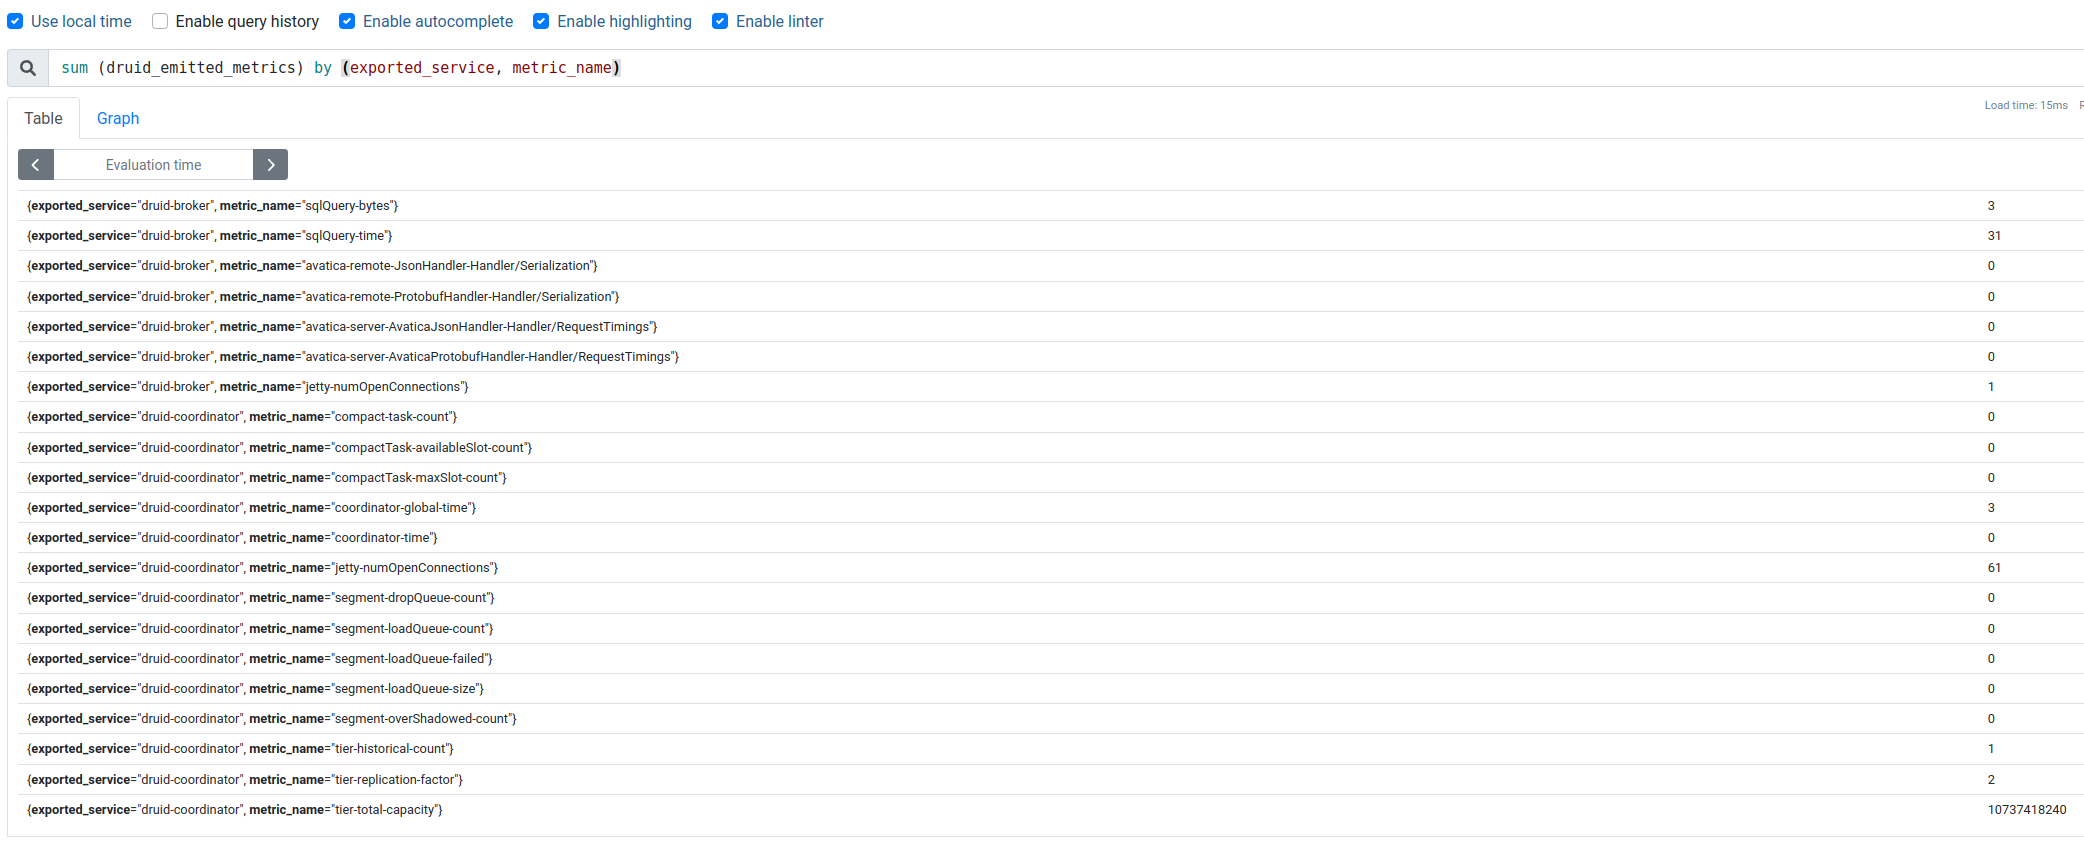
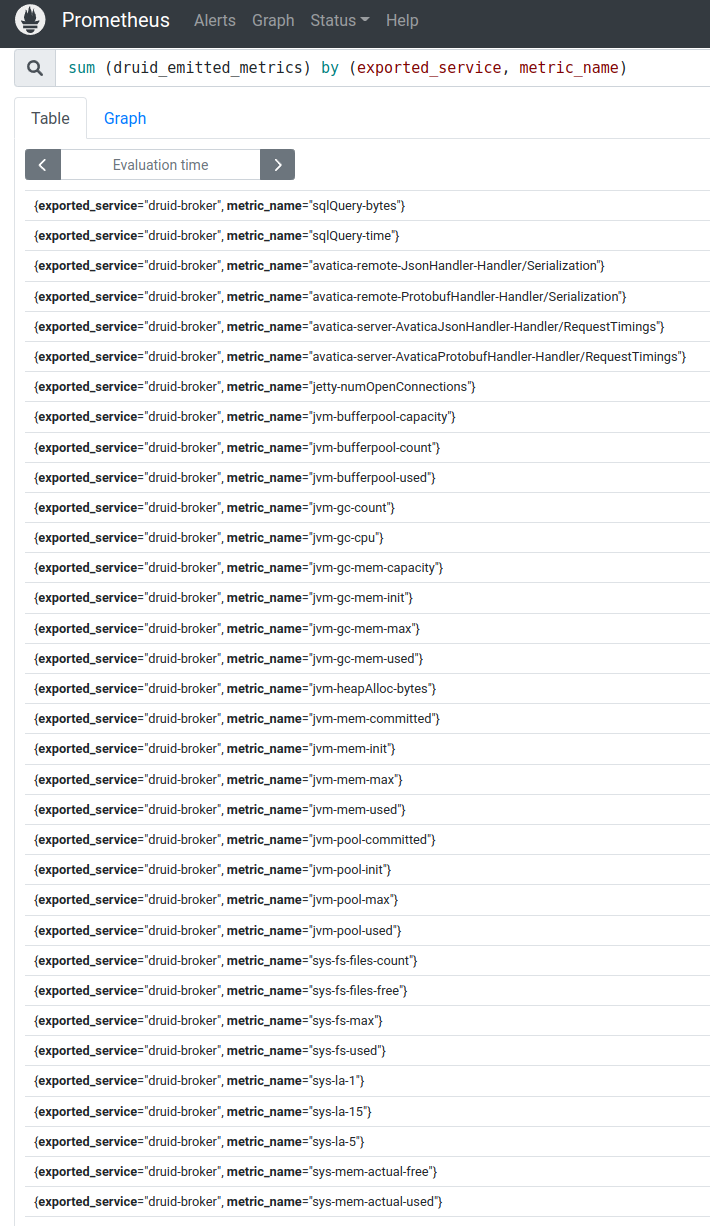
In the label exported_service we can see a Druid’s service and in the metric_name – which metric exactly.
CHech with Prometheus:
Perfect!
But I want more metrics – “Need more metrics, my lord!” (c)
Druid Monitors
For example, I want to know the CPU consumption of each of the processes/services.
To be able to see all system metrics (without Prometheus Node Exporter) – include org.apache.druid.java.util.metrics.SysMonitor, and for data from JVM – add org.apache.druid.java.util.metrics.JvmMonitor.
In the same examples/tiny-cluster.yaml in the block common.runtime.properties add the following:
...
druid.monitoring.monitors=["org.apache.druid.java.util.metrics.SysMonitor", "org.apache.druid.java.util.metrics.JvmMonitor"]
...
Save, update the cluster, wait for the restart of the pods, and after a couple of minutes check the metrics:
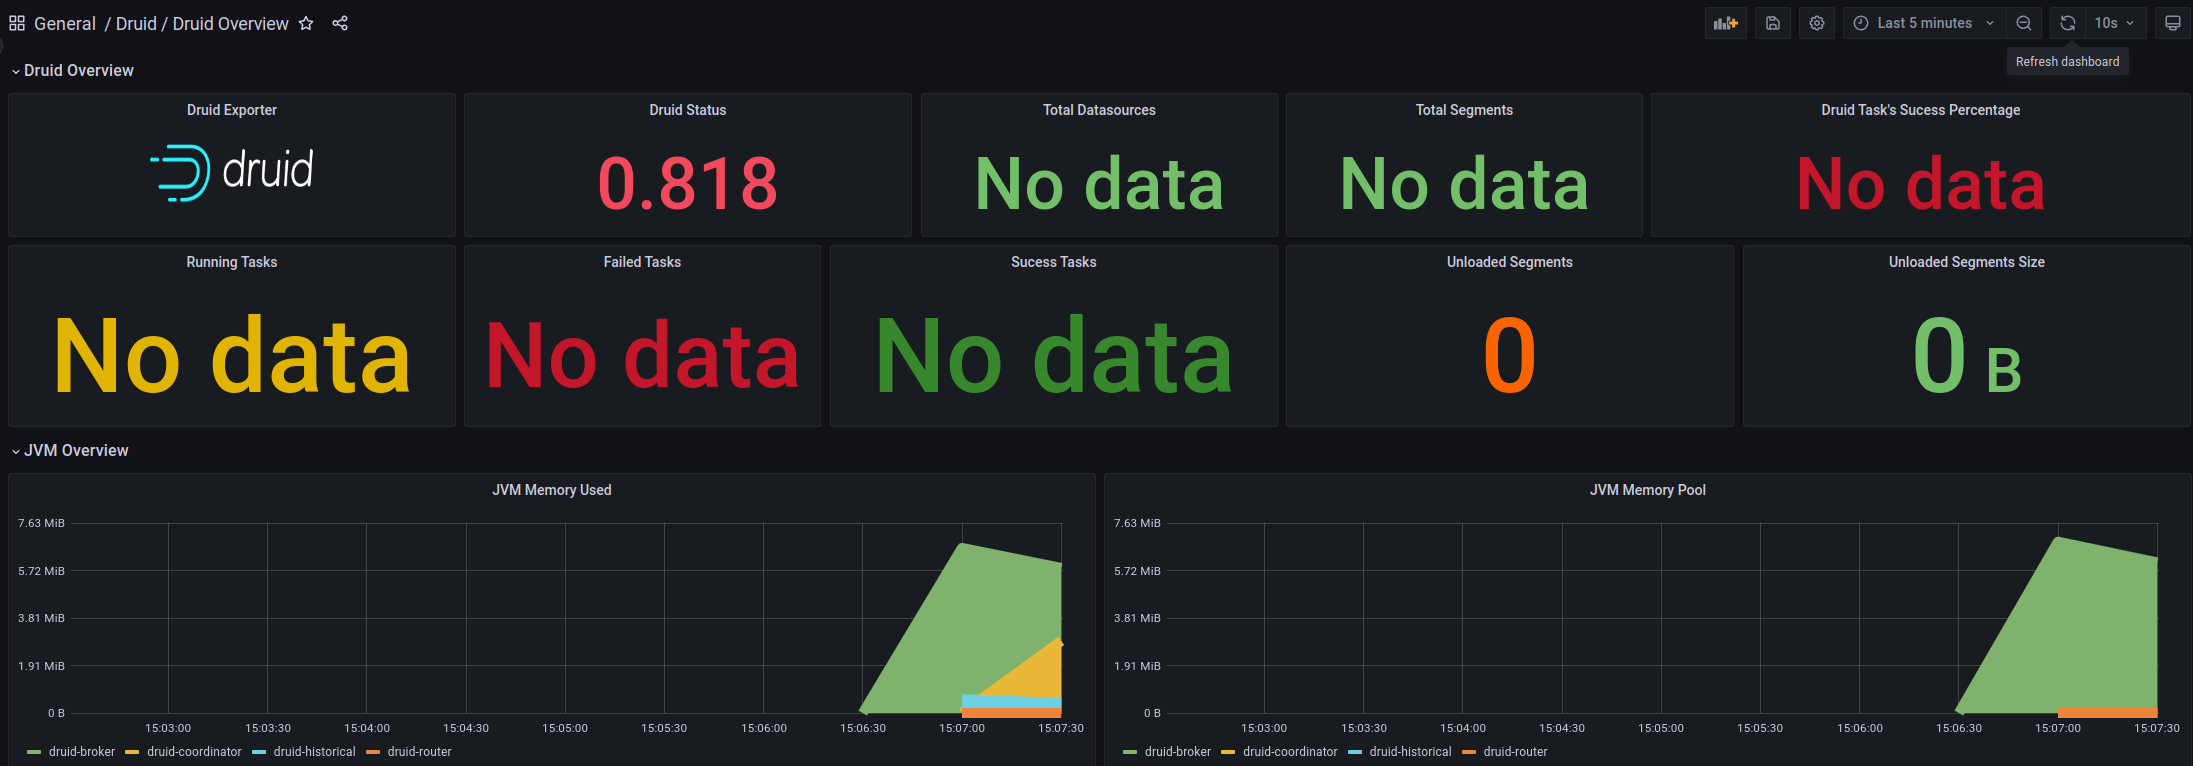
And a dashboard in Grafana:
Okay, we did it.
In Running/Failed Tasks, we still have No Data, since we didn’t run anything. If you load test data from the already mentioned video, then these metrics will appear.
There’s actually a lot more left:
- add PostgreSQL as Metadata store
- configure the collection of metrics from it
- test work without ZooKeeper (
druid-kubernetes-extensions) - test Prometheus Emitter
- try Indexer instead of Middle Manager
- configure the collection of logs (where? haven’t figured it out yet, but most likely Promtail && Loki)
- well, actually – to assemble a normal dashboard for Grafana
And already having monitoring, it will be possible to drive some load tests and play around with cluster performance tuning, but this is all in the next parts.
Related links
- How Netflix uses Druid for Real-time Insights to Ensure a High-Quality Experience
- Apache Druid (part 1): A Scalable Timeseries OLAP Database System
- Data Ingestion in Druid – Overview
- Learning about the Druid Architecture
- Druid Architecture & Concepts
- Event-Driven Data with Apache Druid
- Apache Druid: Setup, Monitoring and Auto Scaling on Kubernetes
- Apache Druid: Interactive Analytics at Scale
- Apache Druid (incubating) Configuration Reference
- Running Apache Druid in Kubernetes
- Setting up Apache Druid on Kubernetes in under 30 minutes
- Running Apache Druid in Kubernetes
![]()
