AWS VPC Flow Logs allow you to log traffic information between network interfaces in a VPC. Further, these logs can be stored in AWS S3 or sent to AWS CloudWatch Logs, while enabling traffic logging does not affect the performance of the network interface in any way.
Let’s briefly review the basic concepts, and available settings, and set up Flow Logs for VPC with data transfer for analysis to CloduWatch Logs.
Contents
VPC Flow Logs overview
Logs can be enabled for an entire VPC, for a subnet, or for an external surface. If enabled for the entire VPC – logging will be enabled for all interfaces of the VPC.
Services for which you can use Flow Logs:
- Elastic Load Balancing
- Amazon RDS
- Amazon ElastiCache
- Amazon Redshift
- Amazon WorkSpaces
- NAT gateways
- Transit gateways
The data is recorded as an flow log records, and uses a record with predefined fields.
VPC Flow Logs use cases
What can be tracked with Flow logs?
- SecuirtyGroup/Network Access List rules – blocked requests will be marked as REJECTED
- what we implement logs for us – to get a picture of the traffic between VPCs and services in order to understand who consumes the most traffic, where and how much cross-AZ traffic, and so on
- monitoring remote logins to the system – monitor ports 22 (SSH), 3389 (RDP)
- port scan tracking
Flow Log record – fields
Each entry in the log is data about the IP traffic received during the aggregation interval and is a line with fields separated by spaces, where each field contains information about the data transfer, for example – Source IP, Destination IP, and a protocol.
By default, the following format is used:
${version} ${account-id} ${interface-id} ${srcaddr} ${dstaddr} ${srcport} ${dstport} ${protocol} ${packets} ${bytes} ${start} ${end} ${action} ${log-status}
See the Available fields table in the documentation, everything in the Version 2 column is included in the default format.
When creating Flow Logs, we can use the default format, or create our own – we will consider it below:
VPC Flow Logs Limitations
- cannot be used with EC2-Classic instances
- you can’t create logs for VPC peerings if they lead to a different account’s VPC
- after creating a log – you can not change its configuration or format of records
Also, keep in mind that:
- records to Amazon DNS are not logged but are written if your own DNS is used
- traffic to and from address 169.254.169.254 to get EC2 instance metadata is not logged
- traffic between the EC2 network interface and AWS Network Load Balancer interface is not logged
See all limitations in Flow log limitations.
Create VPC Flow Log
To create a Flow Log, we need to specify:
- resource(s) whose logs we will write – VPC, subnet, or a specific network interface
- the type of traffic that we are logging (accepted traffic, rejected traffic, or all traffic)
- and where we will write the data – to the S3 bucket, or to the CloudWatch Logs
For now, let’s see what happens with CloudWatch Logs, and next time we’ll try to visualize in Kibana.
CloudWatch Logs Log Group
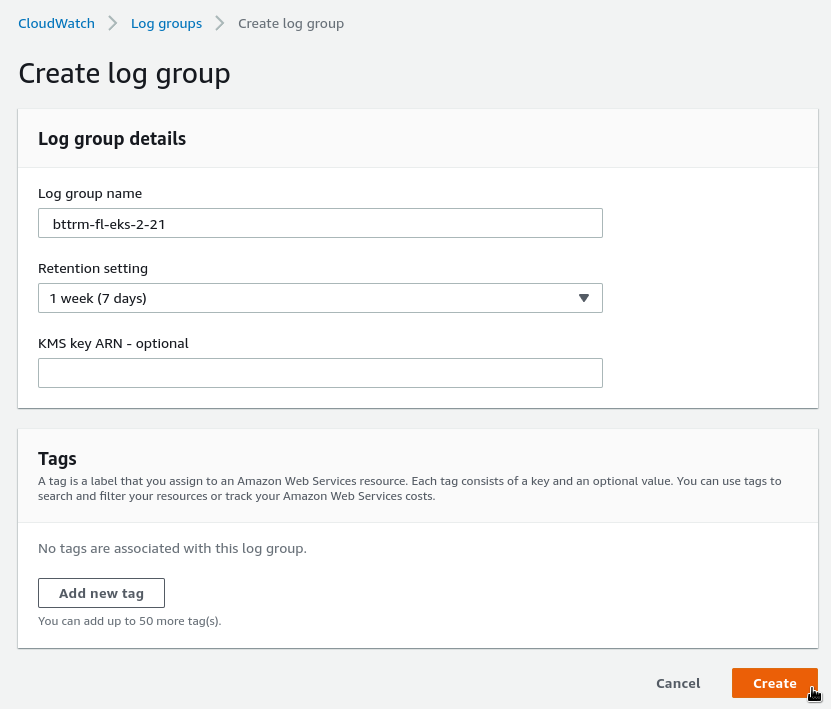
Create a Log Group:
IAM Policy and IAM Role
In order for the Flow Logs service to be able to write to our CloudWatch, we need to configure its access rights.
Go to the AWS IAM, and create an IAM Policy and an IAM Role.
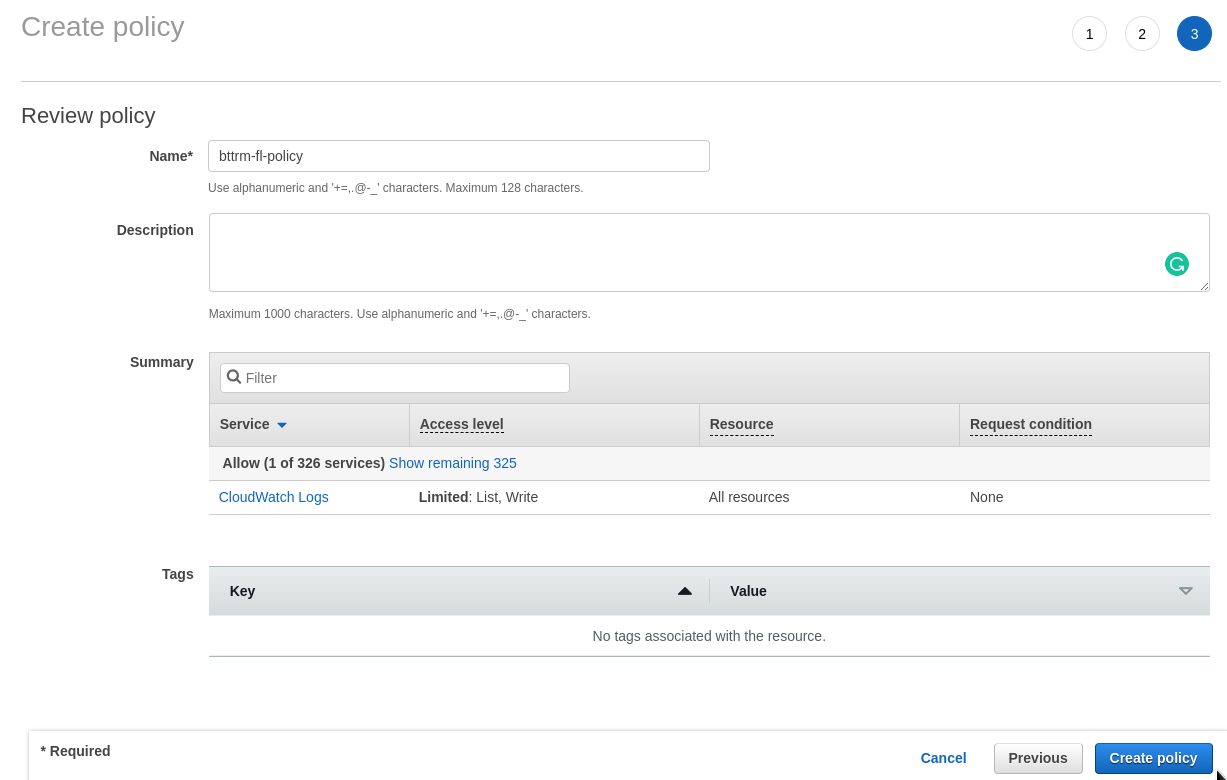
Start with an IAM Policy:
Add the rules:
{
  "Version": "2012-10-17",
  "Statement": [
    {
      "Action": [
        "logs:CreateLogGroup",
        "logs:CreateLogStream",
        "logs:PutLogEvents",
        "logs:DescribeLogGroups",
        "logs:DescribeLogStreams"
      ],
      "Effect": "Allow",
      "Resource": "*"
    }
  ]
}
Save:
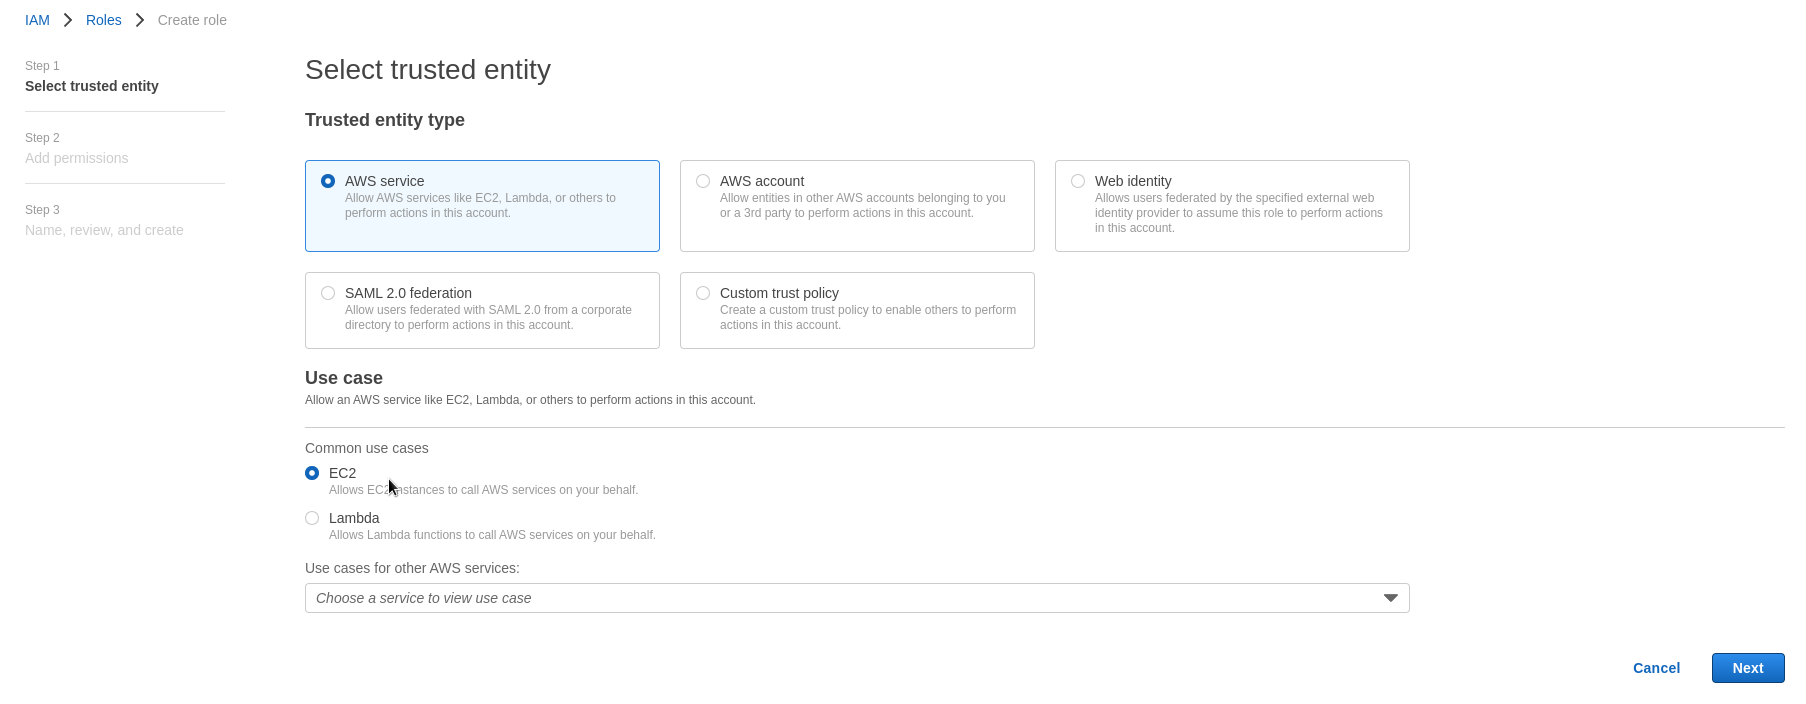
Now, create an IAM Role.
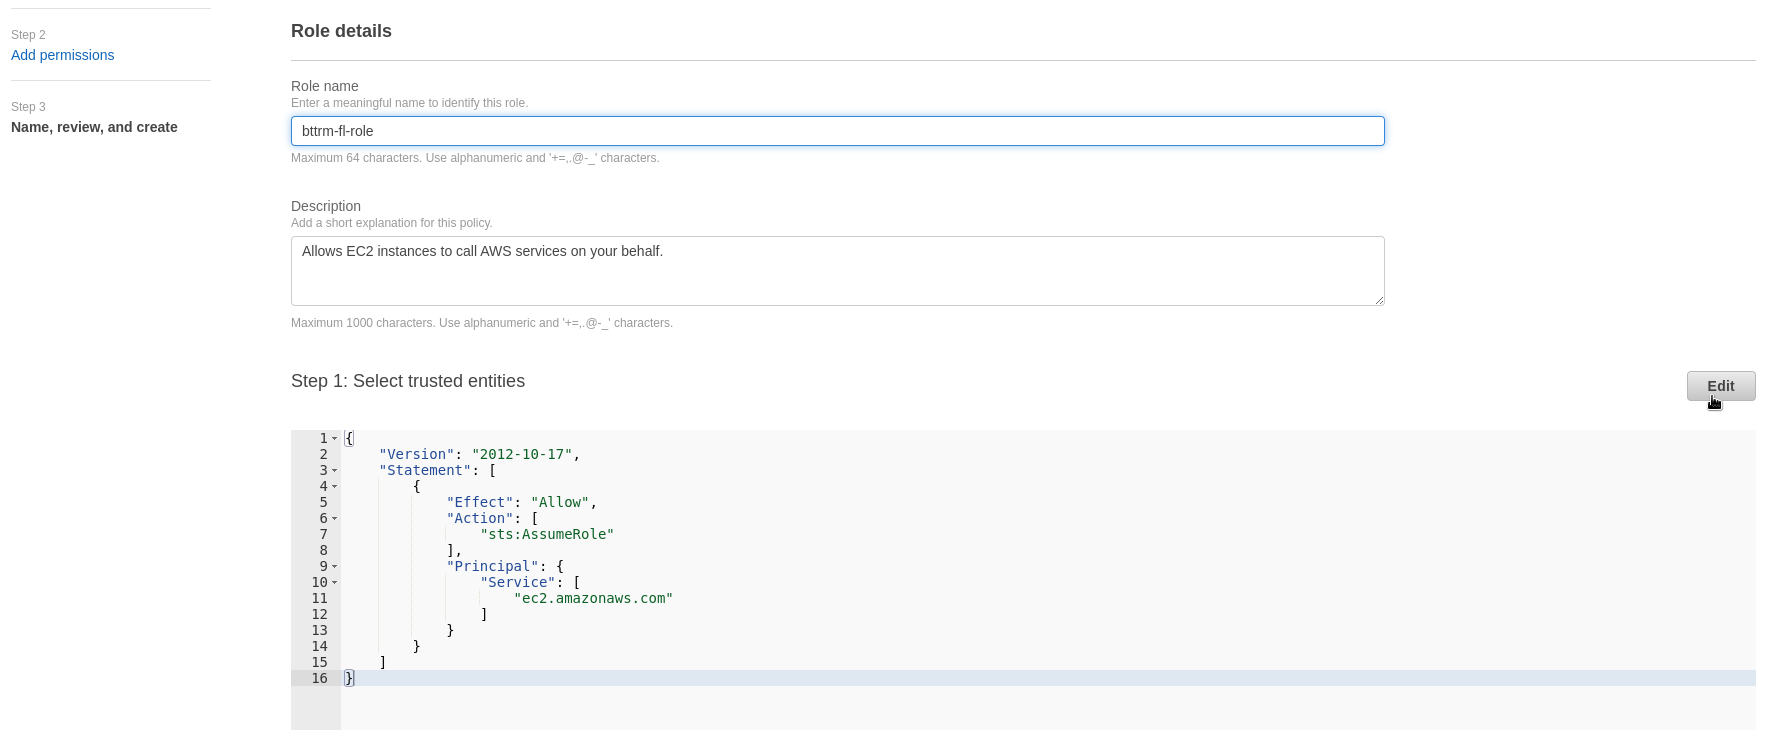
Go to the IAM Roles, create a new one, type of EC2:
Find the policy, we’ve created above, and attach it:
Set its name, save:
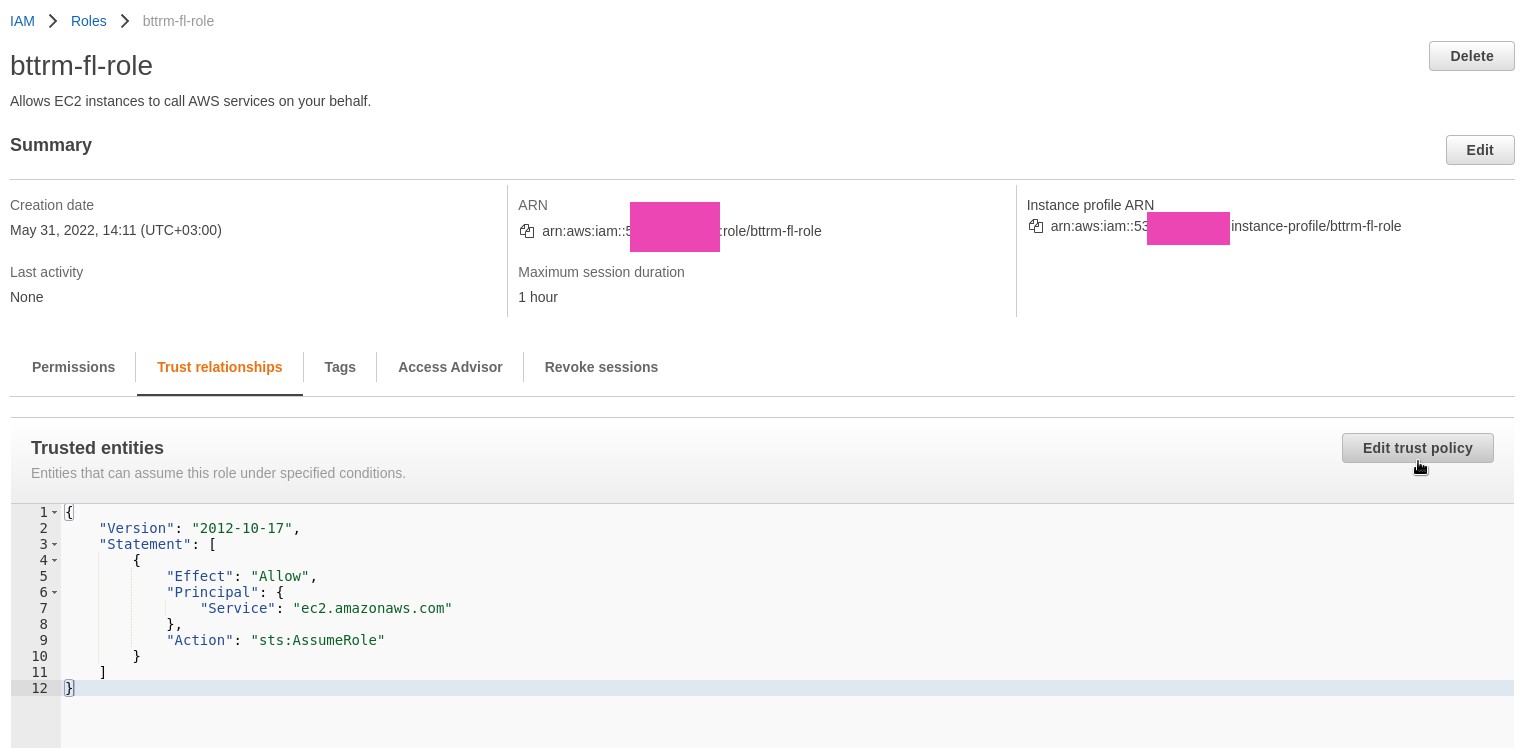
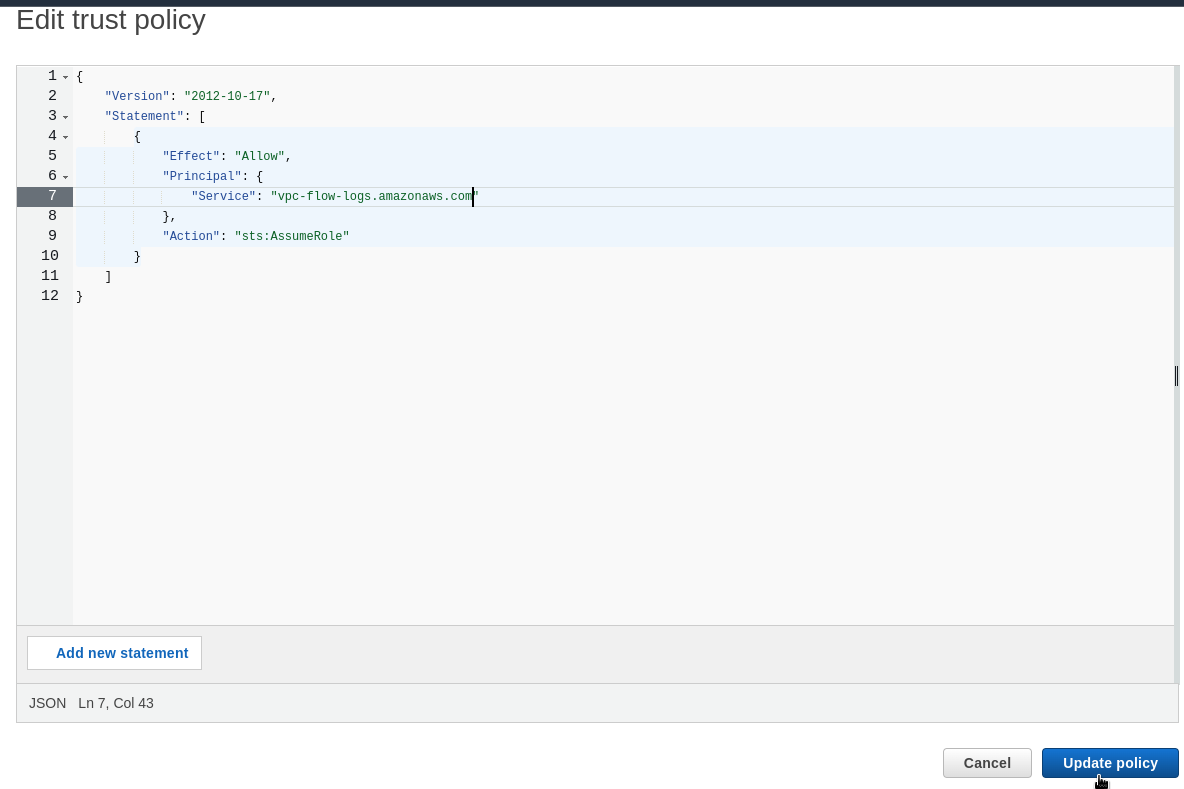
Go to the Role Trust relationship (see AWS: IAM AssumeRole – описание, примеры), edit it – for the Service field set the vpc-flow-logs.amazonaws.com:
Set:
{
  "Version": "2012-10-17",
  "Statement": [
    {
      "Sid": "",
      "Effect": "Allow",
      "Principal": {
        "Service": "vpc-flow-logs.amazonaws.com"
      },
      "Action": "sts:AssumeRole"
    }
  ]
}
Save:
VPC – enabling Flow Logs
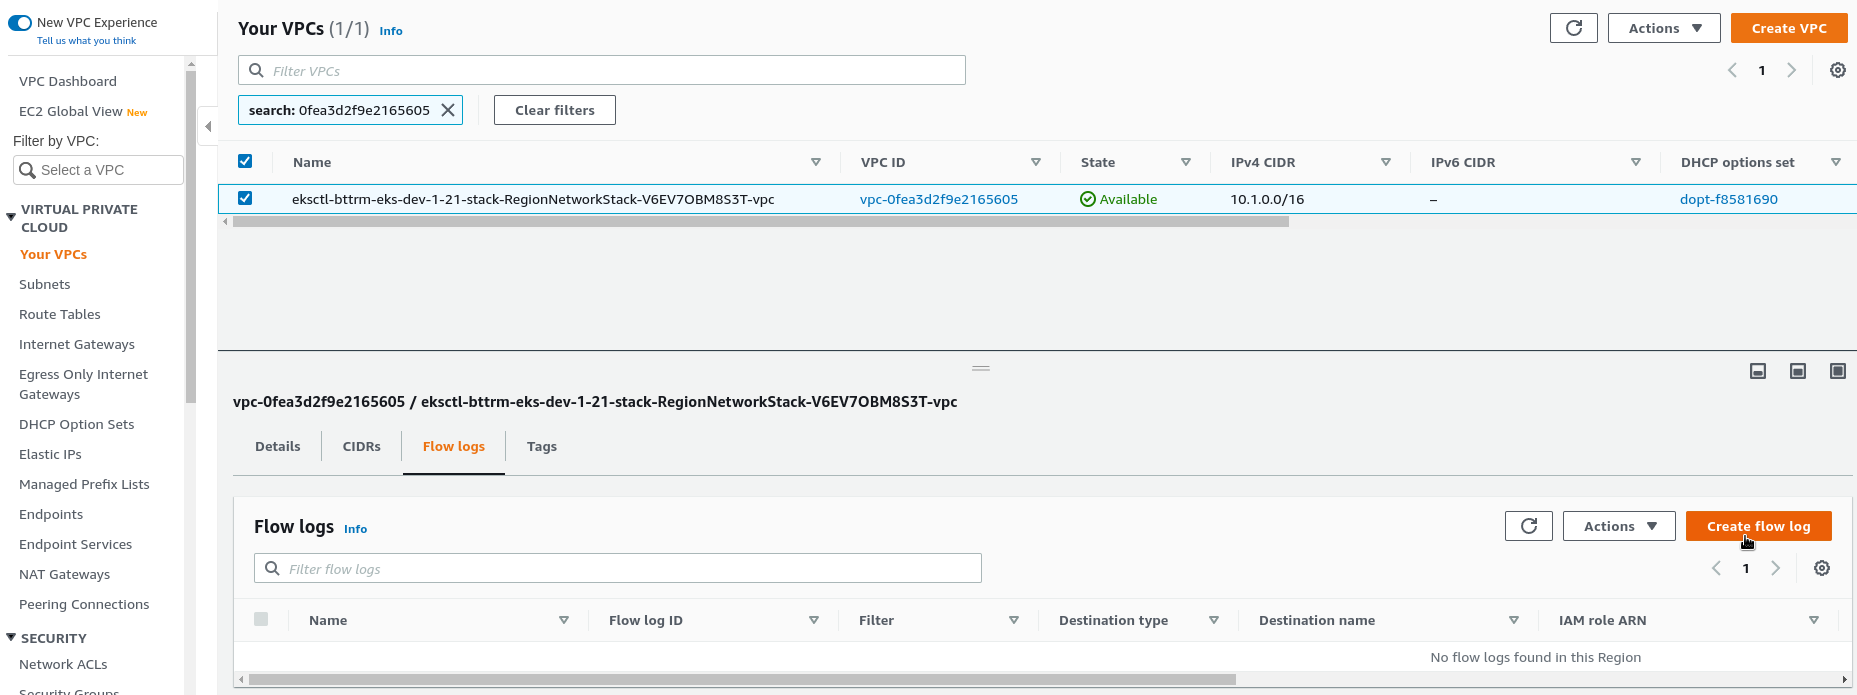
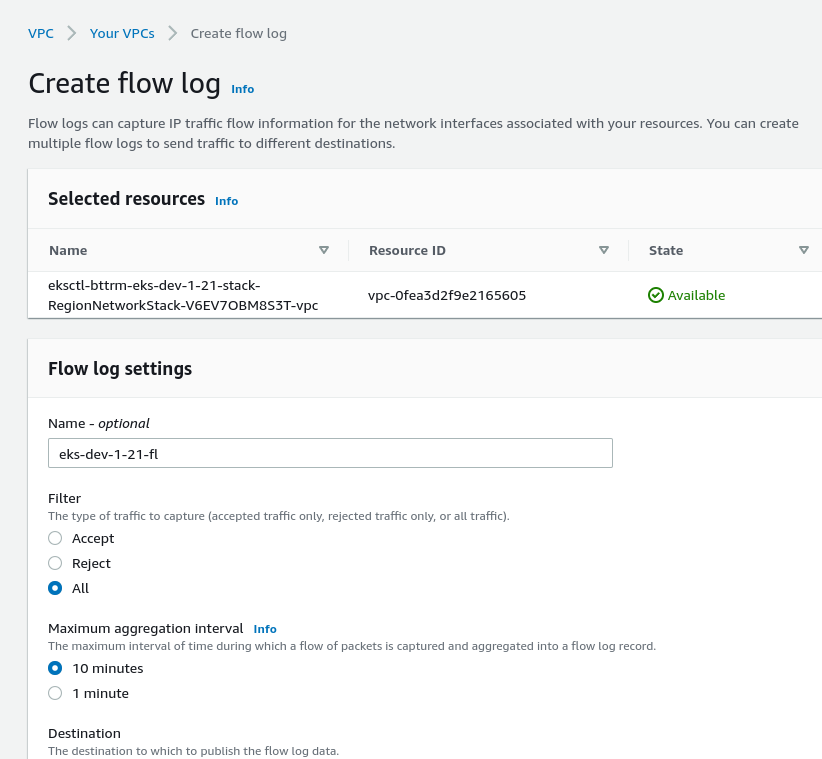
And finally, go to a VPC to enable Logs – click on the Flow Logs > Create:
Set its name, Filter, Interval:
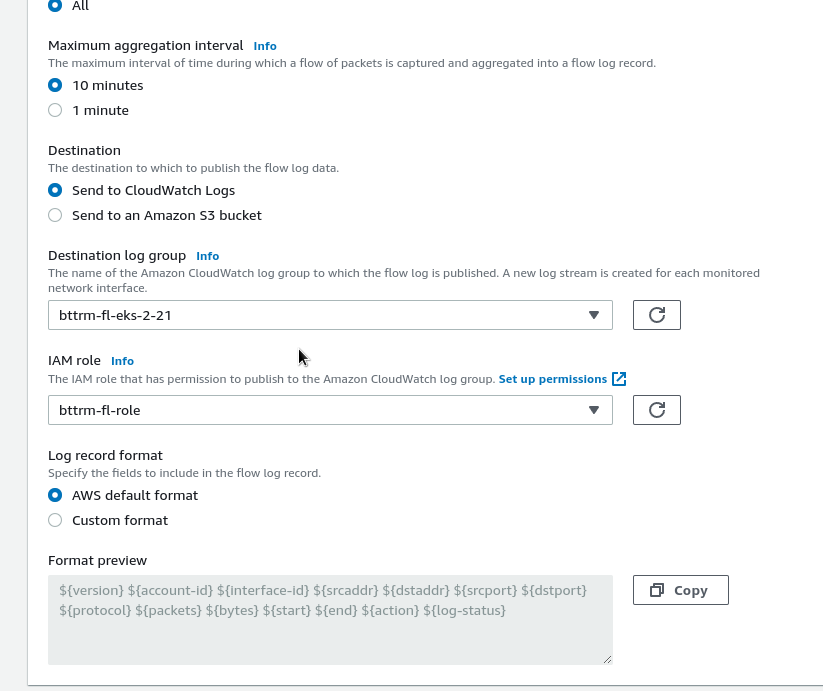
In the Destination chose CloudWatch Logs, specify the Log Group and IAM Role:
Format – leave Default.
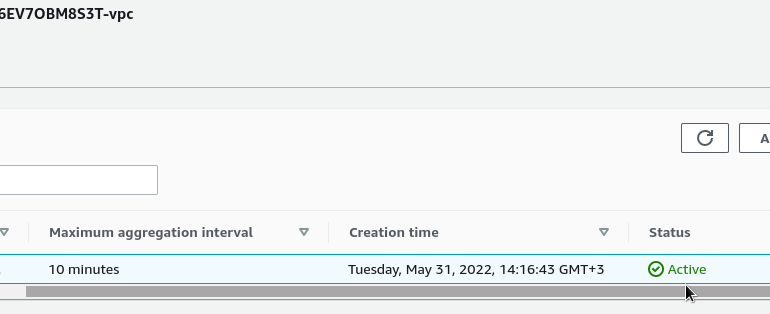
Check the Status:
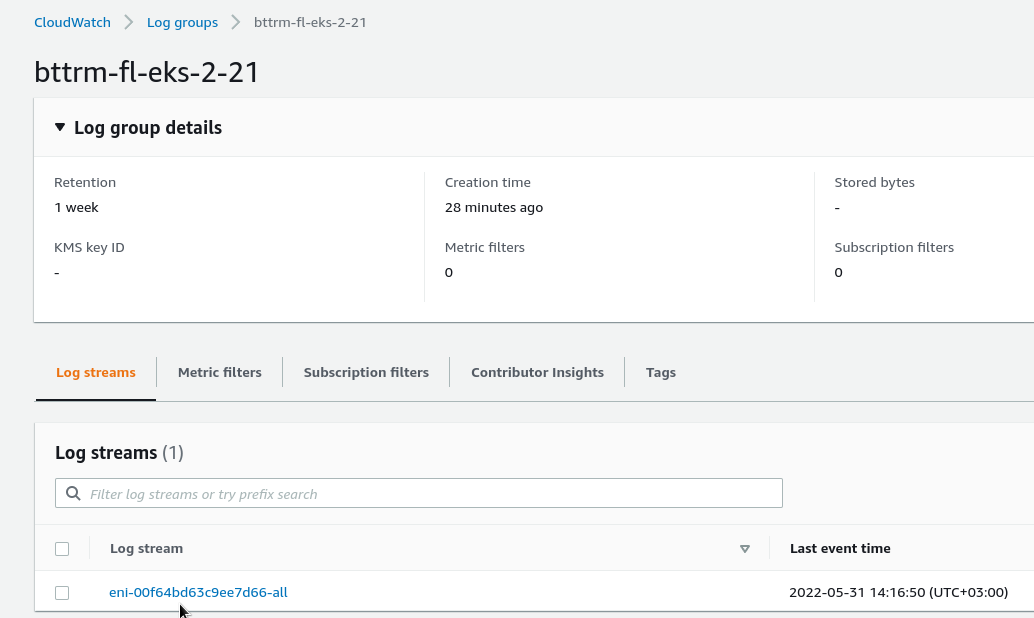
And in a couple of minutes we’ll see our data:
In the Log Group you can find a first stream named by an Elastic Network Interface, from where the data is taken:
CloudWatch Logs Insights
Let’s take a quick look at the CloudWatch Logs Insights.
Click on the Queries to get some hints:
For example, to find top-15 of hosts, that served most of the packets:
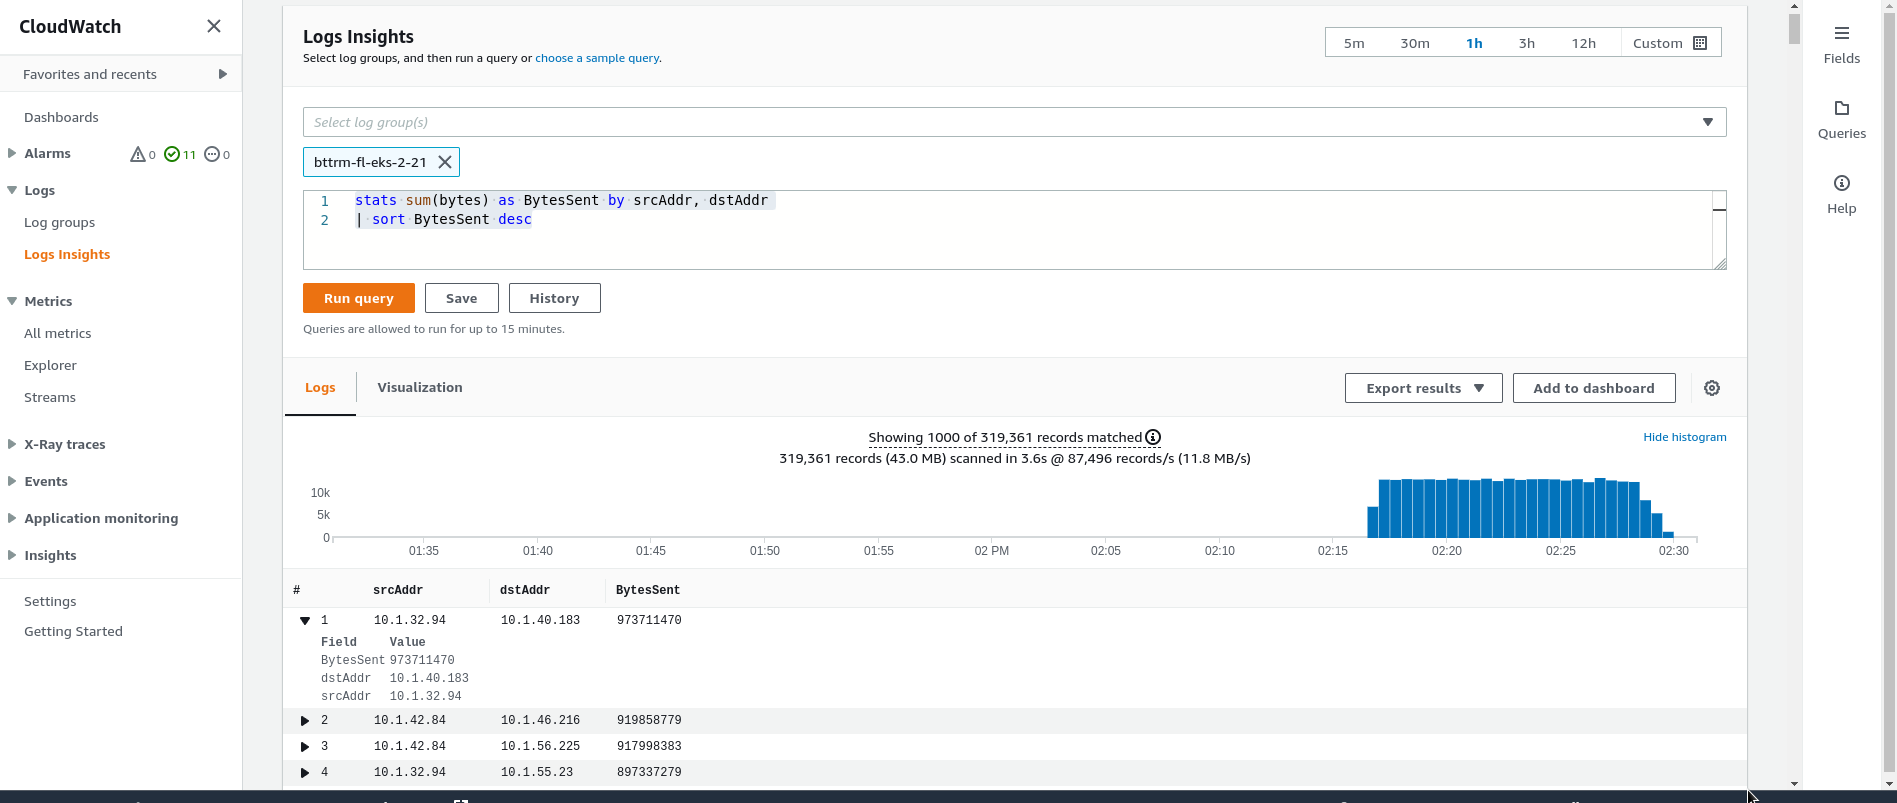
Or by volume of data transferred:
stats sum(bytes) as BytesSent by srcAddr, dstAddr
| sort BytesSent desc
Okay, that’s good. But what about other forms?
For example, I’d like to see a requests direction (egress/ingress), and a value of the pkt-dstaddr field.
VPC Flow Log – Custom format
See more on the Flow log record examples.
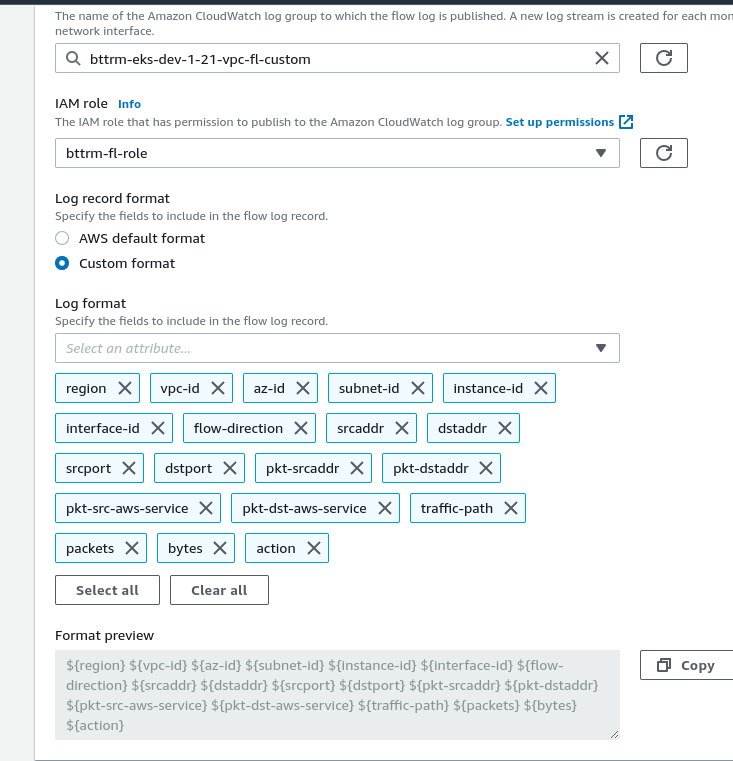
For now, we can set the following format:
region vpc-id az-id subnet-id instance-id interface-id flow-direction srcaddr dstaddr srcport dstport pkt-srcaddr pkt-dstaddr pkt-src-aws-service pkt-dst-aws-service traffic-path packets bytes action
In the CloudWatch Logs create a new Log group, call it bttrm-eks-dev-1-21-vpc-fl-custom, don’t forget about retention: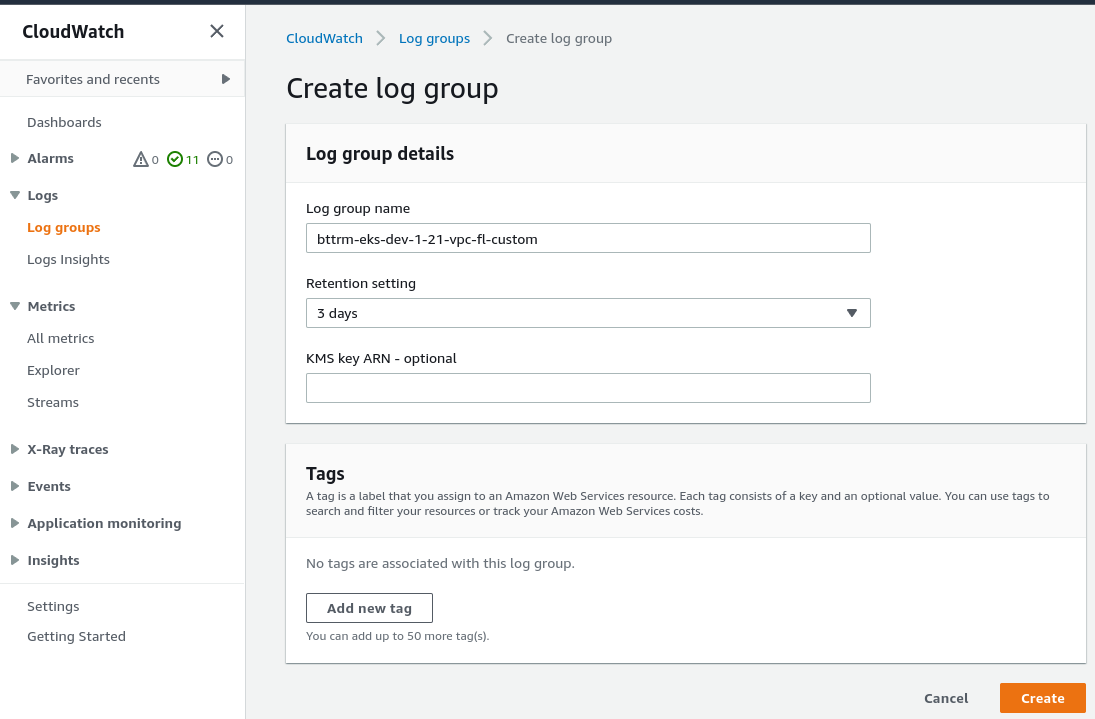
Go back to the VPC, create a new Flow Log, and call it bttrm-eks-dev-1-21-vpc-fl-custom:
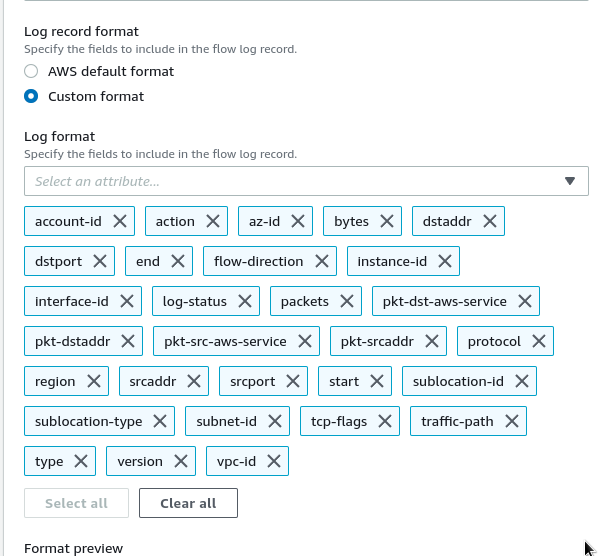
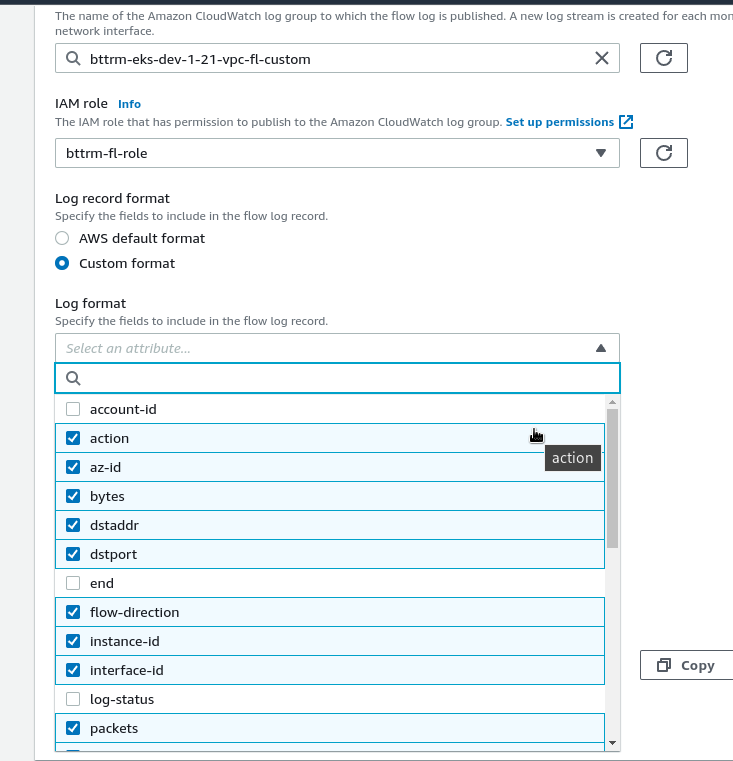
Chose the Custom Format and fields, which we’d like to see. In doing so, take into account that the order of fields you’ll specify here will be used to order records in the log.
I.e. if the first field will be “region” – then in the final log it also will be set as the first field:
And the result:
${region} ${vpc-id} ${az-id} ${subnet-id} ${instance-id} ${interface-id} ${flow-direction} ${srcaddr} ${dstaddr} ${srcport} ${dstport} ${pkt-srcaddr} ${pkt-dstaddr} ${pkt-src-aws-service} ${pkt-dst-aws-service} ${traffic-path} ${packets} ${bytes} ${action}
Flow Log Custom format, and CloudWatch Logs Insights
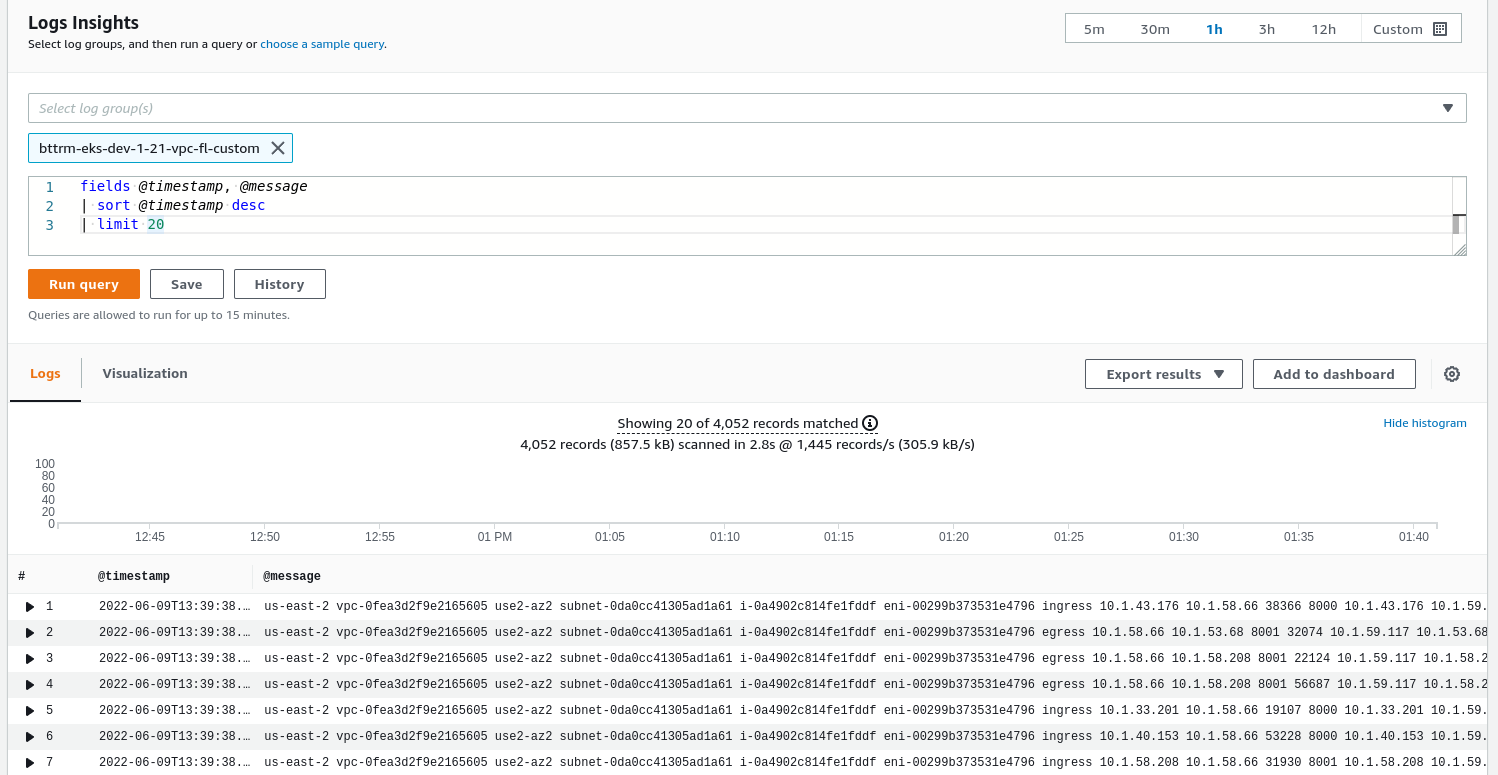
But if we will go to the CloudWatch Logs Insights now, and will try any query used before, we will not get the fields, that we’ve set
So, we can see the data, but how can we split it into the fields?
In our project, I don’t think we will use CloudWatch Logs a lot, most likely data will be sent to an S3 bucket, and then to the (logz.io), therefore, I will not go deep here in detail, but let’s see the principle of operation – it will come in handy later for working with ELK.
CloudWatch Logs by default creates several meta fields that we can use in requests:
@message: the “raw” data – the whole message in the text@timestamp: the time of the event@logStream: a sLog stream name
For the Custom format to see the fields, we need to use the parse and pass the @message to it, so it will parse the content by the fields we specified:
parse @message "* * * * * * * * * * * * * * * * * * *"
| as region, vpc_id, az_id, subnet_id, instance_id, interface_id,
| flow_direction, srcaddr, dstaddr, srcport, dstport,
| pkt_srcaddr, pkt_dstaddr, pkt_src_aws_service, pkt_dst_aws_service,
| traffic_path, packets, bytes, action
| sort start desc
Here, the number of asterisks “*” in the @message must be the same, as many fields we set – ${vpc-id} и т.д.
Also, the names of the fields must contain no dashes. I.e. the ${vpc-id} name we need to eat as vpc_id (or vpcID – as you like).
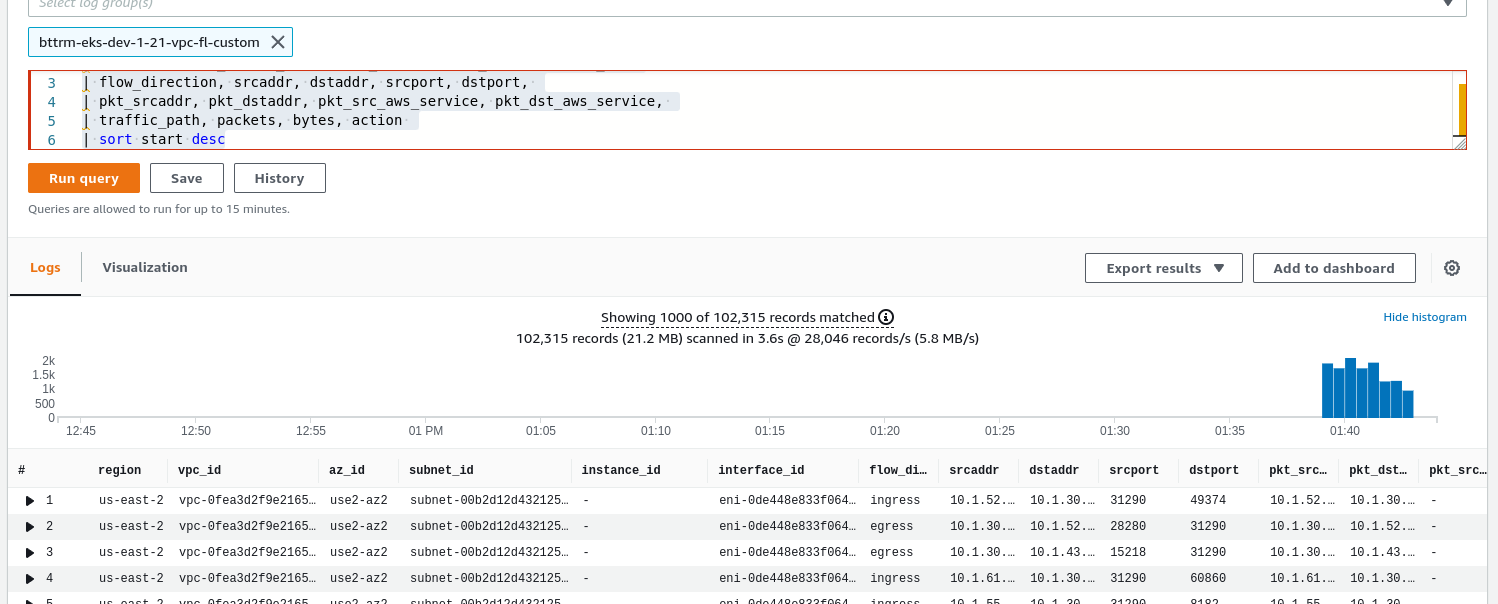
Check:
Wow! Now, we got all our fields.
Beside of the parse, we can use filter, display, stats. See all in the CloudWatch Logs Insights query syntax.
Logs Insights examples
And let’s try to make a couple of queries, for example – to get all requests that were blocked by a SecuirtyGroup/Network Access List – they’ll be marked as REJECTED.
Let’s take our previous query:
parse @message "* * * * * * * * * * * * * * * * * * * * * *"
| as start, end, region, vpc_id, az_id, subnet_id, instance_id, interface_id,
| flow_direction, srcaddr, dstaddr, srcport, dstport, protocol,
| pkt_srcaddr, pkt_dstaddr, pkt_src_aws_service, pkt_dst_aws_service,
| traffic_path, packets, bytes, action
And add there:
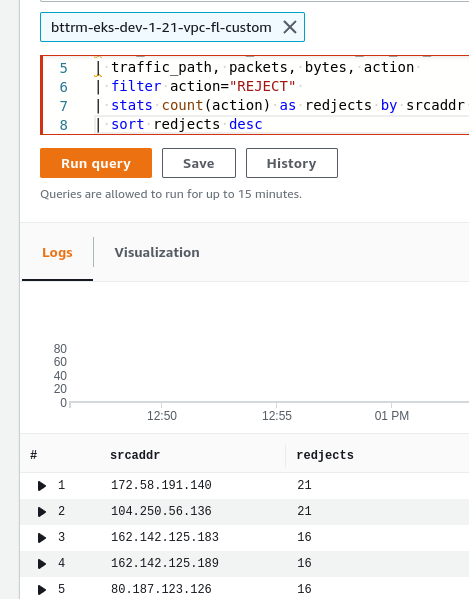
filter action="REJECT"stats count(action) as redjects by srcaddrsort redjects desc
here:
- filter by an action applied to the packet – select all REJECTED
- count number of events by the action filed, selecting by an IP address of the source, and display it in the redjects column
- and sort by the redjects
So, the full query now will be:
parse @message "* * * * * * * * * * * * * * * * * * *"
| as region, vpc_id, az_id, subnet_id, instance_id, interface_id,
| flow_direction, srcaddr, dstaddr, srcport, dstport,
| pkt_srcaddr, pkt_dstaddr, pkt_src_aws_service, pkt_dst_aws_service,
| traffic_path, packets, bytes, action
| filter action="REJECT"
| stats count(action) as redjects by srcaddr
| sort redjects desc
And its result:
We also can use negative filters and combine the with the and/or operators.
For example, to remove from the output all IPs starting with the 162.142.125 – add a filter filter (srcaddr not like "162.142.125."):
...
| filter action="REJECT"
| filter (srcaddr not like "162.142.125.")
| stats count(action) as redjects by srcaddr
| sort redjects desc
See the Sample queries.
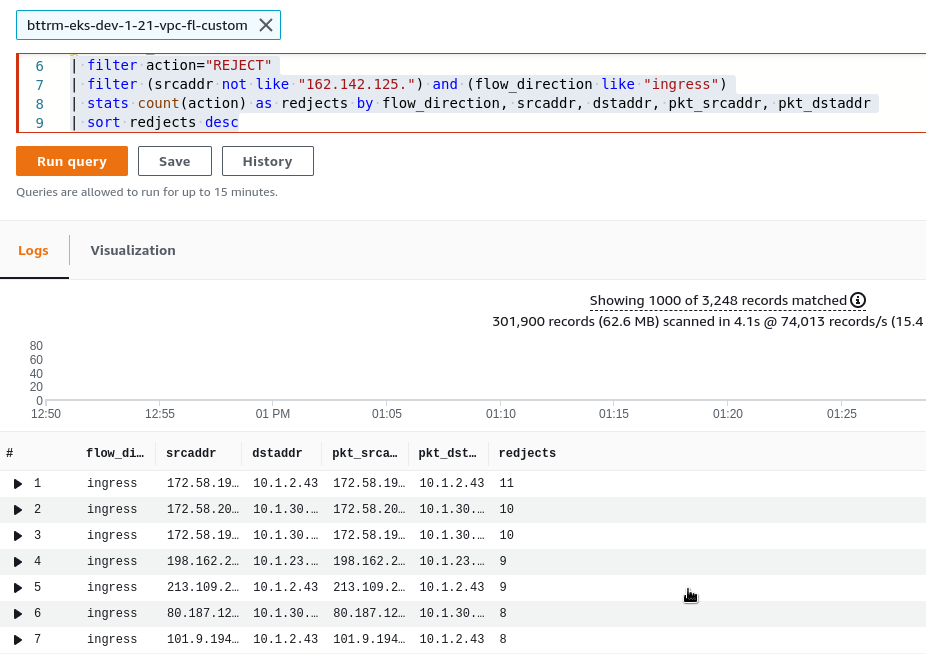
And add a filter to select only incoming requests – flow_direction == ingress:
...
| filter action="REJECT"
| filter (srcaddr not like "162.142.125.") and (flow_direction like "ingress")
| stats count(action) as redjects by flow_direction, srcaddr, dstaddr, pkt_srcaddr, pkt_dstaddr
| sort redjects desc
Now, we got the top of rejected requests, when a SecurityGroup or VPC Network Access List rule worked.
And let’s check what is the IP in the dstaddr – who was the final destination?
Go to the EC2 > Network Interfaces, find by the Private IP:
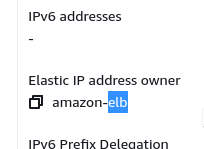
Find the “Elastic IP address owner“:
OK, it’s one of the Load Balancers.
If an IP can’t be found in the AWS, it could be a Kubernetes Endpoint, check it with the:
[simterm]
$ kubectl get endpoints --all-namespaces | grep 10.1.55.140
dev-ios-check-translation-ns                     ios-check-translation-backend-svc                    10.1.55.140:3000                                                     58d
dev-ios-check-translation-ns                     ios-check-translation-frontend-svc                   10.1.55.140:80                                                       58d
[/simterm]
Actually, that’s all.
Useful links
VPC Flow Logs
- Collect Amazon VPC flow logs with Elastic Agent – поля и прочее для Кибаны.
- Flow log record examples
CloudWatch Logs
- AWS Security Logging Fundamentals – VPC Flow Logs – пример Cloudwatch Logs с Athena
- Analyze Query And Visualize AWS Cloudwatch Logs Using Logs Insight – прмиеры запросов в Cloudwatch Logs
- How to Visualize and Refine Your Network’s Security by Adding Security Group IDs to Your VPC Flow Logs
- Visualizing log data in graphs
- Analyze CloudWatch Logs like a pro
- Filter, Parse & Group Log Data in AWS CloudWatch Logs Insights
- How can I analyze custom VPC Flow Logs using CloudWatch Logs Insights? – ещё примеры с логами и выборками в Инсайтах
- How can I use CloudWatch Logs Insights queries with my VPC flow log?
- CloudWatch Logs Insights query syntax
- Triaging Networking Issues Using AWS CloudWatch Logs Insights
![]()
