 The last time I’ve worked with the ELK stack about 7 years ago, see the ELK: установка Elasticsearch+Logstash+Kibana на CentOS.
Currently, we are using Logz.io, but its costs going higher and higher, so we started looking at the self-hosted ELK solution to be running on our AWS Elastic Kubernetes Service clusters.
So, the task, for now, is to spin up the Elastic Stack, check how it can be installed on Ubuntu 20.04, configure logs collection using Filebeat, their transformation with Logstash, save to Elasticsearch database, display with Kibana, and see how all those components are working together under the hood.
The main goal is to check their configuration and to see how they all are working together. This will be “like a production setup”, so we will not check some Kinaa settings like users authentification, but instead we’ll take a look on grok, Elasticsearch indexes, and so on.
Still, as usual, I’ll add some links at the end of the post.
And remember: “10 hours of debugging and trying to make and see how it’s working will save you 10 minutes of reading documentation”.
Contents
Elastic Stack: components overview
Elastic Stack, previously known as ELK (Elasticsearch + Logstash + Kibana) is one of the most well-known and widely used system for logs collection and aggregation. Also, it can be used to display metrics from services – clouds, servers, etc.
Elastic Stack consists of three main components::
- Elasticsearch: a database with quick search features using Elasticsearch Index
- Logstash: a tool to collect data from various sources, their transformation, and passing data to the Elasticsearch
- Kibana: a web interface to display data from Elasticsearch
Also, for ELK is a set of additional tools called Beats used to collect data. Among them, worth to mention for example Filebeat to collect logs, and Metricbeat, which is used to collect information about CPU, memory, disks, etc. See also Logz.io: collection logs from Kubernetes – fluentd vs filebeat.
So, the workflow of the stack is the following:
- a server generates data, for example, logs
- the data is then collected by a local Beat-application, for logs, this will be Filebeat (although this is not mandatory, and logs can be collected by Logstash itself), and then sends the data to Logstash or directly to an Elastisearch database
- Logstash collects data from various sources (from Beats, or by collecting data directly), makes necessary transformations like adding/removing fields, and then passes the data to an Elastisearch database
- Elasticsearch is used to store the data and for quick search
- Kibana is used to display data from the Elastisearch database with a web interface

Create an AWS ЕС2
So, let’s go ahead with the installation process.
Will use Ubuntu 20.04, running on AWS EC2 instance.
Will use a “clear” system – without any Docker or Kubernetes integrations, everything will be done directly on the host.
The scheme used will be usual for the stack: Elasticsearch to store data, Filebeat to collect data from logs, Logstash for processing and pushing data to an Elastic index, and Kibana for visualization.
Go to the AWS Console > EC2 > Instances, createа a new one, choose Ubuntu OS:
Let’s choose the c5.2xlarge instance type – 4 vCPU, 9 GB RAM, as Elasticsaerch is working on Java that loves memory and CPU, and Logstash is written in JRuby:
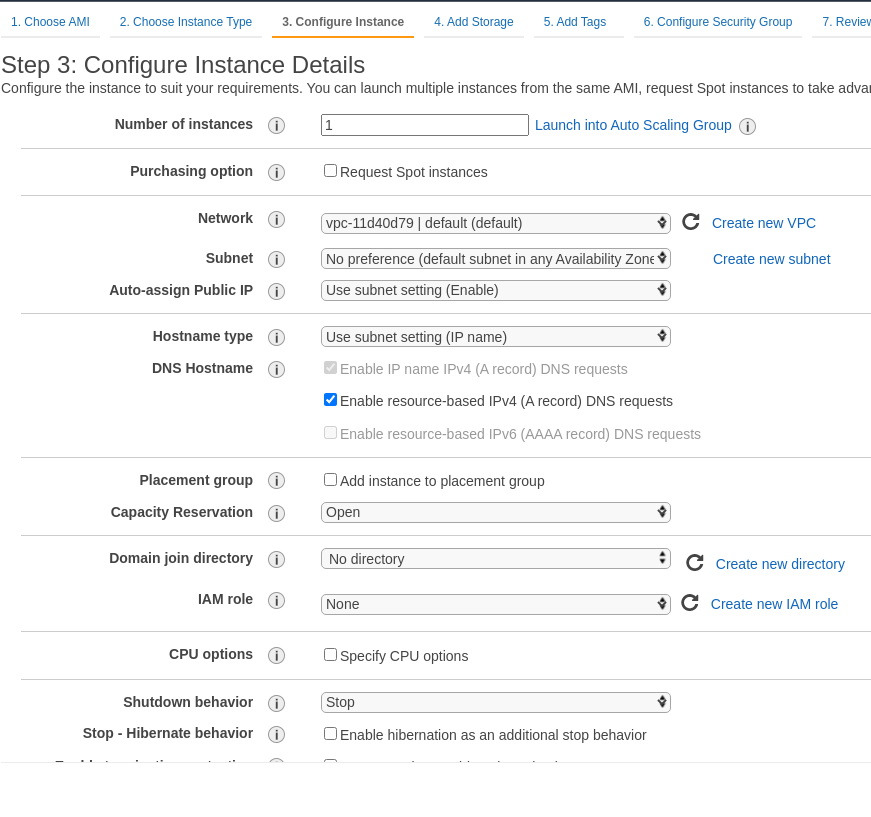
Network settings can be left with the default settings, as again this is kind of Proof of Concept, so no need to dive deep in there:
Later, we will add an Elastic IP.
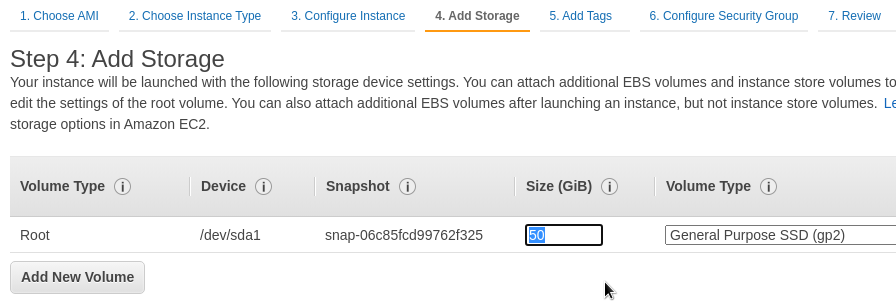
Increase the disk size for the instance up to 50 GB:
In the SecurityGroup open SSH and port 5601 (Kibana) from your IP:
In a more production-like setup, we will Вhave to have some NGINX or an Ingress resource before our Kibana with SSL. For now, run it “as is”.
Create a new RSA key pair (hint: it’s a good idea to include a key’s AWS Region to its name), save it:
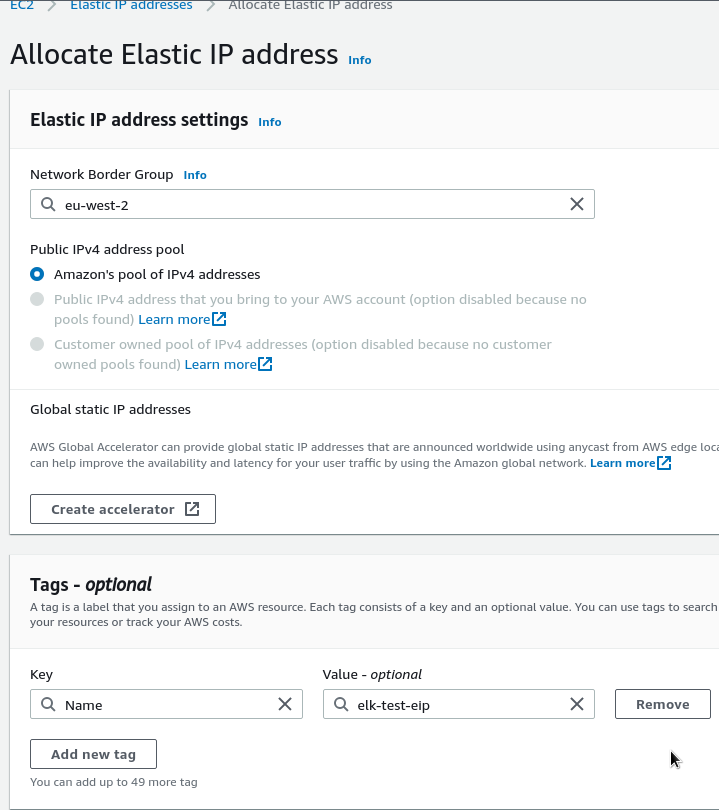
Go to the Elastic IP addresses, obtain a new EIP:
Attach it to the EC2 instance:
On your workstation, change the key’s permissions to make it readable for your user only:
[simterm]
$ chmod 600 ~/Temp/elk-test-eu-west-2.pem
[/simterm]
Check connection:
[simterm]
$ ssh -i ~/Temp/elk-test-eu-west-2.pem [email protected]
...
ubuntu@ip-172-31-43-4:~$
[/simterm]
Upgrade the system:
[simterm]
ubuntu@ip-172-31-43-4:~$ sudo -s
root@ip-172-31-43-4:/home/ubuntu# apt update && apt -y upgrade
[/simterm]
Reboot it to load a new kernel after upgrade:
[simterm]
root@ip-172-31-43-4:/home/ubuntu# reboot
[/simterm]
And go to the ELK components installation.
Elastic Stack/ELK installation on Ubuntu 20.04
Add an Elasticsearch repository:
[simterm]
root@ip-172-31-43-4:/home/ubuntu# wget -qO - https://artifacts.elastic.co/GPG-KEY-elasticsearch | sudo apt-key add -
OK
root@ip-172-31-43-4:/home/ubuntu# apt -y install apt-transport-https
root@ip-172-31-43-4:/home/ubuntu# sh -c 'echo "deb https://artifacts.elastic.co/packages/7.x/apt stable main" > /etc/apt/sources.list.d/elastic-7.x.list'
[/simterm]
Elasticsearch installation
Install the elasticsearch package:
[simterm]
root@ip-172-31-43-4:/home/ubuntu# apt update && apt -y install elasticsearch
[/simterm]
Elastic’s configuration file – /etc/elasticsearch/elasticsearch.yml.
Add to it a new parameter – discovery.type: single-node, as our Elasticsearch will be working as a single node, not as a cluster.
In case of necessity to update JVM options – use the /etc/elasticsearch/jvm.options.
Users and authentification described in the Set up minimal security for Elasticsearch, but for now we will skip the step – for testing, it’s enough that we’ve set limitations in the AWS SecurityGroup of the EC2.
Start the service, add it to the autostart:
[simterm]
root@ip-172-31-43-4:/home/ubuntu# systemctl start elasticsearch
root@ip-172-31-43-4:/home/ubuntu# systemctl enable elasticsearch
[/simterm]
Check access to the Elasticseacrh API:
[simterm]
root@ip-172-31-43-4:/home/ubuntu# curl -X GET "localhost:9200"
{
  "name" : "ip-172-31-43-4",
  "cluster_name" : "elasticsearch",
  "cluster_uuid" : "8kVCdVRySfKutRjPkkVr5w",
  "version" : {
    "number" : "7.16.3",
    "build_flavor" : "default",
    "build_type" : "deb",
    "build_hash" : "4e6e4eab2297e949ec994e688dad46290d018022",
    "build_date" : "2022-01-06T23:43:02.825887787Z",
    "build_snapshot" : false,
    "lucene_version" : "8.10.1",
    "minimum_wire_compatibility_version" : "6.8.0",
    "minimum_index_compatibility_version" : "6.0.0-beta1"
  },
  "tagline" : "You Know, for Search"
}
[/simterm]
Logs are available in the /var/log/elasticsearch, and data is stored in the /var/lib/elasticsearch directory.
Elasticsearch Index
Let’s take a short overview of the indices in the Elastiseacrh, and how to access them via API.
In fact, you can think about them as databases in RDBMS systems like MySQL. The database stores documents and these documents are JSON-object of a specific type.
Indices are divided into shards – segments of the data, that are stored on one or more Elastisearch Nodes, but sharding and clustering are out of the scope of this post.
View an Index
To see all indexes, use the GET _cat/indices?v request:
[simterm]
root@ip-172-31-43-4:/home/ubuntu# curl localhost:9200/_cat/indices?v
health status index            uuid                   pri rep docs.count docs.deleted store.size pri.store.size
green  open   .geoip_databases 2E8sIYX0RaiqyZWzPHYHfQ   1   0         42            0     40.4mb         40.4mb
[/simterm]
For now, we can see only Elastic’s own index called .geoip_databases, which contains a list of IP blocks and related regions. Later, it can be used to add a visitor’s information to an NGINX access log’s data.
Create an Index
Add a new empty index:
[simterm]
root@ip-172-31-43-4:/home/ubuntu# curl -X PUT localhost:9200/example_index?pretty
{
  "acknowledged" : true,
  "shards_acknowledged" : true,
  "index" : "example_index"
}
[/simterm]
Check it:
[simterm]
root@ip-172-31-43-4:/home/ubuntu# curl localhost:9200/_cat/indices?v
health status index            uuid                   pri rep docs.count docs.deleted store.size pri.store.size
green  open   .geoip_databases 2E8sIYX0RaiqyZWzPHYHfQ   1   0         42            0     40.4mb         40.4mb
yellow open   example_index    akWscE7MQKy_fceS9ZMGGA   1   1          0            0       226b           226b
[/simterm]
example_index – here is our new index.
And check the index itself:
[simterm]
root@ip-172-31-43-4:/home/ubuntu# curl localhost:9200/example_index?pretty
{
  "example_index" : {
    "aliases" : { },
    "mappings" : { },
    "settings" : {
      "index" : {
        "routing" : {
          "allocation" : {
            "include" : {
              "_tier_preference" : "data_content"
            }
          }
        },
        "number_of_shards" : "1",
        "provided_name" : "example_index",
        "creation_date" : "1642848658111",
        "number_of_replicas" : "1",
        "uuid" : "akWscE7MQKy_fceS9ZMGGA",
        "version" : {
          "created" : "7160399"
        }
      }
    }
  }
}
[/simterm]
Create a document in an index
Let’s add a simple document to the index, created above:
[simterm]
root@ip-172-31-43-4:/home/ubuntu# curl -H 'Content-Type: application/json' -X POST localhost:9200/example_index/document1?pretty -d '{ "name": "Just an example doc" }'
{
  "_index" : "example_index",
  "_type" : "document1",
  "_id" : "rhF0gX4Bbs_W8ADHlfFY",
  "_version" : 1,
  "result" : "created",
  "_shards" : {
    "total" : 2,
    "successful" : 1,
    "failed" : 0
  },
  "_seq_no" : 2,
  "_primary_term" : 1
}
[/simterm]
And check all content of the index using the _search operation:
[simterm]
root@ip-172-31-43-4:/home/ubuntu# curl localhost:9200/example_index/_search?pretty
{
  "took" : 3,
  "timed_out" : false,
  "_shards" : {
    "total" : 1,
    "successful" : 1,
    "skipped" : 0,
    "failed" : 0
  },
  "hits" : {
    "total" : {
      "value" : 2,
      "relation" : "eq"
    },
    "max_score" : 1.0,
    "hits" : [
      {
        "_index" : "example_index",
        "_type" : "document1",
        "_id" : "qxFzgX4Bbs_W8ADHTfGi",
        "_score" : 1.0,
        "_source" : {
          "name" : "Just an example doc"
        }
      },
      {
        "_index" : "example_index",
        "_type" : "document1",
        "_id" : "rhF0gX4Bbs_W8ADHlfFY",
        "_score" : 1.0,
        "_source" : {
          "name" : "Just an example doc"
        }
      }
    ]
  }
}
[/simterm]
Using the document’s ID – get its content:
[simterm]
root@ip-172-31-43-4:/home/ubuntu# curl -X GET 'localhost:9200/example_index/document1/qxFzgX4Bbs_W8ADHTfGi?pretty'
{
  "_index" : "example_index",
  "_type" : "document1",
  "_id" : "qxFzgX4Bbs_W8ADHTfGi",
  "_version" : 1,
  "_seq_no" : 0,
  "_primary_term" : 1,
  "found" : true,
  "_source" : {
    "name" : "Just an example doc"
  }
}
[/simterm]
Searching an index
Also, we can do a quick search over the index.
Let’s look for by the name field and part of the content of the document, the “doc” word:
[simterm]
root@ip-172-31-43-4:/home/ubuntu# curl -H 'Content-Type: application/json' -X GET 'localhost:9200/example_index/_search?pretty' -d '{ "query": { "match": { "name": "doc" } } }'
{
  "took" : 2,
  "timed_out" : false,
  "_shards" : {
    "total" : 1,
    "successful" : 1,
    "skipped" : 0,
    "failed" : 0
  },
  "hits" : {
    "total" : {
      "value" : 2,
      "relation" : "eq"
    },
    "max_score" : 0.18232156,
    "hits" : [
      {
        "_index" : "example_index",
        "_type" : "document1",
        "_id" : "qxFzgX4Bbs_W8ADHTfGi",
        "_score" : 0.18232156,
        "_source" : {
          "name" : "Just an example doc"
        }
      },
      {
        "_index" : "example_index",
        "_type" : "document1",
        "_id" : "rhF0gX4Bbs_W8ADHlfFY",
        "_score" : 0.18232156,
        "_source" : {
          "name" : "Just an example doc"
        }
      }
    ]
  }
}
[/simterm]
Delete an index
Use the DELETE and specify an index name to delete:
[simterm]
root@ip-172-31-43-4:/home/ubuntu# curl -X DELETE localhost:9200/example_index
{"acknowledged":true}
[/simterm]
Okay, now, we’ve seen what are indices, and how to work with them.
let’s go ahead and install Logstash.
Logstash installation
Install Logstash, it’s already present in the Elastic repository, that we’ve added before:
[simterm]
root@ip-172-31-43-4:/home/ubuntu# apt -y install logstash
[/simterm]
Run the service:
[simterm]
root@ip-172-31-43-4:/home/ubuntu# systemctl start logstash
root@ip-172-31-43-4:/home/ubuntu# systemctl enable logstash
Created symlink /etc/systemd/system/multi-user.target.wants/logstash.service → /etc/systemd/system/logstash.service.
[/simterm]
Main configuration file – /etc/logstash/logstash.yml, and for our configuration files, we will use the /etc/logstash/conf.d/ directory.
Its output (stdout) Logstash will write to the /var/logs/syslog.
Working with Logstash pipelines
See the How Logstash Works.
Pipelines in Logstash describes a chain: Input > Filter > Output.
In the Input, we can use, for example, such inputs as file, stdin, or beats.
Logstash Input and Output
To see how Logstash is working in general, let’s create the simplest pipeline that will accept data via its stdin, and prints it to the terminal via stdout.
The easiest way to test Logstash is to run its bin-file directly and pass configuration options via the -e:
[simterm]
root@ip-172-31-43-4:/home/ubuntu# /usr/share/logstash/bin/logstash -e 'input { stdin { } } output { stdout {} }'
...
The stdin plugin is now waiting for input:
Hello, World!
{
       "message" => "Hello, World!",
      "@version" => "1",
    "@timestamp" => 2022-01-22T11:30:33.971Z,
          "host" => "ip-172-31-43-4"
}
[/simterm]
Logstash Filter: grok
And a very basic grok example.
Create a file called logstash-test.conf:
input { stdin { } }

filter {
    grok {
      match => { "message" => "%{GREEDYDATA}" }
    }
}

output {
  stdout { }
}
Here, in the filter we are using grok, that will search for a match in a message text.
For such a search, grok uses regular expression patterns. In the example above, we are using the GREEDYDATA filter, that corresponds to the .* regex, i.e. any symbols.
Run Logstash again, but this time instead of the -e use -f and pass the file’s name:
[simterm]
root@ip-172-31-43-4:/home/ubuntu# /usr/share/logstash/bin/logstash -f logstash-test.conf
...
The stdin plugin is now waiting for input:
Hello, Grok!
{
       "message" => "Hello, Grok!",
    "@timestamp" => 2022-01-22T11:33:49.797Z,
      "@version" => "1",
          "host" => "ip-172-31-43-4"
}
[/simterm]
Okay.
Let’s try to do some data transformation, for example, let’s add a new tag called “Example”, and two new fields: one will contain just a text “Example value“, and in the second, we will add a time when the message was received:
input { stdin { } }
filter {
    grok {
      match => { "message" => "%{GREEDYDATA:my_message}" }
      add_tag => ["Example"]
      add_field => [ "example_field", "Example value" ]
      add_field => [ "received_at", "%{@timestamp}" ]
    }
}
output {
  stdout { }
}
Run it:
[simterm]
root@ip-172-31-43-4:/home/ubuntu# /usr/share/logstash/bin/logstash -f logstash-test.conf
...
Hello again, Grok!
{
          "message" => "Hello again, Grok!",
             "host" => "ip-172-31-43-4",
             "tags" => [
        [0] "Example"
    ],
      "received_at" => "2022-01-22T11:36:46.893Z",
       "my_message" => "Hello again, Grok!",
       "@timestamp" => 2022-01-22T11:36:46.893Z,
    "example_field" => "Example value",
         "@version" => "1"
}
[/simterm]
Logstash Input: file
Okay, now let’s try something different, for example, let’s read data from the /var/log/syslog log-file.
At first, check the file’s content:
[simterm]
root@ip-172-31-43-4:/home/ubuntu# tail -1 /var/log/syslog
Jan 22 11:41:49 ip-172-31-43-4 logstash[8099]: [2022-01-22T11:41:49,476][INFO ][logstash.agent           ] Successfully started Logstash API endpoint {:port=>9601, :ssl_enabled=>false}
[/simterm]
What do we have here?
- data and time –
Jan 22 11:41:49 - a host –
ip-172-31-43-4 - a program’s name –
logstash - a process PID –
8099 - and the message itself
In our filter, let’s use grok again, and in its match specify patterns and fields: instead of the GREEDYDATA that will save all the data in the “message” field, let’s add the SYSLOGTIMESTAMP, that will be triggered on the value Jan 21 14:06:23, and this value will be saved to the syslog_timestamp field, than SYSLOGHOST, DATA, POSINT, and the rest of the data we will get with the already known GREEDYDATA, and will save it to the syslog_message field.
Also, let’s add two additional fields – received_at and received_from, and will use the data, parsed in the macth, and then let’s drop the original message field, as we already save necessary data in the syslog_message:
input {
  file {
    path => "/var/log/syslog"
  }
}

filter {
    grok {
      match => { "message" => "%{SYSLOGTIMESTAMP:syslog_timestamp} %{SYSLOGHOST:syslog_hostname} %{DATA:syslog_program}(?:\[%{POSINT:syslog_pid}\])?: %{GREEDYDATA:syslog_message}" }
      add_field => [ "received_at", "%{@timestamp}" ]
      add_field => [ "received_from", "%{host}" ]
      remove_field => "message"
    }
}

output {
  stdout { }
}
Run it:
[simterm]
root@ip-172-31-43-4:/home/ubuntu# /usr/share/logstash/bin/logstash -f logstash-test.conf
...
{
                "host" => "ip-172-31-43-4",
                "path" => "/var/log/syslog",
         "received_at" => "2022-01-22T11:48:27.582Z",
      "syslog_message" => "#011at usr.share.logstash.lib.bootstrap.environment.<main>(/usr/share/logstash/lib/bootstrap/environment.rb:94) ~[?:?]",
    "syslog_timestamp" => "Jan 22 11:48:27",
      "syslog_program" => "logstash",
     "syslog_hostname" => "ip-172-31-43-4",
          "@timestamp" => 2022-01-22T11:48:27.582Z,
          "syslog_pid" => "9655",
            "@version" => "1",
       "received_from" => "ip-172-31-43-4"
}
...
[/simterm]
Well, nice!
Logstash output: elasticsearch
In the examples above, we’ve printed everything on the terminal.
Now, let’s try to save the data to an Elastisearch index:
input {
  file {
    path => "/var/log/syslog"
  }
}

filter {
    grok {
      match => { "message" => "%{SYSLOGTIMESTAMP:syslog_timestamp} %{SYSLOGHOST:syslog_hostname} %{DATA:syslog_program}(?:\[%{POSINT:syslog_pid}\])?: %{GREEDYDATA:syslog_message}" }
      add_field => [ "received_at", "%{@timestamp}" ]
      add_field => [ "received_from", "%{host}" ]
      remove_field => "message"
    }
}

output {
  elasticsearch {
    hosts => ["localhost:9200"]
  }
  stdout { }
}
Run it, and check Elastic’s indices – Logstash had to create a new one here:
[simterm]
root@ip-172-31-43-4:/home/ubuntu# curl localhost:9200/_cat/indices?v
health status index                      uuid                   pri rep docs.count docs.deleted store.size pri.store.size
green  open   .geoip_databases           2E8sIYX0RaiqyZWzPHYHfQ   1   0         42            0     40.4mb         40.4mb
yellow open   logstash-2022.01.22-000001 ekf_ntRxRiitIRcmYI2TOg   1   1          0            0       226b           226b
yellow open   example_index              akWscE7MQKy_fceS9ZMGGA   1   1          2            1      8.1kb          8.1kb
[/simterm]
logstash-2022.01.22-000001 – aha, here we are!
Let’s do some search over it, for example, about the logstash process, as it saves its output to the in the /var/log/syslog file:
[simterm]
root@ip-172-31-43-4:/home/ubuntu# curl -H 'Content-Type: application/json' localhost:9200/logstash-2022.01.22-000001/_search?pretty -d '{ "query": { "match": { "syslog_program": "logstash" } } }'
{
  "took" : 3,
  "timed_out" : false,
  "_shards" : {
    "total" : 1,
    "successful" : 1,
    "skipped" : 0,
    "failed" : 0
  },
  "hits" : {
    "total" : {
      "value" : 36,
      "relation" : "eq"
    },
    "max_score" : 0.33451337,
    "hits" : [
      {
        "_index" : "logstash-2022.01.22-000001",
        "_type" : "_doc",
        "_id" : "9BGogX4Bbs_W8ADHCvJl",
        "_score" : 0.33451337,
        "_source" : {
          "syslog_program" : "logstash",
          "received_from" : "ip-172-31-43-4",
          "syslog_timestamp" : "Jan 22 11:57:18",
          "syslog_hostname" : "ip-172-31-43-4",
          "syslog_message" : "[2022-01-22T11:57:18,474][INFO ][logstash.runner          ] Starting Logstash {\"logstash.version\"=>\"7.16.3\", \"jruby.version\"=>\"jruby 9.2.20.1 (2.5.8) 2021-11-30 2a2962fbd1 OpenJDK 64-Bit Server VM 11.0.13+8 on 11.0.13+8 +indy +jit [linux-x86_64]\"}",
          "host" : "ip-172-31-43-4",
          "@timestamp" : "2022-01-22T11:59:40.444Z",
          "path" : "/var/log/syslog",
          "@version" : "1",
          "syslog_pid" : "11873",
          "received_at" : "2022-01-22T11:59:40.444Z"
        }
      },
...
[/simterm]
Yay! It works!
Let’s go ahead.
Filebeat installation
Install the package:
[simterm]
root@ip-172-31-43-4:/home/ubuntu# apt -y install filebeat
[/simterm]
Configratuion file – /etc/filebeat/filebeat.yml.
By default, Filebeat will pass the data directly to an Elasticsearch instance:
...
# ================================== Outputs ===================================
# Configure what output to use when sending the data collected by the beat.
# ---------------------------- Elasticsearch Output ----------------------------
output.elasticsearch:
  # Array of hosts to connect to.
  hosts: ["localhost:9200"]
  # Protocol - either `http` (default) or `https`.
  #protocol: "https"
  # Authentication credentials - either API key or username/password.
  #api_key: "id:api_key"
  #username: "elastic"
  #password: "changeme"
...
Update the file: add the /var/log/syslog file parsing, and instead of the Elastic, let’s put the data to the Logstash.
Configure the filestream input, do now forget to enable it with the enabled: true:
...
filebeat.inputs:
...
- type: filestream
  ...
  enabled: true
  ...
  paths:
    - /var/log/syslog
...
Comment the output.elasticsearch block, and uncomment the output.logstash:
...
# ---------------------------- Elasticsearch Output ----------------------------
#output.elasticsearch:
  # Array of hosts to connect to.
  #  hosts: ["localhost:9200"]
  ...
# ------------------------------ Logstash Output -------------------------------
output.logstash:
  ...
  hosts: ["localhost:5044"]
...
For the Logstash create a new config-file /etc/logstash/conf.d/beats.conf:
input {
  beats {
    port => 5044
  }
}
output {
  elasticsearch {
    hosts => ["http://localhost:9200"]
    index => "%{[@metadata][beat]}-%{[@metadata][version]}-%{+YYYY.MM.dd}"
  }
}
In the elasticsearch specify a host and an index name to be used to save the data.
Run Logstash:
[simterm]
root@ip-172-31-43-4:/home/ubuntu# systemctl start logstash
[/simterm]
Check the /var/log/syslog:
[simterm]
Jan 22 12:10:34 ip-172-31-43-4 logstash[12406]: [2022-01-22T12:10:34,054][INFO ][org.logstash.beats.Server][main][e3ccc6e9edc43cf62f935b6b4b9cf44b76d887bb01e30240cbc15ab5103fe4b6] Starting server on port: 5044
[/simterm]
Run Filebeat:
[simterm]
root@ip-172-31-43-4:/home/ubuntu# systemctl start filebeat
[/simterm]
Check Elastic’s indices:
[simterm]
root@ip-172-31-43-4:/home/ubuntu# curl localhost:9200/_cat/indices?v
health status index                      uuid                   pri rep docs.count docs.deleted store.size pri.store.size
green  open   .geoip_databases           2E8sIYX0RaiqyZWzPHYHfQ   1   0         42            0     40.4mb         40.4mb
yellow open   filebeat-7.16.3-2022.01.22 fTUTzKmKTXisHUlfNbobPw   1   1       7084            0     14.3mb         14.3mb
yellow open   logstash-2022.01.22-000001 ekf_ntRxRiitIRcmYI2TOg   1   1         50            0     62.8kb         62.8kb
yellow open   example_index              akWscE7MQKy_fceS9ZMGGA   1   1          2            1      8.1kb          8.1kb
[/simterm]
filebeat-7.16.3-2022.01.22 – here it is.
Kibana installation
Install the package:
[simterm]
root@ip-172-31-43-4:/home/ubuntu# apt -y install kibana
[/simterm]
Edit its config-file /etc/kibana/kibana.yml, set the server.host==0.0.0.0 to make it accessible over the Internet.
Run the service:
[simterm]
root@ip-172-31-43-4:/home/ubuntu# systemctl start kibana
root@ip-172-31-43-4:/home/ubuntu# systemctl enable kibana
[/simterm]
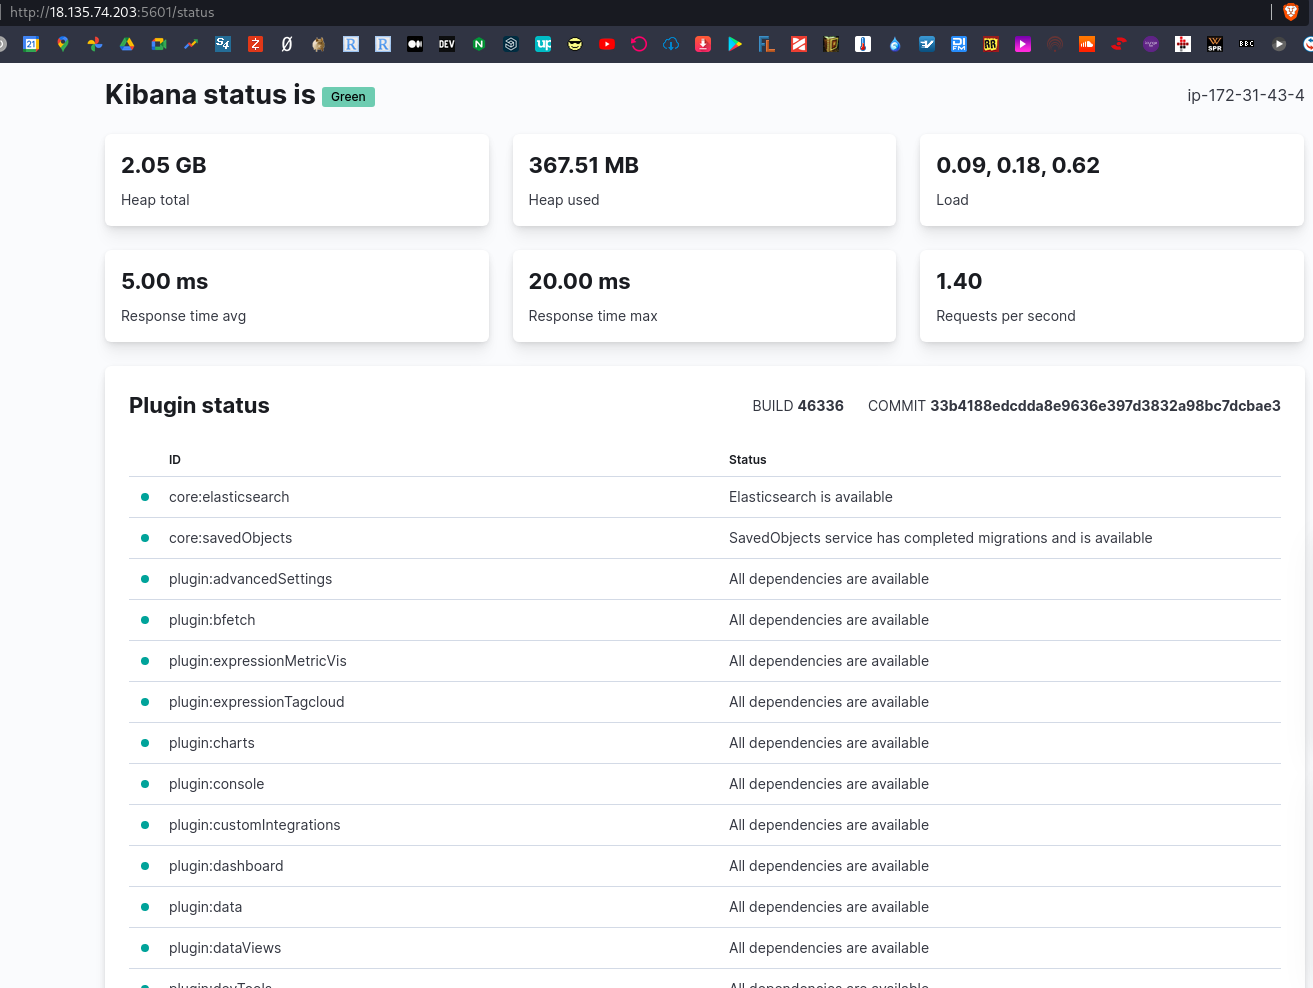
Check with a browser:
Its status – /status:
Click on the Explore on my own, go to the Management > Stack management:
Go to the Index patterns, create a new patter for Kibana using the filebeat-* mask, and on the right side will see, that Kibana already found corresponding Elasticsearch indices:
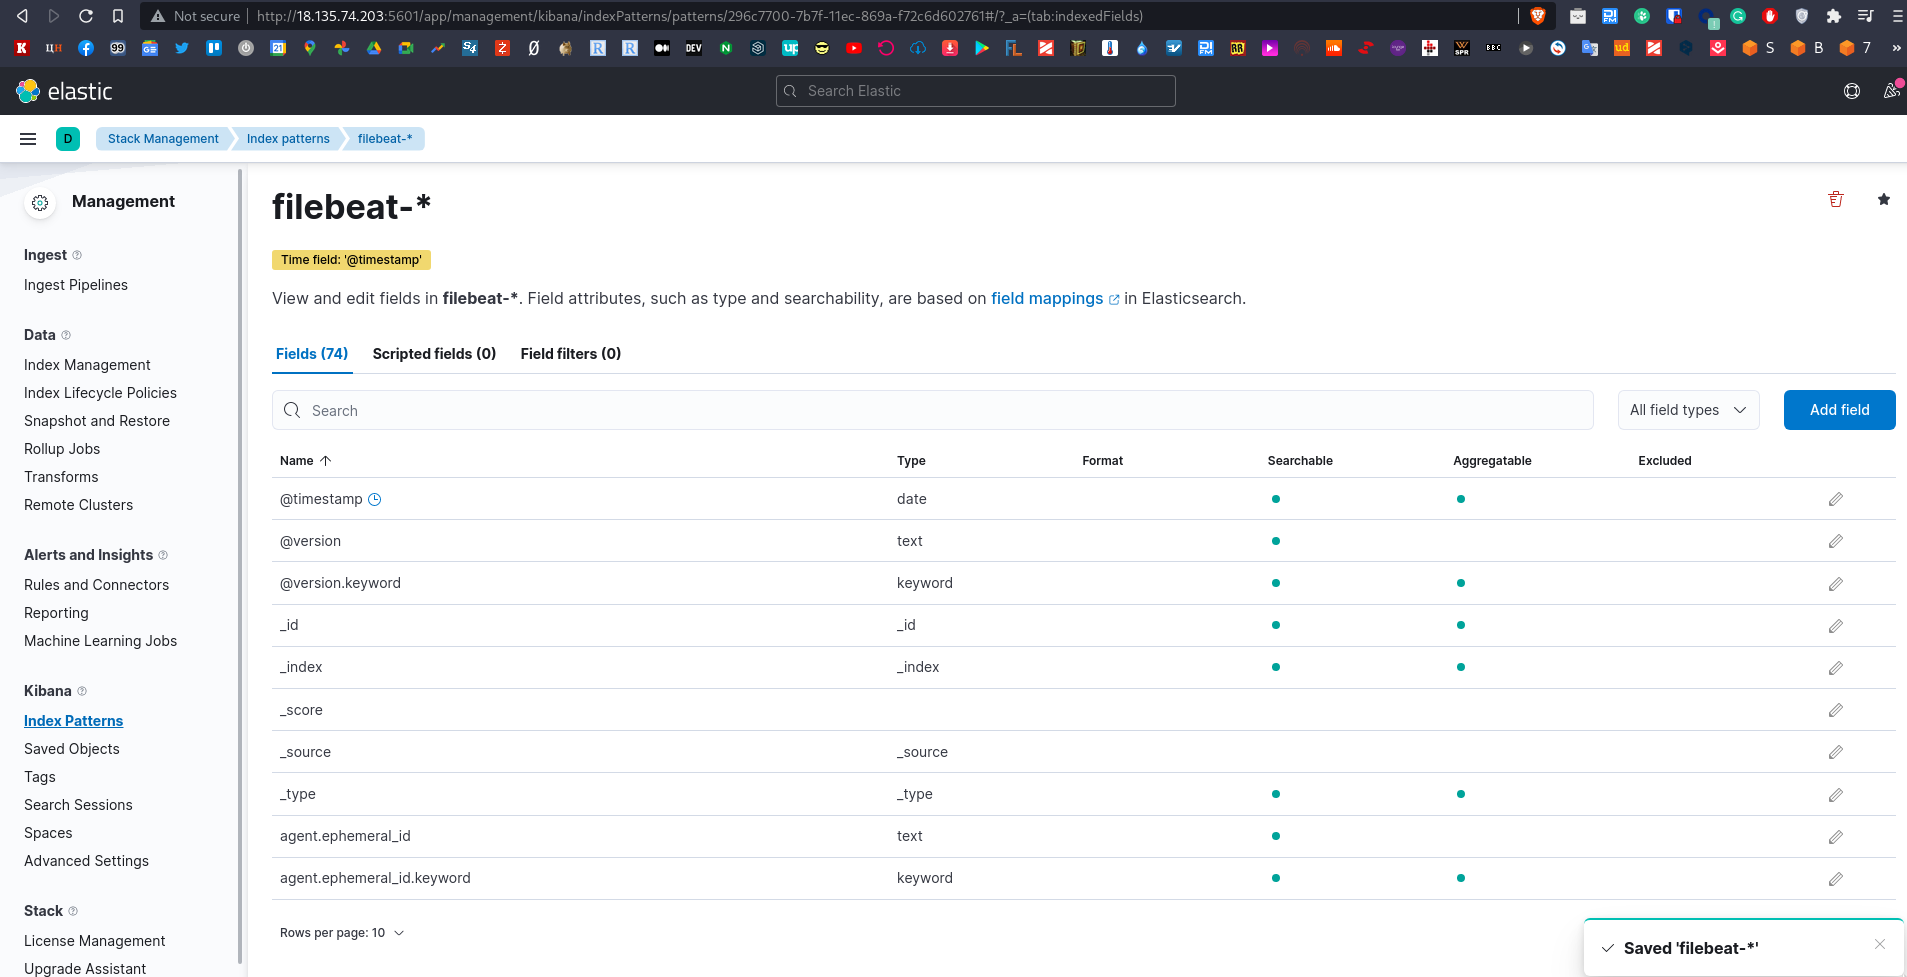
And we can see all the fields, already indexed by Kibana:
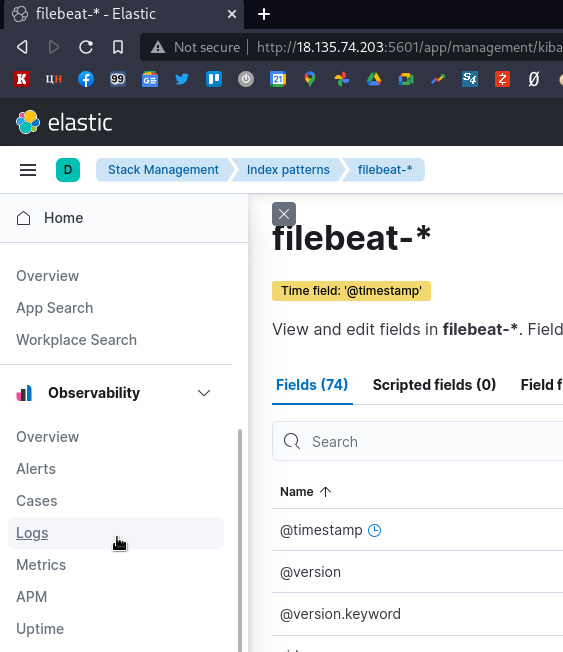
Go to the Observability – Logs:
And can see our /var/log/syslog:
Logstash, Filebeat, and NGINX: configuration example
Now, let’s do something from the real world:
- install NGINX
- configure Filebeat to collect NGINX’s logs
- configure Logstash to accept them and save data to the Elastic
- and will check the Kibana
Install NGINX:
[simterm]
root@ip-172-31-43-4:/home/ubuntu# apt -y install nginx
[/simterm]
Check its log-files:
[simterm]
root@ip-172-31-43-4:/home/ubuntu# ll /var/log/nginx/
access.log  error.log
[/simterm]
Check if the web-server is working:
[simterm]
root@ip-172-31-43-4:/home/ubuntu# curl localhost:80
<!DOCTYPE html>
<html>
<head>
<title>Welcome to nginx!</title>
...
[/simterm]
И access.log:
[simterm]
root@ip-172-31-43-4:/home/ubuntu# tail -1 /var/log/nginx/access.log
127.0.0.1 - - [26/Jan/2022:11:33:21 +0000] "GET / HTTP/1.1" 200 612 "-" "curl/7.68.0"
[/simterm]
Okay.
Filebeat Inputs configguration
Documentation – Configure inputs, and Configure general settings.
Edit the filebeat.inputs block, to the /var/log/syslog input add two new – for NGINX’s access and error logs:
...
# ============================== Filebeat inputs ===============================

filebeat.inputs:

- type: filestream
  enabled: true
  paths:
    - /var/log/syslog
  fields:
    type: syslog
  fields_under_root: true
  scan_frequency: 5s

- type: log
  enabled: true
  paths:
      - /var/log/nginx/access.log
  fields:
    type: nginx_access
  fields_under_root: true
  scan_frequency: 5s

- type: log
  enabled: true
  paths:
      - /var/log/nginx/error.log
  fields:
    type: nginx_error
  fields_under_root: true
  scan_frequency: 5s
...
Here, we are using the log type of the input, and will add a new filed – type: nginx_access/nginx_error.
Logstash configuration
Delete the config-file for Logstash, that we’ve created before, /etc/logstash/conf.d/beats.conf, and write it over:
input {
  beats {
    port => 5044
  }
}

filter {
  if [type] == "syslog" {
    grok {
      match => { "message" => "%{SYSLOGTIMESTAMP:syslog_timestamp} %{SYSLOGHOST:syslog_hostname} %{DATA:syslog_program}(?:\[%{POSINT:syslog_pid}\])?: %{GREEDYDATA:syslog_message}" }
      add_field => [ "received_at", "%{@timestamp}" ]
      add_field => [ "received_from", "%{host}" ]
      remove_field => "message"
    }
  }
}

filter {
 if [type] == "nginx_access" {
    grok {
        match => { "message" => "%{IPORHOST:remote_ip} - %{DATA:user} \[%{HTTPDATE:access_time}\] \"%{WORD:http_method} %{DATA:url} HTTP/%{NUMBER:http_version}\" %{NUMBER:response_code} %{NUMBER:body_sent_bytes} \"%{DATA:referrer}\" \"%{DATA:agent}\"" }
    }
  }
  date {
        match => [ "timestamp" , "dd/MMM/YYYY:HH:mm:ss Z" ]
  }
  geoip {
         source => "remote_ip"
         target => "geoip"
         add_tag => [ "nginx-geoip" ]
  }
}

output {

  if [type] == "syslog" {
    elasticsearch {
      hosts => ["localhost:9200"]
      index => "logstash-%{+YYYY.MM.dd}"
    }
  }

  if [type] == "nginx_access" {
    elasticsearch {
      hosts => ["localhost:9200"]
      index => "nginx-%{+YYYY.MM.dd}"
    }
  }

  stdout { }
}
Here we’ve set:
inputon the 5044 port for thefilebeat- two
filters:- the first: will check the
typefield, and if its value == syslog, then Logstash will parse its data - the second: will check the
typefield, and if its value == nginx_access, then Logstash will parse its data as NGINX access-log
- the first: will check the
outoutuses twoifconditions and depending on their results will pass the data to indexlogstash-%{+YYYY.MM.dd}(for syslog) ornginx-%{+YYYY.MM.dd}(for NGINX)
Restart Logstash and Filebeat:
[simterm]
root@ip-172-31-43-4:/home/ubuntu# systemctl restart logstash
root@ip-172-31-43-4:/home/ubuntu# systemctl restart filebeat
[/simterm]
Run curl in a loop to generate some data in NGINX access-log:
[simterm]
ubuntu@ip-172-31-43-4:~$ watch -n 1 curl -I localhost
[/simterm]
Check Elasticsearch indices:
[simterm]
root@ip-172-31-43-4:/home/ubuntu# curl localhost:9200/_cat/indices?v
health status index                           uuid                   pri rep docs.count docs.deleted store.size pri.store.size
...
yellow open   logstash-2022.01.28             bYLp_kI3TwW3sPfh7XpcuA   1   1     213732            0      159mb          159mb
...
yellow open   nginx-2022.01.28                0CwH4hBhT2C1sMcPzCQ9Pg   1   1          1            0     32.4kb         32.4kb
[/simterm]
And here is our new NGINX index.
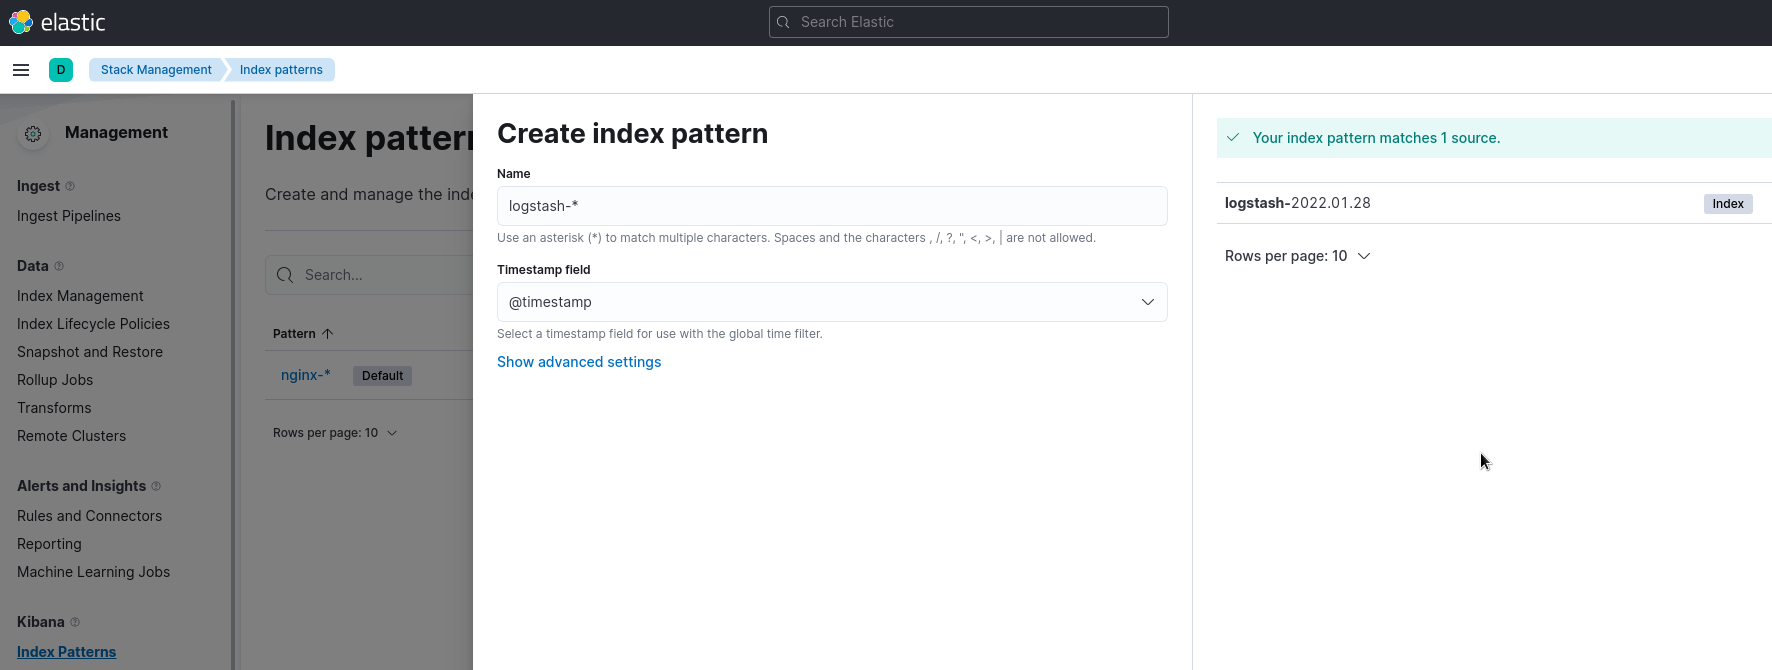
Go to the Kibana, and add another Index pattern logstash-*:
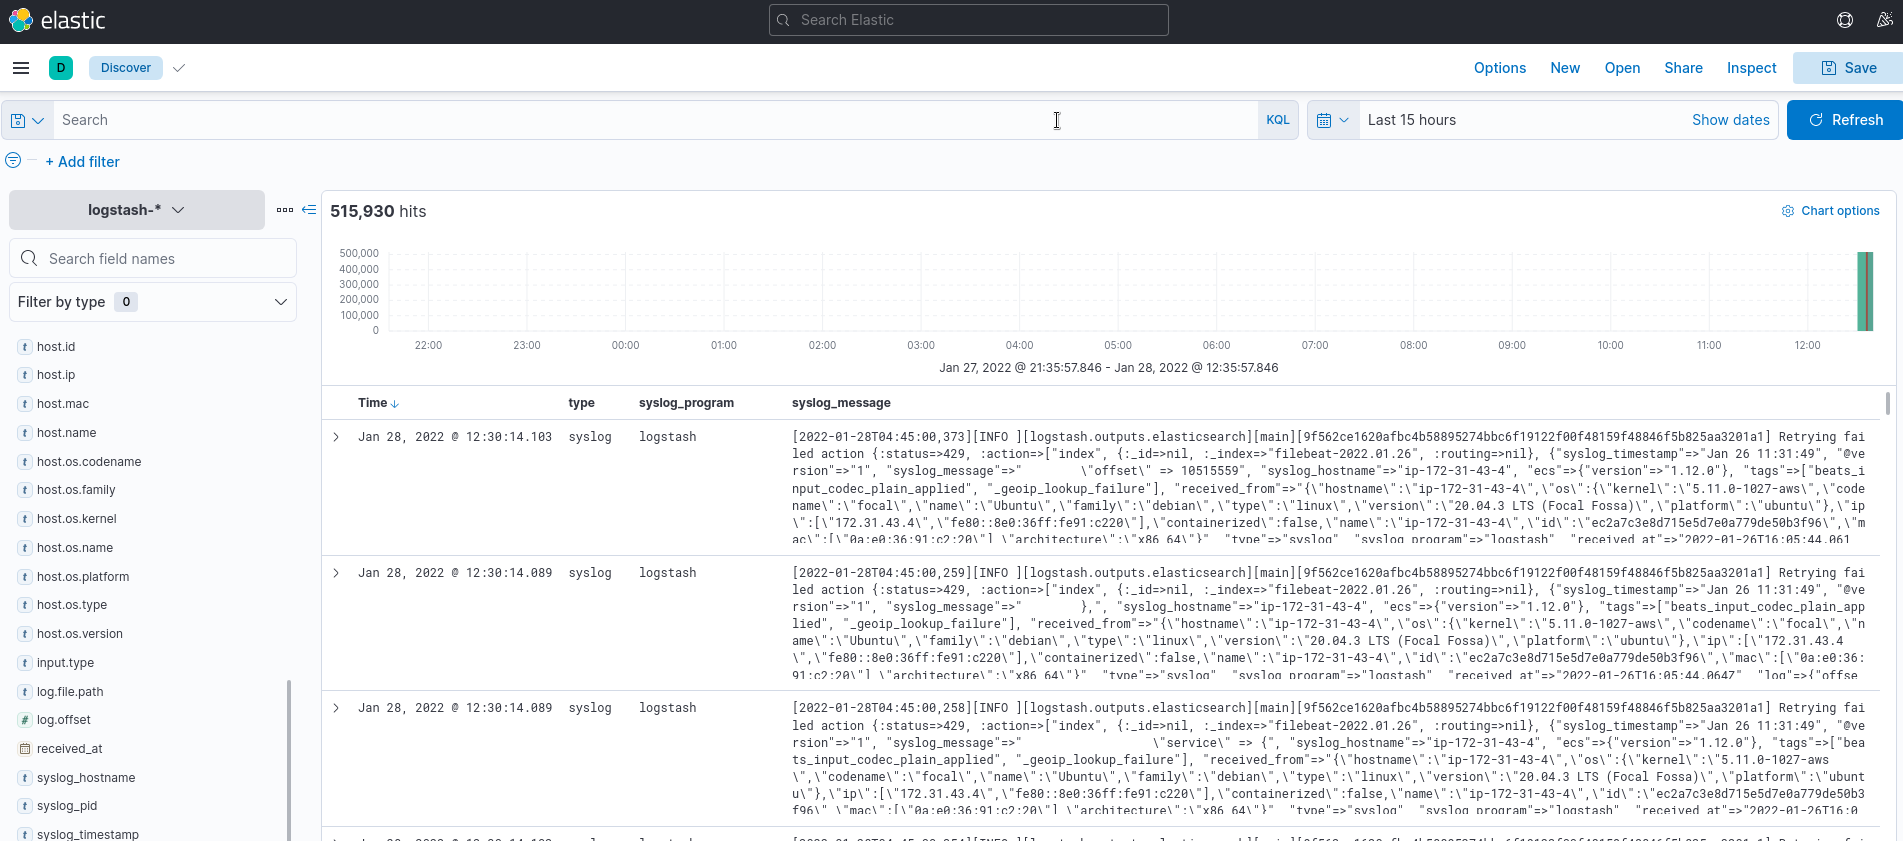
Go to the Analitycs > Discover, choose an index, and see your data:
In the same way – for the NGINX logs:
Done.
Useful links
Elastic Stack
- Elastic Stack on Kubernetes 1.15 using Helm v3
- ELK Stack Tutorial: Get Started with Elasticsearch, Logstash, Kibana, & Beats
- How to Install ELK Stack (Elasticsearch, Logstash, and Kibana) on Ubuntu 18.04 / 20.04
- UPDATED ELK STACK GUIDE FOR 2022
- How To Install Elasticsearch, Logstash, and Kibana (Elastic Stack) on Ubuntu 18.04
Elasticsearch
Logstash
- How Logstash Works
- Filter plugins
- A Practical Introduction to Logstash
- Getting started with logstash
- Tutorial: Logstash Grok Patterns with Examples
- A Beginner’s Guide to Logstash Grok
- Beats input plugin
Filebeat
![]()


