 After implementing the Loki system on my job’s project – I decided to add it for myself, so see my RTFM blog server’s logs.
Also – want to add the node_exporter and alertmanager, to be notified about high disk usage.
In this post, I’ll describe the Prometheus, node_exporter, Grafana, Loki, and promtail set up process step with Ansible for automation and with some issues, I faced with during doing all this.
Usually – I’m adding links at the post’s end but this time makes sense to add it at the very beginning:
To get familiar with the Prometheus system in general (still in Russian only, unfortunately):
- Prometheus: мониторинг — введение, установка, запуск, примеры
- Prometehus: обзор — federation, мониторинг Docker Swarm и настройки Alertmanager
- Prometheus: запуск сервера с Alertmanager, cAdvisor и Grafana
About the Loki (Eng):
- Grafana Labs: Loki – logs collecting and monitoring system
- Grafana Labs: Loki – distributed system, labels and filters
Contents
Current RTFM’s monitoring
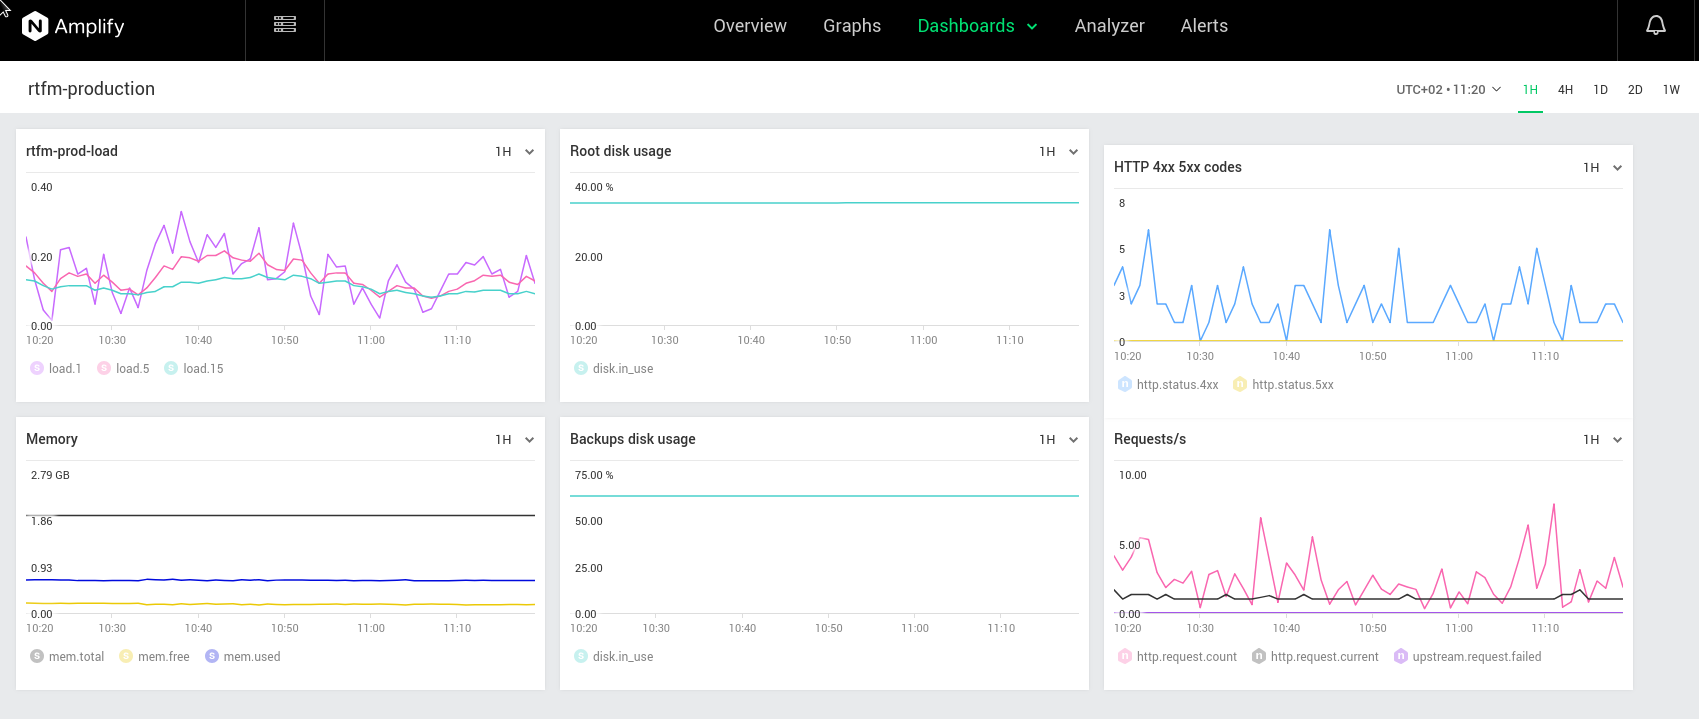
General monitoring now is performed by the two services – NGINX Amplify and uptrends.com.
NGINX Amplify
Nice service, using it a few years.
Can do everything from the box, client’s setup can be done in a couple of clicks but have one huge disadvantage (as for me) – its alerting system by the system.disk.in_use metric can be added for the root partition only.
The RTFM’s server has an additional disk attached and mounted to the /backups directory:
[simterm]
root@rtfm-do-production:/home/setevoy# lsblk
NAME   MAJ:MIN RM  SIZE RO TYPE MOUNTPOINT
sda      8:0    0   20G  0 disk
└─sda1   8:1    0   20G  0 part /backups
vda    254:0    0   50G  0 disk
└─vda1 254:1    0   50G  0 part /
vdb    254:16   0  440K  1 disk
[/simterm]
The Amplify Dashboard looks like this:
Backups
In the /backups the local backups are stored, created by the simple-backup tool. Check the Python: скрипт бекапа файлов и баз MySQL в AWS S3 (Rus) post for more details.
This tool is not ideal and I want to change some things in it or just rewrite it from scratch – but for now, it works fine.
Exactly the problem for me is that tool first creates local backups and stores them in the/backups, and only after this will perform upload to an AWS S3 bucket.
If the /backups partition will be full and the tool will not be able to save latest backups in there – then and S3 upload will not be done.
As a temporary solution – I just added email notifications if the backup process will fail:
[simterm]
root@rtfm-do-production:/home/setevoy# crontab -l | grep back
#Ansible: simple-backup
0 1 * * * /opt/simple-backup/sitebackup.py -c /usr/local/etc/production-simple-backup.ini >> /var/log/simple-backup.log || cat /var/log/simple-backup.log  | mailx -s "RTFM production backup - Failed" [email protected]
[/simterm]
uptrends.com
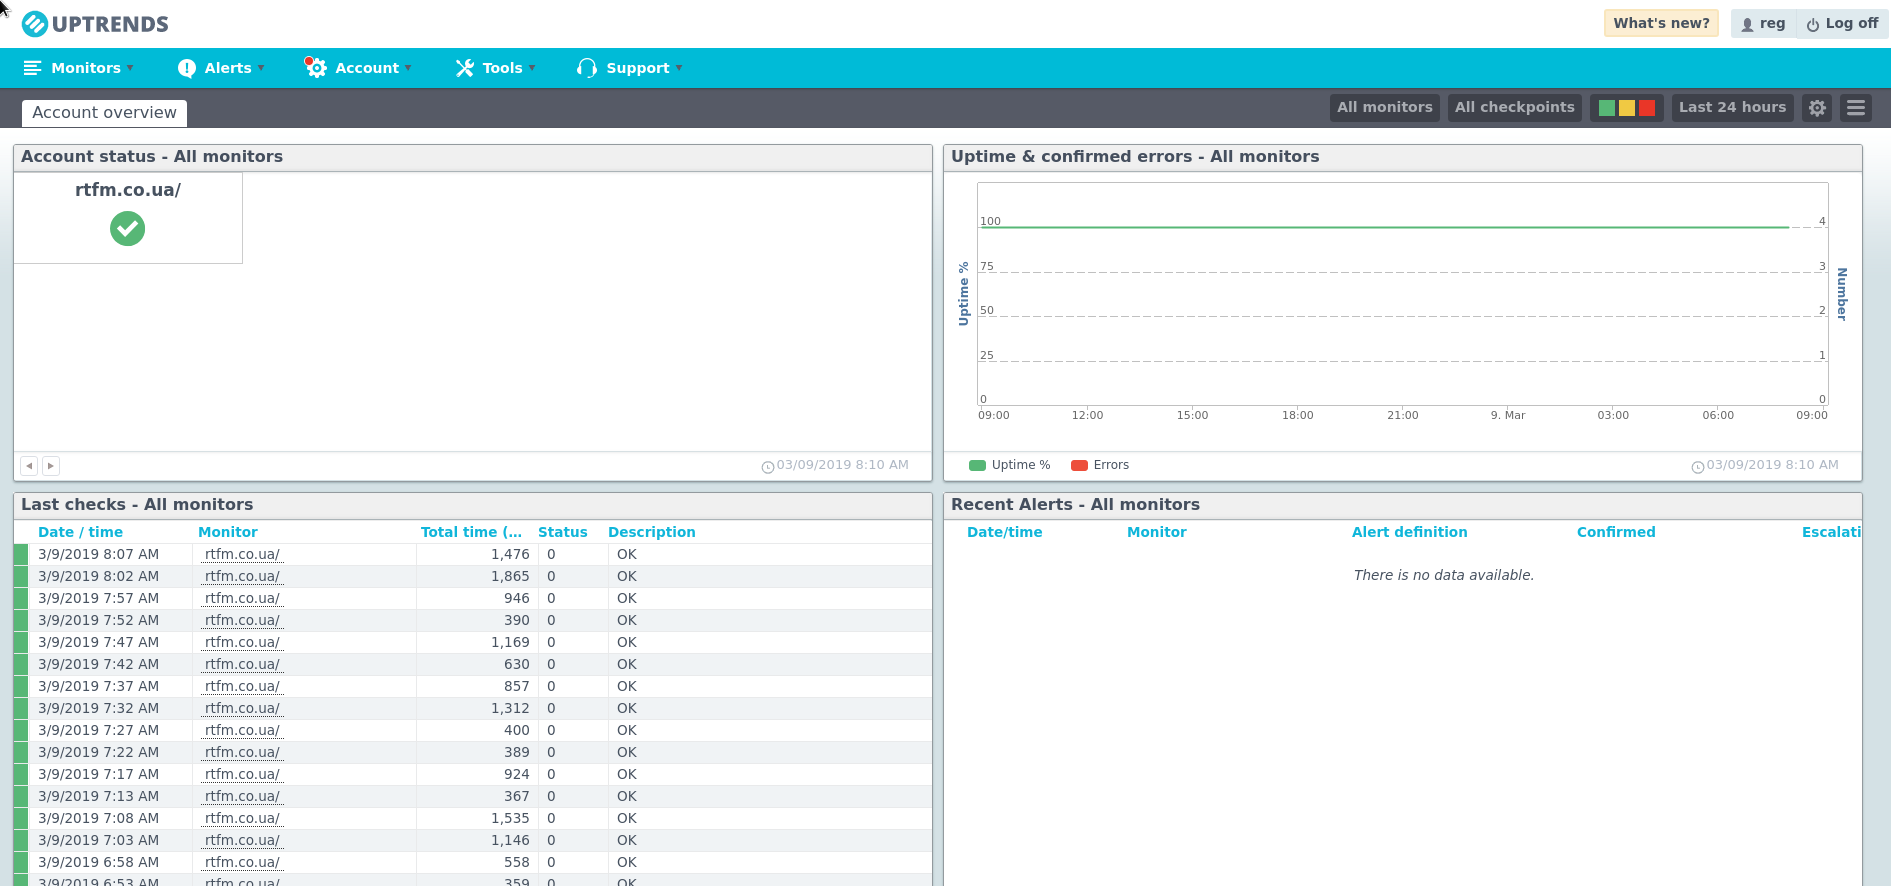
Just a ping-service with email notifications if a site’s response wasn’t 200.
In its free version – only one site available for checks and only email notifications allowed, but for me, it’s good enough:
Prometheus, Grafana, and Loki
Today will set up additional monitoring.
The first plan was just to add Loki to see logs, but as I’ll set up it – why not to add Prometheus, node_exporter and Alertmanager to have alerts about disks usage and get notifications via email and my own Slack?
Especially – when I already have all configs from work so I need only to copy them and update “a bit” for this current setup as there will no need to have such amount of metrics and alerts.
For now, I’ll run this monitoring stack on the RTFM’s host and later maybe will move it to a small dedicated server – when all Ansible roles and templates will be ready this will be much more simple.
All automation will be done using Ansible, as usual.
So the plan is next:
- add monitoring role to Ansible
- add Docker Compose template to run services:
- prometheus-server
- node_exporter
- loki
- Grafana 6.0
- promtail for logs collecting
- by the way, will have to update such already existing roles:
- nginx – to add a new virtual host to proxy requests to Grafana and Prometheus
- letsencrypt – to obtain a new SSL certificate
When/if I’ll move this stack to a dedicated host – will make sense to add an blackbox_exporter and check all my domains.
In general RTFM’s automation at this moment looks more or less like it’s described in the AWS: миграция RTFM 3.0 (final) — CloudFormation и Ansible роли (Rus) post – just now the server is hosted in the DigitalOcean and all Ansible files were moved to a single Github repository (Microsoft did good a good gift to all by allowing to have private repositories, apparently fearing exodus of users after buying Github).
Later I’ll move all roles and templates used for RTFM in a public repository with some fake data.
Ansible – the Monitoring role creation
Create new directories:
[simterm]
$ mkdir -p roles/monitoring/{tasks,templates}
[/simterm]
Enough for now.
Add the role to the playbook:
...
    - role: amplify
      tags: amplify, monitoring, app

    - role: monitoring
      tags: prometheus, monitoring, app
...
The app tag used as a replacement to the all tag to run everything excluding some roles, monitoring – to run everything about monitoring, and with the prometheus tag – we will run all that will be done today.
To run Ansible I’m using simple bash-script – check the Скрипт запуска Ansible post (Rus).
Now create the roles/monitoring/tasks/main.yml file and let’s start adding tasks in it.
User and catalogs
First – add new variables to the group_vars/all.yml:
...
# MONITORING
prometheus_home: "/opt/prometheus"
prometheus_data: "/data/prometheus"
prometheus_user: "prometheus"
In the roles/monitoring/tasks/main.yml add user creation:
- name: "Add Prometheus user"
  user:
    name: "{{ prometheus_user }}"
    shell: "/usr/sbin/nologin"
And a directory creation which will contain all Prometheus etc configs and Docker Compose file:
- name: "Create monitoring stack dir {{ prometheus_home }}"
  file:
    path: "{{ prometheus_home }}"
    state: directory
    owner: "{{ prometheus_user }}"
    group: "{{ prometheus_user }}"
    recurse: yes
Also – directory for the Prometheus TSDB – metrics will be stored week or two – no need to keep them more:
- name: "Create Prometehus TSDB data dir {{ prometheus_data }}"
  file:
    path: "{{ prometheus_data }}"
    state: directory
    owner: "{{ prometheus_user }}"
    group: "{{ prometheus_user }}"
In my working project there much more dirs are used:
/etc/prometheus– to store Prometheus, Alertmanager, blackbox-exporter configs/etc/grafana– Grafana configs and provisioning directory/opt/prometheus– to store Compose file/data/prometheus– Prometheus TSDB/data/grafana– Grafana data (-rwxr-xr-x 1 grafana grafana 8.9G Mar 9 09:12 grafana.db– OMG!)
Now can run and test it – first on my Dev environment, of course:
[simterm]
$ ./ansible_exec.sh -t prometheus

Tags: prometheus
Env: rtfm-dev
...
Dry-run check passed.

Are you sure to proceed? [y/n] y
Applying roles...

...
TASK [monitoring : Add Prometheus user] ****
changed: [ssh.dev.rtfm.co.ua]

TASK [monitoring : Create monitoring stack dir /opt/prometheus] ****
changed: [ssh.dev.rtfm.co.ua]

TASK [monitoring : Create Prometehus TSDB data dir /data/prometheus] ****
changed: [ssh.dev.rtfm.co.ua]

PLAY RECAP ****
ssh.dev.rtfm.co.ua      : ok=4    changed=3    unreachable=0    failed=0

Provisioning done.
[/simterm]
Check directories on the remote:
[simterm]
root@rtfm-do-dev:~# ll /data/prometheus/ /opt/prometheus/
/data/prometheus/:
total 0

/opt/prometheus/:
total 0
[/simterm]
User:
[simterm]
root@rtfm-do-dev:~# id prometheus
uid=1003(prometheus) gid=1003(prometheus) groups=1003(prometheus)
[/simterm]
systemd and Docker Compose
Next – create the systemd-unit file and a template to run stack – now only theprometehus-server and the node_exporter containers here.
An systemd-file example to run Docker Compose as a service can be found here Linux: systemd сервис для Docker Compose (Rus).
Create a template file roles/monitoring/templates/prometheus.service.j2:
[Unit]
Description=Prometheus monitoring stack
Requires=docker.service
After=docker.service

[Service]
Restart=always
WorkingDirectory={{ prometheus_home }}

# Compose up
ExecStart=/usr/local/bin/docker-compose -f prometheus-compose.yml up
# Compose down, remove containers and volumes
ExecStop=/usr/local/bin/docker-compose -f prometheus-compose.yml down -v

[Install]
WantedBy=multi-user.target
And Compose file’s template – roles/monitoring/templates/prometheus-compose.yml.j2:
version: '2.4'

networks:
  prometheus:

services:

  prometheus-server:
    image: prom/prometheus
    networks:
      - prometheus
    ports:
      - 9091:9090
    restart: unless-stopped
    mem_limit: 500m

  node-exporter:
    image: prom/node-exporter
    networks:
      - prometheus
    ports:
      - 9100:9100
    volumes:
      - /proc:/host/proc:ro
      - /sys:/host/sys:ro
      - /:/rootfs:ro
    command:
      - '--path.procfs=/host/proc'
      - '--path.sysfs=/host/sys'
      - --collector.filesystem.ignored-mount-points
      - "^/(sys|proc|dev|host|etc|rootfs/var/lib/docker/containers|rootfs/var/lib/docker/overlay2|rootfs/run/docker/netns|rootfs/var/lib/docker/aufs)($$|/)"
    restart: unless-stopped
    mem_limit: 500m
Add their coping and service start to the roles/monitoring/tasks/main.yml:
...
- name: "Copy Compose file {{ prometheus_home }}/prometheus-compose.yml"
  template:
    src: templates/prometheus-compose.yml.j2
    dest: "{{ prometheus_home }}/prometheus-compose.yml"
    owner: "{{ prometheus_user }}"
    group:  "{{ prometheus_user }}"
    mode: 0644

- name: "Copy systemd service file /etc/systemd/system/prometheus.service"
  template:
    src: "templates/prometheus.service.j2"
    dest: "/etc/systemd/system/prometheus.service"
    owner: "root"
    group:  "root"
    mode: 0644

- name: "Start monitoring service"
  service:
    name: "prometheus"
    state: restarted
    enabled: yes
Run provisioning script and check the service:
[simterm]
root@rtfm-do-dev:~# systemctl status prometheus.service
● prometheus.service - Prometheus monitoring stack
   Loaded: loaded (/etc/systemd/system/prometheus.service; enabled; vendor preset: enabled)
   Active: active (running) since Sat 2019-03-09 09:52:20 EET; 5s ago
 Main PID: 1347 (docker-compose)
    Tasks: 5 (limit: 4915)
   Memory: 54.1M
      CPU: 552ms
   CGroup: /system.slice/prometheus.service
           ├─1347 /usr/local/bin/docker-compose -f prometheus-compose.yml up
           └─1409 /usr/local/bin/docker-compose -f prometheus-compose.yml up
[/simterm]
Containers:
[simterm]
root@rtfm-do-dev:~# docker ps
CONTAINER ID        IMAGE                COMMAND                  CREATED             STATUS              PORTS                    NAMES
8decc7775ae9        jc5x/firefly-iii     ".deploy/docker/entr…"   7 seconds ago       Up 5 seconds        0.0.0.0:9090->80/tcp     firefly_firefly_1
3647286526c2        prom/node-exporter   "/bin/node_exporter …"   7 seconds ago       Up 5 seconds        0.0.0.0:9100->9100/tcp   prometheus_node-exporter_1
dbe85724c7cf        prom/prometheus      "/bin/prometheus --c…"   7 seconds ago       Up 5 seconds        0.0.0.0:9091->9090/tcp   prometheus_prometheus-server_1
[/simterm]
(firefly-iii – it’s Home Accounting, see the Firefly III: домашняя бухгалтерия (Rus) post)
Let’s Encrypt
To access Grafana – the monitor.example.com domain (and dev.monitor.example.com for the Dev environment) will be used, so need to obtain an SSL certificate for NGINX.
The whole letsencrypt role is next:
- name: "Install Let's Encrypt client"
  apt:
    name: letsencrypt
    state: latest

- name: "Check if NGINX is installed"
  package_facts:
    manager: "auto"

- name: "NGINX test result - True"
  debug:
    msg: "NGINX found"
  when: "'nginx' in ansible_facts.packages"

- name: "NGINX test result - False"
  debug:
    msg: "NGINX NOT found"
  when: "'nginx' not in ansible_facts.packages"

- name: "Stop NGINX"
  systemd:
    name: nginx
    state: stopped
  when: "'nginx' in ansible_facts.packages"

# on first install - no /etc/letsencrypt/live/ will be present
- name: "Check if /etc/letsencrypt/live/ already present"
  stat:
    path: "/etc/letsencrypt/live/"
  register: le_live_dir

- name: "/etc/letsencrypt/live/ check result"
  debug:
    msg: "{{ le_live_dir.stat.path }}"

- name: "Initialize live_certs with garbage if no /etc/letsencrypt/live/ found"
  command: "ls -1 /etc/letsencrypt/"
  register: live_certs
  when: le_live_dir.stat.exists == false

- name: "Check existing certificates"
  command: "ls -1 /etc/letsencrypt/live/"
  register: live_certs
  when: le_live_dir.stat.exists == true

- name: "Certs found"
  debug:
    msg: "{{ live_certs.stdout_lines }}"

- name: "Obtain certificates"
  command: "letsencrypt certonly --standalone --agree-tos -m {{ notify_email }} -d {{ item.1 }}"
  with_subelements:
    - "{{ web_projects }}"
    - domains
  when: "item.1 not in live_certs.stdout_lines"

- name: "Start NGINX"
  systemd:
    name: nginx
    state: started
  when: "'nginx' in ansible_facts.packages"

- name: "Update renewal settings to web-root"
  lineinfile:
    dest: "/etc/letsencrypt/renewal/{{ item.1 }}.conf"
    regexp: '^authenticator '
    line: "authenticator = webroot"
    state: present
  with_subelements:
    - "{{ web_projects }}"
    - domains

- name: "Add Let's Encrypt cronjob for cert renewal"
  cron:
    name: letsencrypt_renewal
    special_time: weekly
    job: letsencrypt renew --webroot -w /var/www/html/ &> /var/log/letsencrypt/letsencrypt.log && service nginx reload
Domains list to obtain certificates for is taken from the nested domains list:
...
- name: "Obtain certificates"
  command: "letsencrypt certonly --standalone --agree-tos -m {{ notify_email }} -d {{ item.1 }}"
  with_subelements:
    - "{{ web_projects }}"
    - domains
  when: "item.1 not in live_certs.stdout_lines"
...
In doing so – first already existing certificates will be checked if any to avoid requesting them once again:
...
- name: "Check existing certificates"
  command: "ls -1 /etc/letsencrypt/live/"
  register: live_certs
  when: le_live_dir.stat.exists == true
...
web_projects and domains are defined in a variables files:
[simterm]
$ ll group_vars/rtfm-*
-rw-r--r-- 1 setevoy setevoy 4731 Mar  8 20:26 group_vars/rtfm-dev.yml
-rw-r--r-- 1 setevoy setevoy 5218 Mar  8 20:26 group_vars/rtfm-production.yml
[/simterm]
And looks like next:
...
#######################
### Roles variables ###
#######################

# used in letsencrypt, nginx, php-fpm
web_projects:

  - name: rtfm
    domains:
      - dev.rtfm.co.ua

  - name: setevoy
    domains:
      - dev.money.example.com
      - dev.use.example.com
...
Now create monitor.example.com and dev.monitor.example.com subdomains and wait for DNS updates:
[simterm]
root@rtfm-do-dev:~# dig dev.monitor.example.com +short
174.***.***.179
[/simterm]
Update the domains list and get new certificates:
[simterm]
$ ./ansible_exec.sh -t letsencrypt

Tags: letsencrypt
Env: rtfm-dev

...

TASK [letsencrypt : Check if NGINX is installed] ****
ok: [ssh.dev.rtfm.co.ua]

TASK [letsencrypt : NGINX test result - True] ****
ok: [ssh.dev.rtfm.co.ua] => {
    "msg": "NGINX found"
}

TASK [letsencrypt : NGINX test result - False] ****
skipping: [ssh.dev.rtfm.co.ua]

TASK [letsencrypt : Stop NGINX] ****
changed: [ssh.dev.rtfm.co.ua]

TASK [letsencrypt : Check if /etc/letsencrypt/live/ already present] ****
ok: [ssh.dev.rtfm.co.ua]

TASK [letsencrypt : /etc/letsencrypt/live/ check result] ****
ok: [ssh.dev.rtfm.co.ua] => {
    "msg": "/etc/letsencrypt/live/"
}

TASK [letsencrypt : Initialize live_certs with garbage if no /etc/letsencrypt/live/ found] ****
skipping: [ssh.dev.rtfm.co.ua]

TASK [letsencrypt : Check existing certificates] ****
changed: [ssh.dev.rtfm.co.ua]

TASK [letsencrypt : Certs found] ****
ok: [ssh.dev.rtfm.co.ua] => {
    "msg": [
        "dev.use.example.com",
        "dev.money.example.com",
        "dev.rtfm.co.ua",
        "README"
    ]
}

TASK [letsencrypt : Obtain certificates] ****
skipping: [ssh.dev.rtfm.co.ua] => (item=[{'name': 'rtfm'}, 'dev.rtfm.co.ua'])
skipping: [ssh.dev.rtfm.co.ua] => (item=[{'name': 'setevoy'}, 'dev.money.example.com'])
skipping: [ssh.dev.rtfm.co.ua] => (item=[{'name': 'setevoy'}, 'dev.use.example.com'])
changed: [ssh.dev.rtfm.co.ua] => (item=[{'name': 'setevoy'}, 'dev.monitor.example.com'])

TASK [letsencrypt : Start NGINX] ****
changed: [ssh.dev.rtfm.co.ua]

TASK [letsencrypt : Update renewal settings to web-root] ****
ok: [ssh.dev.rtfm.co.ua] => (item=[{'name': 'rtfm'}, 'dev.rtfm.co.ua'])
ok: [ssh.dev.rtfm.co.ua] => (item=[{'name': 'setevoy'}, 'dev.money.example.com'])
ok: [ssh.dev.rtfm.co.ua] => (item=[{'name': 'setevoy'}, 'dev.use.example.com'])
changed: [ssh.dev.rtfm.co.ua] => (item=[{'name': 'setevoy'}, 'dev.monitor.example.com'])

PLAY RECAP ****
ssh.dev.rtfm.co.ua      : ok=13   changed=5    unreachable=0    failed=0

Provisioning done.
[/simterm]
NGINX
Next – add virtual hosts configs for the monitor.example.com and dev.monitor.example.com – roles/nginx/templates/dev/dev.monitor.example.com.conf.j2 and roles/nginx/templates/production/monitor.example.com.conf.j2 respectively:
upstream prometheus_server {
    server 127.0.0.1:9091;
}

upstream grafana {
    server 127.0.0.1:3000;
}

server {

    listen 80;
    server_name  {{ item.1 }};

    # Lets Encrypt Webroot
    location ~ /.well-known {
    root /var/www/html;
        allow all;
    }

    location / {
        allow {{ office_allow_location }};
        allow {{ home_allow_location }};
        deny all;
        return 301 https://{{ item.1 }}$request_uri;
    }
}

server {

    listen       443 ssl;
    server_name  {{ item.1 }};

    access_log  /var/log/nginx/{{ item.1 }}-access.log;
    error_log /var/log/nginx/{{ item.1 }}-error.log warn;

    auth_basic_user_file {{ web_data_root_prefix }}/{{ item.0.name }}/.htpasswd_{{ item.0.name }};
    auth_basic "Password-protected Area";

    allow {{ office_allow_location }};
    allow {{ home_allow_location }};
    deny all;

    ssl_certificate /etc/letsencrypt/live/{{ item.1 }}/fullchain.pem;
    ssl_certificate_key /etc/letsencrypt/live/{{ item.1 }}/privkey.pem;

    ssl_protocols TLSv1 TLSv1.1 TLSv1.2;
    ssl_prefer_server_ciphers on;
    ssl_dhparam /etc/nginx/dhparams.pem;
    ssl_ciphers "EECDH+AESGCM:EDH+AESGCM:ECDHE-RSA-AES128-GCM-SHA256:AES256+EECDH:DHE-RSA-AES128-GCM-SHA256:AES256+EDH:ECDHE-RSA-AES256-GCM-SHA384:DHE-RSA-AES256-GCM-SHA384:ECDHE-RSA-AES256-SHA384:ECDHE-RSA-AES128-SHA256:ECDHE-RSA-AES256-SHA:ECDHE-RSA-AES128-SHA:DHE-RSA-AES256-SHA256:DHE-RSA-AES128-SHA256:DHE-RSA-AES256-SHA:DHE-RSA-AES128-SHA:ECDHE-RSA-DES-CBC3-SHA:EDH-RSA-DES-CBC3-SHA:AES256-GCM-SHA384:AES128-GCM-SHA256:AES256-SHA256:AES128-SHA256:AES256-SHA:AES128-SHA:DES-CBC3-SHA:HIGH:!aNULL:!eNULL:!EXPORT:!DES:!MD5:!PSK:!RC4";
    ssl_session_timeout 1d;
    ssl_stapling on;
    ssl_stapling_verify on;

    location / {

        proxy_redirect          off;
        proxy_set_header        Host            $host;
        proxy_set_header        X-Real-IP       $remote_addr;
        proxy_set_header        X-Forwarded-For $proxy_add_x_forwarded_for;
        proxy_pass http://grafana$request_uri;
    }

    location /prometheus {

        proxy_redirect          off;
        proxy_set_header        Host            $host;
        proxy_set_header        X-Real-IP       $remote_addr;
        proxy_set_header        X-Forwarded-For $proxy_add_x_forwarded_for;
        proxy_pass http://prometheus_server$request_uri;
    }

}
(see the OpenBSD: установка NGINX и настройки безопасности (Rus) post)
Templates are copied from the roles/nginx/tasks/main.yml using the same web_projects and domains lists:
...
- name: "Add NGINX virtualhosts configs"
  template:
    src: "templates/{{ env }}/{{ item.1 }}.conf.j2"
    dest: "/etc/nginx/conf.d/{{ item.1 }}.conf"
    owner: "root"
    group: "root"
    mode: 0644
  with_subelements:
    - "{{ web_projects }}"
    - domains
...
Run the script again:
[simterm]
$ ./ansible_exec.sh -t nginx

Tags: nginx
Env: rtfm-dev

...

TASK [nginx : NGINX test return code] ****
ok: [ssh.dev.rtfm.co.ua] => {
    "msg": "0"
}

TASK [nginx : Service NGINX restart and enable on boot] ****
changed: [ssh.dev.rtfm.co.ua]

PLAY RECAP ****
ssh.dev.rtfm.co.ua      : ok=13   changed=3    unreachable=0    failed=0
[/simterm]
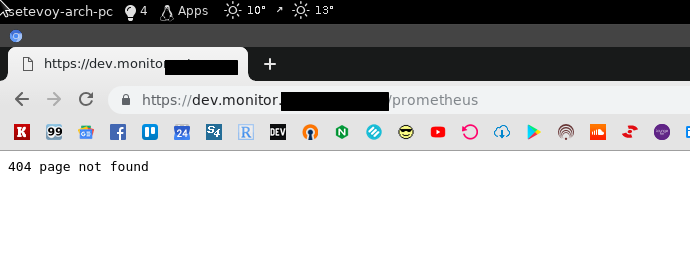
And now Prometheus must be working:
“404 page not found” – it’s from the Prometheus itself, need to update its settings a bit.
We are done with NGINX and SSL now – time to start configuring services.
prometheus-server configuration
Create a new template file roles/monitoring/templates/prometheus-server-conf.yml.j2:
global:

  scrape_interval:     15s
  external_labels:
    monitor: 'rtfm-monitoring-{{ env }}'

#alerting:
#  alertmanagers:
#  - static_configs:
#    - targets:
#      - alertmanager:9093

#rule_files:
#  - "alert.rules"

scrape_configs:

  - job_name: 'node-exporter'
    static_configs:
      - targets:
        - 'localhost:9100'
alerting is commented out for now – will add it later.
Add the template copy to the host:
...
- name: "Copy Prometheus server config {{ prometheus_home }}/prometheus-server-conf.yml"
  template:
    src: "templates/prometheus-server-conf.yml"
    dest: "{{ prometheus_home }}/prometheus-server-conf.yml"
    owner: "{{ prometheus_user }}"
    group:  "{{ prometheus_user }}"
    mode: 0644
...
Update the roles/monitoring/templates/prometheus-compose.yml.j2 – add the file mapping inside a container:
...
  prometheus-server:
    image: prom/prometheus
    networks:
      - prometheus
    ports:
      - 9091:9090
    volumes:
      - {{ prometheus_home }}/prometheus-server-conf.yml:/etc/prometheus.yml
    restart: unless-stopped
...
Deploy it all again:
[simterm]
$ ./ansible_exec.sh -t prometheus

Tags: prometheus
Env: rtfm-dev
...
TASK [monitoring : Start monitoring service] ****
changed: [ssh.dev.rtfm.co.ua]

PLAY RECAP ****
ssh.dev.rtfm.co.ua      : ok=7    changed=2    unreachable=0    failed=0

Provisioning done.
[/simterm]
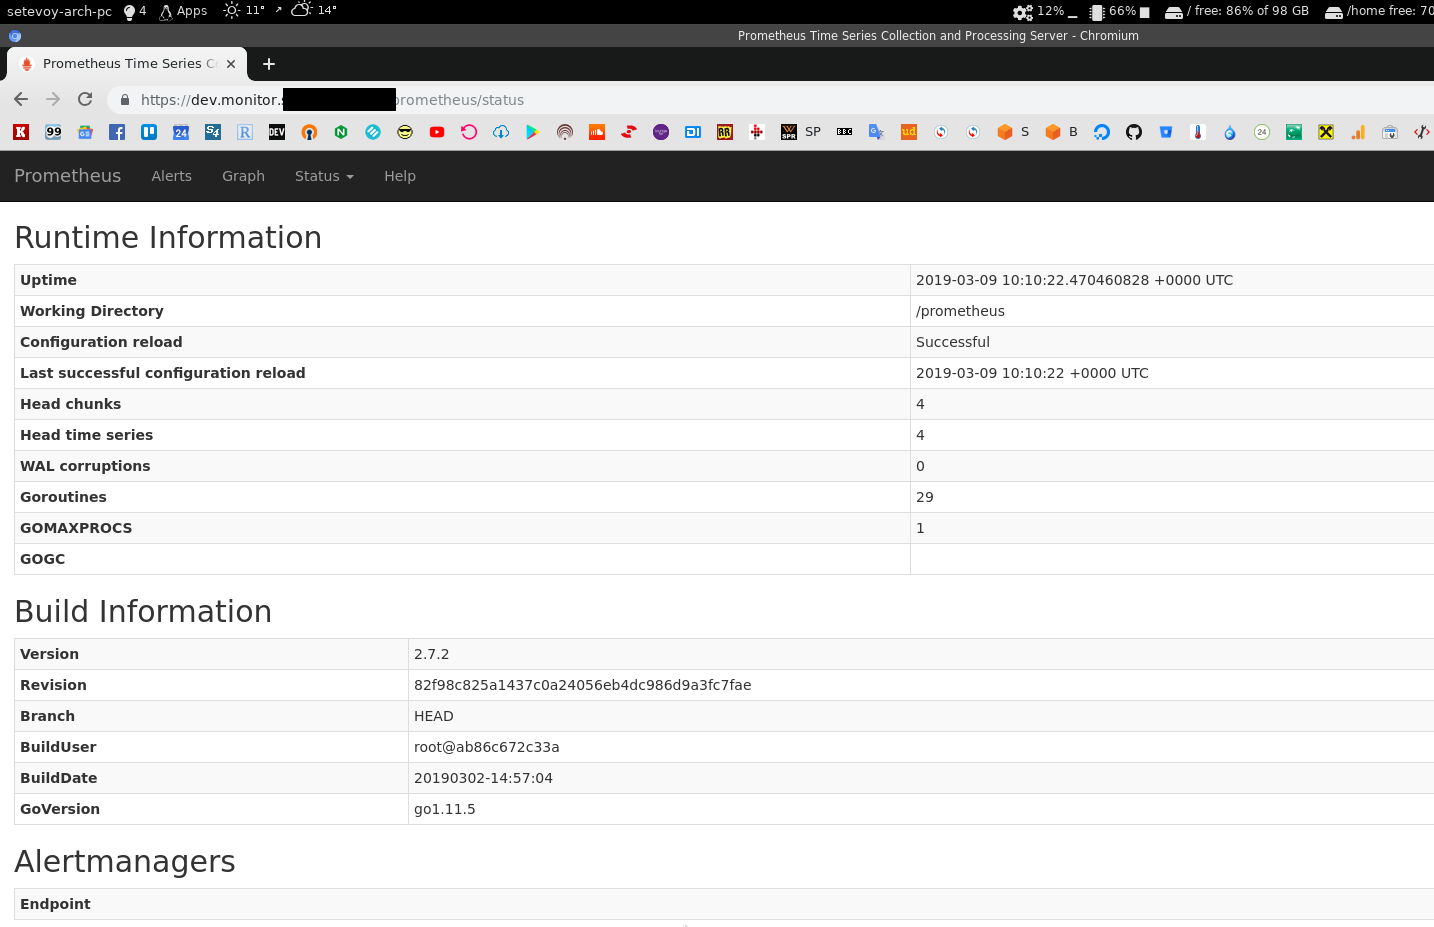
Check again – and still 404…
Ah, recalled – need to add the --web.external-url option. Although will have to add domain’s selector from the web_projects and domains as it is done in the nginx and letsencrypt.
Also, need to add the --config.file parameter.
Update Compose file and add the /data/prometheus mapping as well:
...
  prometheus-server:
    image: prom/prometheus
    networks:
      - prometheus
    ports:
      - 9091:9090
    volumes:
      - {{ prometheus_home }}/prometheus-server-conf.yml:/etc/prometheus.yml
      - {{ prometheus_data }}:/prometheus/data/
    command:
      - '--config.file=/etc/prometheus.yml'
      - '--web.external-url=https://{{ item.1 }}/prometheus'
    restart: always
...
In the template’s copy task add when condition with a domain’s selector:
...
- name: "Copy Compose file {{ prometheus_home }}/prometheus-compose.yml"
  template:
    src: "templates/prometheus-compose.yml.j2"
    dest: "{{ prometheus_home }}/prometheus-compose.yml"
    owner: "{{ prometheus_user }}"
    group:  "{{ prometheus_user }}"
    mode: 0644
  with_subelements:
    - "{{ web_projects }}"
    - domains
  when: "'monitor' in item.1.name"
...
Run again and:
prometheus-server_1 | level=error ts=2019-03-09T09:53:28.427567744Z caller=main.go:688 err=”opening storage failed: lock DB directory: open /prometheus/data/lock: permission denied”
Uh-huh…
Check the directory’s owner on the host:
[simterm]
root@rtfm-do-dev:/opt/prometheus# ls -l /data/
total 8
drwxr-xr-x 2 prometheus prometheus 4096 Mar  9 09:19 prometheus
[/simterm]
The user, used inside the container to run the service:
[simterm]
root@rtfm-do-dev:/opt/prometheus# docker exec -ti prometheus_prometheus-server_1 ps aux
PID   USER     TIME  COMMAND
    1 nobody    0:00 /bin/prometheus --config.file=/etc/prometheus.yml --web.ex
[/simterm]
Check the user’s ID in the container:
[simterm]
root@rtfm-do-dev:/opt/prometheus# docker exec -ti prometheus_prometheus-server_1 id nobody
uid=65534(nobody) gid=65534(nogroup) groups=65534(nogroup)
[/simterm]
And on the host:
[simterm]
root@rtfm-do-dev:/opt/prometheus# id nobody
uid=65534(nobody) gid=65534(nogroup) groups=65534(nogroup)
[/simterm]
They are the same – perfect. Update the /data/prometheus owner in the roles/monitoring/templates/prometheus-compose.yml.j2:
...
- name: "Create Prometehus TSDB data dir {{ prometheus_data }}"
  file:
    path: "{{ prometheus_data }}"
    state: directory
    owner: "nobody"
    group: "nogroup"
    recurse: yes
...
Redeploy again – and voila!
Next, have to update targets – now prometheus-server can’t connect to the node_exporter:
Because configs are copy-pasted from the work project)
Update the roles/monitoring/templates/prometheus-server-conf.yml.j2 – change the localhost value:
...
scrape_configs:

  - job_name: 'node-exporter'
    static_configs:
      - targets:
        - 'localhost:9100'
...
To the container’s name as it is set in the Compose-file – node-exporter:
Seems that’s all..?
Ah, no – need to check if node_exporter able to get partitions metrics:
Nope… There is only root partition in the node_filesystem_avail_bytes.
Need to recall why this happens – already faced a few times.
node_exporter configuration
Read docs here – https://github.com/prometheus/node_exporter#using-docker.
Update the Compose file and add the bind-mount == rslave and the path.rootfs with the /rootfs value (as we are mapping “/” from the host as “/rootfs” to the container):
...
  node-exporter:
    image: prom/node-exporter
    networks:
      - prometheus
    ports:
      - 9100:9100
    volumes:
      - /proc:/host/proc:ro
      - /sys:/host/sys:ro
      - /:/rootfs:ro,rslave
    command:
      - '--path.rootfs=/rootfs'
      - '--path.procfs=/host/proc'
      - '--path.sysfs=/host/sys'
      - --collector.filesystem.ignored-mount-points
      - "^/(sys|proc|dev|host|etc|rootfs/var/lib/docker/containers|rootfs/var/lib/docker/overlay2|rootfs/run/docker/netns|rootfs/var/lib/docker/aufs)($$|/)"
    restart: unless-stopped
    mem_limit: 500m
Restart the service and check mount points now:
[simterm]
root@rtfm-do-dev:/opt/prometheus# curl -s localhost:9100/metrics | grep sda
node_disk_io_now{device="sda"} 0
node_disk_io_time_seconds_total{device="sda"} 0.044
node_disk_io_time_weighted_seconds_total{device="sda"} 0.06
node_disk_read_bytes_total{device="sda"} 7.448576e+06
node_disk_read_time_seconds_total{device="sda"} 0.056
node_disk_reads_completed_total{device="sda"} 232
node_disk_reads_merged_total{device="sda"} 0
node_disk_write_time_seconds_total{device="sda"} 0.004
node_disk_writes_completed_total{device="sda"} 1
node_disk_writes_merged_total{device="sda"} 0
node_disk_written_bytes_total{device="sda"} 4096
node_filesystem_avail_bytes{device="/dev/sda1",fstype="ext4",mountpoint="/backups"} 4.910125056e+09
node_filesystem_device_error{device="/dev/sda1",fstype="ext4",mountpoint="/backups"} 0
node_filesystem_files{device="/dev/sda1",fstype="ext4",mountpoint="/backups"} 327680
node_filesystem_files_free{device="/dev/sda1",fstype="ext4",mountpoint="/backups"} 327663
node_filesystem_free_bytes{device="/dev/sda1",fstype="ext4",mountpoint="/backups"} 5.19528448e+09
node_filesystem_readonly{device="/dev/sda1",fstype="ext4",mountpoint="/backups"} 0
node_filesystem_size_bytes{device="/dev/sda1",fstype="ext4",mountpoint="/backups"} 5.216272384e+09
[/simterm]
Looks like OK now…
I’m getting a bit sick, to be honest…
Now, when I’m updating this post from drafts – all looks like so simple and easy… In reality even having all configs, examples and knowing what and how to do – it took a while to make it all working…
Okay, what’s left
Ah…
Grafana, Loki, promtail and alertmanager.
OMG…
Let’s have some tea.
Now, let’s proceed quickly.
Need to create a dedicated directory inside the /data – /data/monitoring and make others inside it for Prometheus, Grafana, and Loki.
Update the prometheus_data variable:
...
prometheus_data: "/data/monitoring/prometheus"
...
Add variables for Grafana and Loki:
...
loki_data: "/data/monitoring/loki"
grafana_data: "/data/monitoring/grafana"
...
Add their creation in the roles/monitoring/tasks/main.yml:
...
- name: "Create Loki's data dir {{ loki_data }}"
  file:
    path: "{{ loki_data }}"
    state: directory
    owner: "{{ prometheus_user }}"
    group: "{{ prometheus_user }}"
    recurse: yes

- name: "Create Grafana DB dir {{ grafana_data }}"
  file:
    path: "{{ grafana_data }}"
    state: directory
    owner: "{{ prometheus_user }}"
    group: "{{ prometheus_user }}"
    recurse: yes
...
Loki
Add Loki to the Compose template:
...
  loki:
    image: grafana/loki:master
    networks:
      - prometheus
    ports:
      - "3100:3100"
    volumes:
      - {{ prometheus_home }}/loki-conf.yml:/etc/loki/local-config.yaml
      - {{ loki_data }}:/tmp/loki/
    command: -config.file=/etc/loki/local-config.yaml
    restart: unless-stopped
...
Create a new template roles/monitoring/templates/loki-conf.yml.j2 – just default, without DynamoDB and S3 – will store everything it the /data/monitoring/loki:
auth_enabled: false
server:
  http_listen_port: 3100

ingester:
  lifecycler:
    address: 0.0.0.0
    ring:
      store: inmemory
      replication_factor: 1
  chunk_idle_period: 15m

schema_config:
  configs:
  - from: 0
    store: boltdb
    object_store: filesystem
    schema: v9
    index:
      prefix: index_
      period: 168h

storage_config:
  boltdb:
    directory: /tmp/loki/index

  filesystem:
    directory: /tmp/loki/chunks

limits_config:
  enforce_metric_name: false
Add file’s copy to the roles/monitoring/tasks/main.yml:
...
- name: "Copy Loki config {{ prometheus_home }}/loki-conf.yml"
  template:
    src: "templates/loki-conf.yml.j2"
    dest: "{{ prometheus_home }}/loki-conf.yml"
    owner: "{{ prometheus_user }}"
    group:  "{{ prometheus_user }}"
    mode: 0644
...
Grafana
And Grafana now:
...
  grafana:
    image: grafana/grafana:6.0.0
    ports:
      - "3000:3000"
    networks:
      - prometheus
    depends_on:
      - loki
    restart: unless-stopped
...
Will add catalogs and configs later.
Deploy, check:
Cool – Grafana already works, just need to update its configs
Create a new template and here is only next parameters are needed:
...
[auth.basic]
enabled = false
...
[security]
# default admin user, created on startup
admin_user = {{ grafana_ui_username }}

# default admin password, can be changed before first start of grafana,  or in profile settings
admin_password = {{ grafana_ui_dashboard_admin_pass }}
...
As far as I remember – didn’t update anything else here.
Let’s check on my work Production server:
[simterm]
admin@monitoring-production:~$ cat /etc/grafana/grafana.ini | grep -v \# | grep -v ";" | grep -ve '^$'
[paths]
[server]
[database]
[session]
[dataproxy]
[analytics]
[security]
admin_user = user
admin_password = pass
[snapshots]
[users]
[auth]
[auth.anonymous]
[auth.github]
[auth.google]
[auth.generic_oauth]
[auth.grafana_com]
[auth.proxy]
[auth.basic]
enabled = false
[auth.ldap]
[smtp]
[emails]
[log]
[log.console]
[log.file]
[log.syslog]
[event_publisher]
[dashboards.json]
[alerting]
[metrics]
[metrics.graphite]
[tracing.jaeger]
[grafana_com]
[external_image_storage]
[external_image_storage.s3]
[external_image_storage.webdav]
[external_image_storage.gcs]
[/simterm]
Yup, correct.
Generate a password:
[simterm]
$ pwgen 12 1
Foh***ae1
[/simterm]
Encrypt it using the ansible-vault:
[simterm]
$ ansible-vault encrypt_string
New Vault password:
Confirm New Vault password:
Reading plaintext input from stdin. (ctrl-d to end input)
Foh***ae1!vault |
          $ANSIBLE_VAULT;1.1;AES256
          38306462643964633766373435613135386532373133333137653836663038653538393165353931
          ...
          6636633634353131350a343461633265353461386561623233636266376266326337383765336430
          3038
Encryption successful
[/simterm]
Create grafana_ui_username and grafana_ui_dashboard_admin_pass variables:
...
# MONITORING
prometheus_home: "/opt/prometheus"
prometheus_user: "prometheus"
# data dirs
prometheus_data: "/data/monitoring/prometheus"
loki_data: "/data/monitoring/loki"
grafana_data: "/data/monitoring/grafana"
grafana_ui_username: "setevoy"
grafana_ui_dashboard_admin_pass: !vault |
          $ANSIBLE_VAULT;1.1;AES256
          38306462643964633766373435613135386532373133333137653836663038653538393165353931
          ...
          6636633634353131350a343461633265353461386561623233636266376266326337383765336430
          3038
Create Grafana’s config template roles/monitoring/templates/grafana-conf.yml.j2:
[paths]
[server]
[database]
[session]
[dataproxy]
[analytics]
[security]
admin_user = {{ grafana_ui_username }}
admin_password = {{ grafana_ui_dashboard_admin_pass }}
[snapshots]
[users]
[auth]
[auth.anonymous]
[auth.github]
[auth.google]
[auth.generic_oauth]
[auth.grafana_com]
[auth.proxy]
[auth.basic]
enabled = false
[auth.ldap]
[smtp]
[emails]
[log]
[log.console]
[log.file]
[log.syslog]
[event_publisher]
[dashboards.json]
[alerting]
[metrics]
[metrics.graphite]
[tracing.jaeger]
[grafana_com]
[external_image_storage]
[external_image_storage.s3]
[external_image_storage.webdav]
[external_image_storage.gcs]
Add its copying:
...
- name: "Copy systemd service file /etc/systemd/system/prometheus.service"
  template:
    src: "templates/prometheus.service.j2"
    dest: "/etc/systemd/system/prometheus.service"
    owner: "root"
    group:  "root"
    mode: 0644
...
Add its mapping inside the container in the Compose file:
...
  grafana:
    image: grafana/grafana:6.0.0
    ports:
      - "3000:3000"
    volumes:
      - {{ prometheus_home }}/grafana-conf.yml:/etc/grafana/grafana.ini
      - {{ grafana_data }}:/var/lib/grafana
...
Also, have to add the {{ prometheus_home }}/provisioning mapping – Grafana will keep its provisioning configs here, but this can be done later.
Deploy, check:
GF_PATHS_DATA=’/var/lib/grafana’ is not writable.
You may have issues with file permissions, more information here: http://docs.grafana.org/installation/docker/#migration-from-a-previous-version-of-the-docker-container-to-5-1-or-later
mkdir: cannot create directory ‘/var/lib/grafana/plugins’: Permission denied
Hu%^%*@d(&!!!
Read the documentation:
default user id 472 instead of 104
Ah, yes, recalled now.
Add the grafana user’s creation with its own UID.
Add new variables:
...
grafana_user: "grafana"
grafana_uid: 472
Add user and group creation:
- name: "Add Prometheus user"
  user:
    name: "{{ prometheus_user }}"
    shell: "/usr/sbin/nologin"

- name: "Create Grafana group {{ grafana_user }}"
  group:
    name: "{{ grafana_user }}"
    gid: "{{ grafana_uid }}"

- name: "Create Grafana's user {{ grafana_user }} with UID {{ grafana_uid }}"
  user:
    name: "{{ grafana_user }}"
    uid: "{{ grafana_uid }}"
    group: "{{ grafana_user }}"
    shell: "/usr/sbin/nologin"
...
And change the {{ grafana_data }} owner:
...
- name: "Create Grafana DB dir {{ grafana_data }}"
  file:
    path: "{{ grafana_data }}"
    state: directory
    owner: "{{ grafana_user }}"
    group: "{{ grafana_user }}"
    recurse: yes
...
Redeploy again, check:
Yay!)
But we have no logs yet as promtail is not added.
Beside this – need to add a datasource configuration for the Grafana.
Add the {{ prometheus_home }}/grafana-provisioning/datasources creation:
...
- name: "Create {{ prometheus_home }}/grafana-provisioning/datasources directory"
  file:
    path: "{{ prometheus_home }}/grafana-provisioning/datasources"
    owner: "{{ grafana_user }}"
    group: "{{ grafana_user }}"
    mode: 0755
    state: directory
...
Add its mapping:
...
  grafana:
    image: grafana/grafana:6.0.0
    ports:
      - "3000:3000"
    volumes:
      - {{ prometheus_home }}/grafana-conf.yml:/etc/grafana/grafana.ini
      - {{ prometheus_home }}/grafana-provisioning:/etc/grafana/
      - {{ grafana_data }}:/var/lib/grafana
...
Deploy and check data inside the Grafana’s container:
[simterm]
root@rtfm-do-dev:/opt/prometheus# docker exec -ti prometheus_grafana_1 sh
$ ls -l /etc/grafana
total 8
drwxr-xr-x 2 grafana grafana 4096 Mar  9 11:46 datasources
-rw-r--r-- 1    1003    1003  571 Mar  9 11:26 grafana.ini
[/simterm]
Okay.
Next – let’s add Loki’s data source – roles/monitoring/templates/grafana-datasources.yml.j2 (check the Grafana: добавление datasource из Ansible (Rus) post):
# config file version
apiVersion: 1

deleteDatasources:
  - name: Loki

datasources:
- name: Loki
  type: loki
  access: proxy
  url: http://loki:3100
  isDefault: true
  version: 1
Its copying to the server:
...
- name: "Copy Grafana datasources config {{ prometheus_home }}/grafana-provisioning/datasources/datasources.yml"
  template:
    src: "templates/grafana-datasources.yml.j2"
    dest: "{{ prometheus_home }}/grafana-provisioning/datasources/datasources.yml"
    owner: "{{ grafana_user }}"
    group: "{{ grafana_user }}"
...
Deploy, check:
t=2019-03-09T11:52:35+0000 lvl=eror msg=”can’t read datasource provisioning files from directory” logger=provisioning.datasources path=/etc/grafana/provisioning/datasources error=”open /etc/grafana/provisioning/datasources: no such file o
r directory”
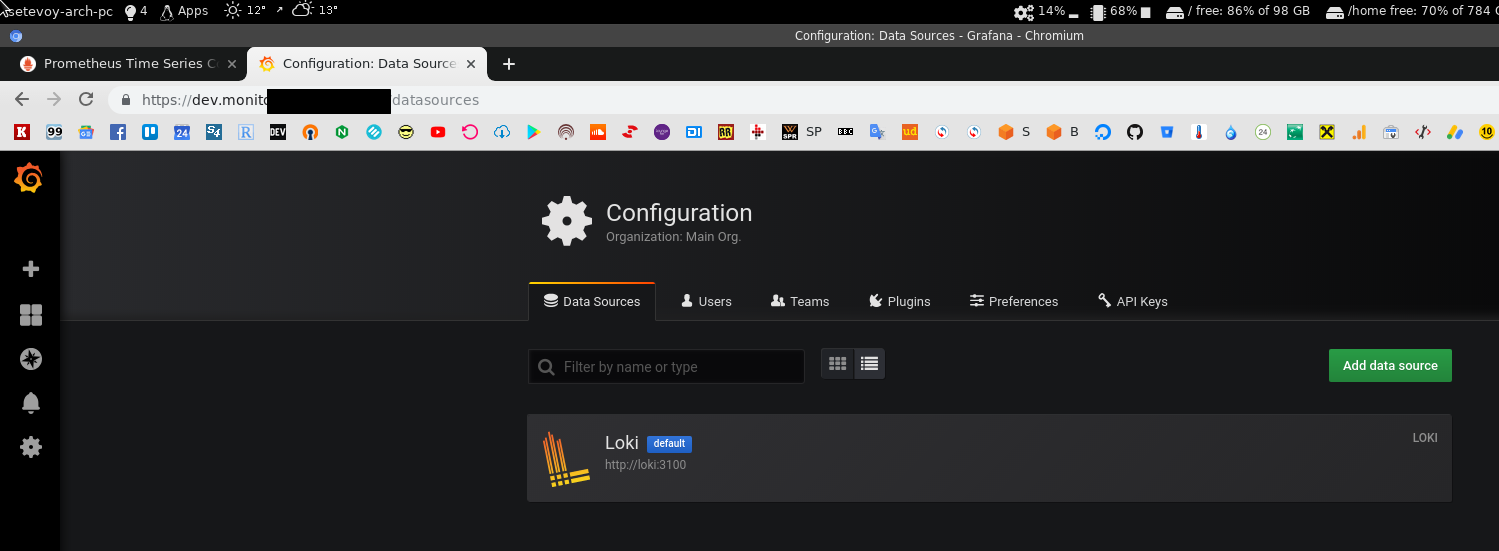
Ah, well.
Fix the path in the Compose – {{ prometheus_home }}/grafana-provisioning must be mapped as /etc/grafana/provisioning – not just inside the /etc/grafana:
...
    volumes:
      - {{ prometheus_home }}/grafana-conf.yml:/etc/grafana/grafana.ini
      - {{ prometheus_home }}/grafana-provisioning:/etc/grafana/provisioning
      - {{ grafana_data }}:/var/lib/grafana
...
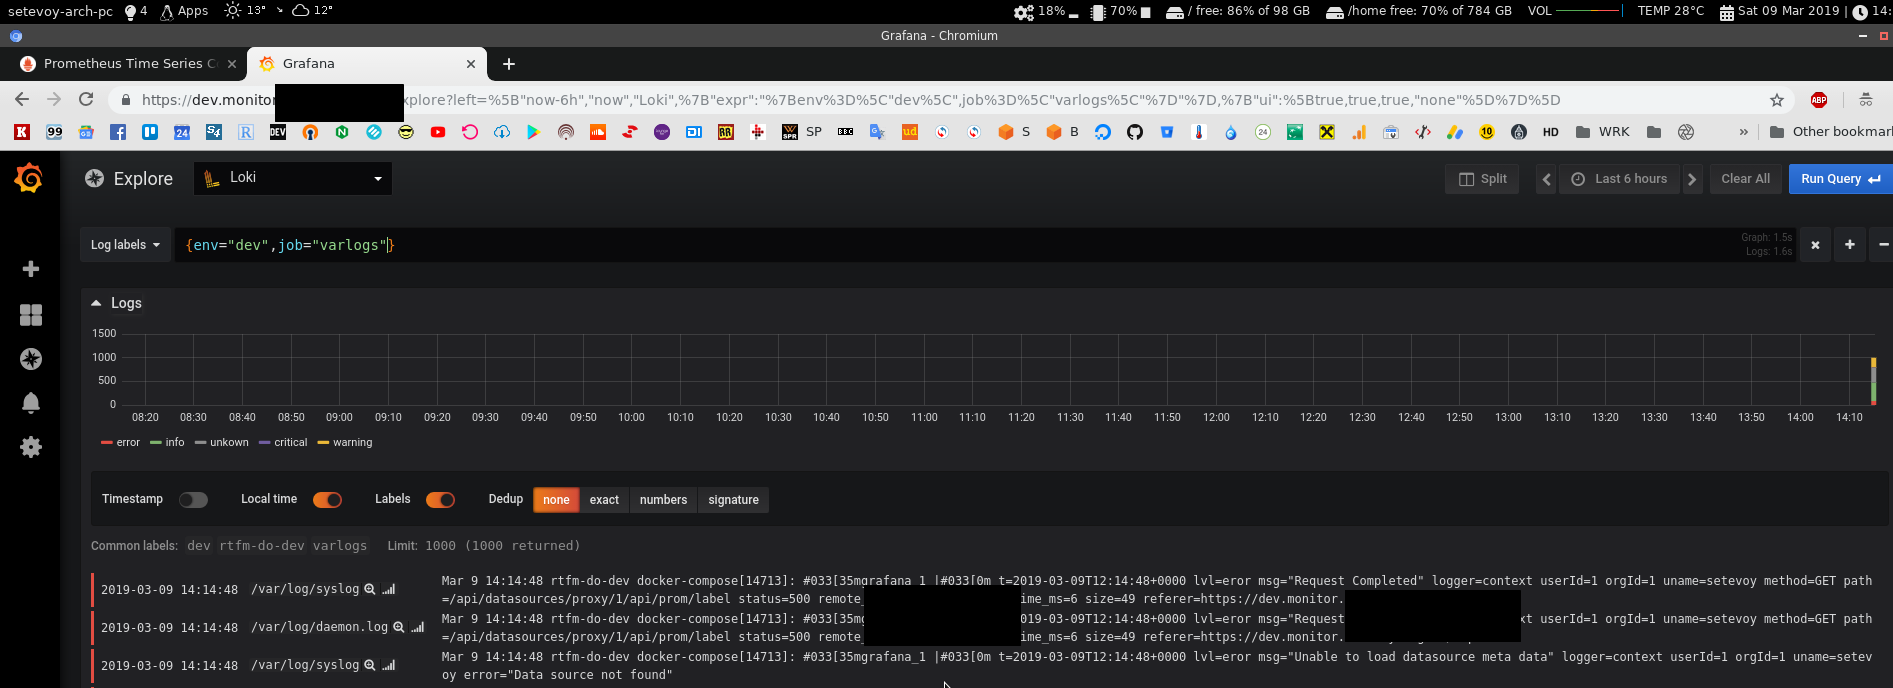
Redeploy again, and now all works here:
promtail.
Add a new container with the promtail.
And then alertmanager and configure its alerts… Don’t think will finish it today.
I’m not sure about the positions.yaml file for the promtail – does it needs to be mapped from the host to be persistent or not?
But as I didn’t make it on job’s Production, then maybe it’s not critical as I’m sure I did ask about it in the Grafana’s Slack community but can’t find this thread now.
For now, let’s skip it:
...
  promtail:
    image: grafana/promtail:master
    volumes:
      - {{ prometheus_home }}/promtail-conf.yml:/etc/promtail/docker-config.yaml
#      - {{ prometheus_home }}/promtail-positions.yml:/tmp/positions.yaml
      - /var/log:/var/log
    command: -config.file=/etc/promtail/docker-config.yaml
Create the roles/monitoring/templates/promtail-conf.yml.j2 template:
server:

  http_listen_port: 9080
  grpc_listen_port: 0

positions:

  filename: /tmp/positions.yaml

client:

  url: http://loki:3100/api/prom/push

scrape_configs:

  - job_name: system
    entry_parser: raw
    static_configs:
    - targets:
        - localhost
      labels:
        job: varlogs
        env: {{ env }}
        host: {{ set_hostname }}
        __path__: /var/log/*log

  - job_name: nginx
    entry_parser: raw
    static_configs:
    - targets:
        - localhost
      labels:
        job: nginx
        env: {{ env }}
        host: {{ set_hostname }}
        __path__: /var/log/nginx/*log
Here:
url: http://loki:3100/api/prom/push– URL aka container’s name with Loki, which will be used bypromtailtoPUSHits dataenv: {{ env }}иhost: {{ set_hostname }}– additional tags, they are set in thegroup_vars/rtfm-dev.ymlandgroup_vars/rtfm-production.yml:
env: dev
set_hostname: rtfm-do-dev
Add the file’s copy:
...
- name: "Copy Promtail config {{ prometheus_home }}/promtail-conf.yml"
  template:
    src: "templates/promtail-conf.yml.j2"
    dest: "{{ prometheus_home }}/promtail-conf.yml"
    owner: "{{ prometheus_user }}"
    group: "{{ prometheus_user }}"
...
Deploy:
level=info ts=2019-03-09T12:09:07.709299788Z caller=tailer.go:78 msg=”start tailing file” path=/var/log/user.log
2019/03/09 12:09:07 Seeked /var/log/bootstrap.log – &{Offset:0 Whence:0}
level=info ts=2019-03-09T12:09:07.709435374Z caller=tailer.go:78 msg=”start tailing file” path=/var/log/bootstrap.log
2019/03/09 12:09:07 Seeked /var/log/dpkg.log – &{Offset:0 Whence:0}
level=info ts=2019-03-09T12:09:07.709746566Z caller=tailer.go:78 msg=”start tailing file” path=/var/log/dpkg.log
level=warn ts=2019-03-09T12:09:07.710448913Z caller=client.go:172 msg=”error sending batch, will retry” status=-1 error=”Post http://loki:3100/api/prom/push: dial tcp: lookup loki on 127.0.0.11:53: no such host”
level=warn ts=2019-03-09T12:09:07.726751418Z caller=client.go:172 msg=”error sending batch, will retry” status=-1 error=”Post http://loki:3100/api/prom/push: dial tcp: lookup loki on 127.0.0.11:53: no such host”
Right…
promtail now is able to tail logs – but can’t see Loki…
Why?
Ah, because need to add thedepends on.
Update Compose file and add for the promtail:
...
    depends_on:
      - loki
Nope, didn’t help…
What else?…
Ah! Networks!
And again – config was copied from the working setup and it’s a bit differs.
Add the networks to the Compose:
...
  promtail:
    image: grafana/promtail:master
    networks:
      - prometheus
    volumes:
      - /opt/prometheus/promtail-conf.yml:/etc/promtail/docker-config.yaml
#      - /opt/prometheus/promtail-positions.yml:/tmp/positions.yaml
      - /var/log:/var/log
    command: -config.file=/etc/promtail/docker-config.yaml
    depends_on:
      - loki
Aaaaaaand:
“It works!” (c)
Well.
That’s enough for now
Alertmanager and Slack integration can be found in the Prometehus: обзор — federation, мониторинг Docker Swarm и настройки Alertmanager (Rus) post.
And now I’ll go to have some breakfast as I started doing this setup about 9 am and now it’s 2 pm 🙂
![]()
