 Let’s proceed with the Loki system.
First post of this series – Grafana Labs: Loki – logs collecting and monitoring system and the second one – Grafana Labs: Loki – distributed system, labels and filters.
There is the Grafana’s Slack community with the dedicated #loki channel where you can ask for some assist (and it’s really helpful).
The task for today is to configure Loki to use AWS S3 as persistent storage for data and AWS DynamoDB to store indexes used by Loki.
Some documentation available here>>>.
Contents
Storage config
With the default configuration – Loki will store data inside its container in the /tmp/loki directory:
[simterm]
root@ip-172-31-38-97:/home/admin# docker exec -ti admin_loki_1 ls -l /tmp/loki/
total 24
drwxr-xr-x    2 root     root         20480 Feb 11 11:32 chunks
drwxr-xr-x    2 root     root          4096 Feb  7 12:43 index
[/simterm]
And settings are configured in the storage_config section:
[simterm]
root@ip-172-31-38-97:/home/admin# docker exec -ti admin_loki_1 cat /etc/loki/local-config.yaml | grep -A 5 storage_config
storage_config:
  boltdb:
    directory: /tmp/loki/index

  filesystem:
    directory: /tmp/loki/chunks
[/simterm]
What we have to do now – is to create an AWS S3 bucket, AWS DynamoDB table and to update the Loki’s configuration.
AWS S3
As AWS S3 creation is the most simple part – let’s start here.
The creation process is out of the scope of this post – you can find examples here>>> and here>>>.
Create a bucket and update Loki’s configuration on the loki.setevoy.org.ua host (created in the previous post) – change the storage_config section here:
...
storage_config:
  boltdb:
    directory: /tmp/loki/index

#  filesystem:
#    directory: /tmp/loki/chunks
  aws:
     s3: s3://AKI***PHA:0/W***WFN@eu-west-1/logger-loki-poc

limits_config:
  enforce_metric_name: false
Don’t think it will work right now – but let’s try:
[simterm]
root@ip-172-31-38-97:/home/admin# docker-compose -f loki-compose.yml up
Creating network "admin_default" with the default driver
Creating admin_loki_1 ... done
Attaching to admin_loki_1
loki_1  | level=info ts=2019-02-11T12:41:36.891679717Z caller=loki.go:122 msg=initialising module=server
loki_1  | level=info ts=2019-02-11T12:41:36.892371631Z caller=gokit.go:36 http=[::]:3100 grpc=[::]:9095 msg="server listening on addresses"
loki_1  | level=info ts=2019-02-11T12:41:36.892882132Z caller=loki.go:122 msg=initialising module=overrides
loki_1  | level=info ts=2019-02-11T12:41:36.893212712Z caller=override.go:33 msg="per-tenant overides disabled"
loki_1  | level=info ts=2019-02-11T12:41:36.893613967Z caller=loki.go:122 msg=initialising module=store
loki_1  | level=error ts=2019-02-11T12:41:36.894199922Z caller=main.go:41 msg="error initialising loki" err="error initialising module: store: error creating object client: mkdir : no such file or directory"
admin_loki_1 exited with code 1
[/simterm]
Well – okay, let’s go to the DynamoDB.
DynamoDB
Check the documentation here about fields used by Loki – operations.md.
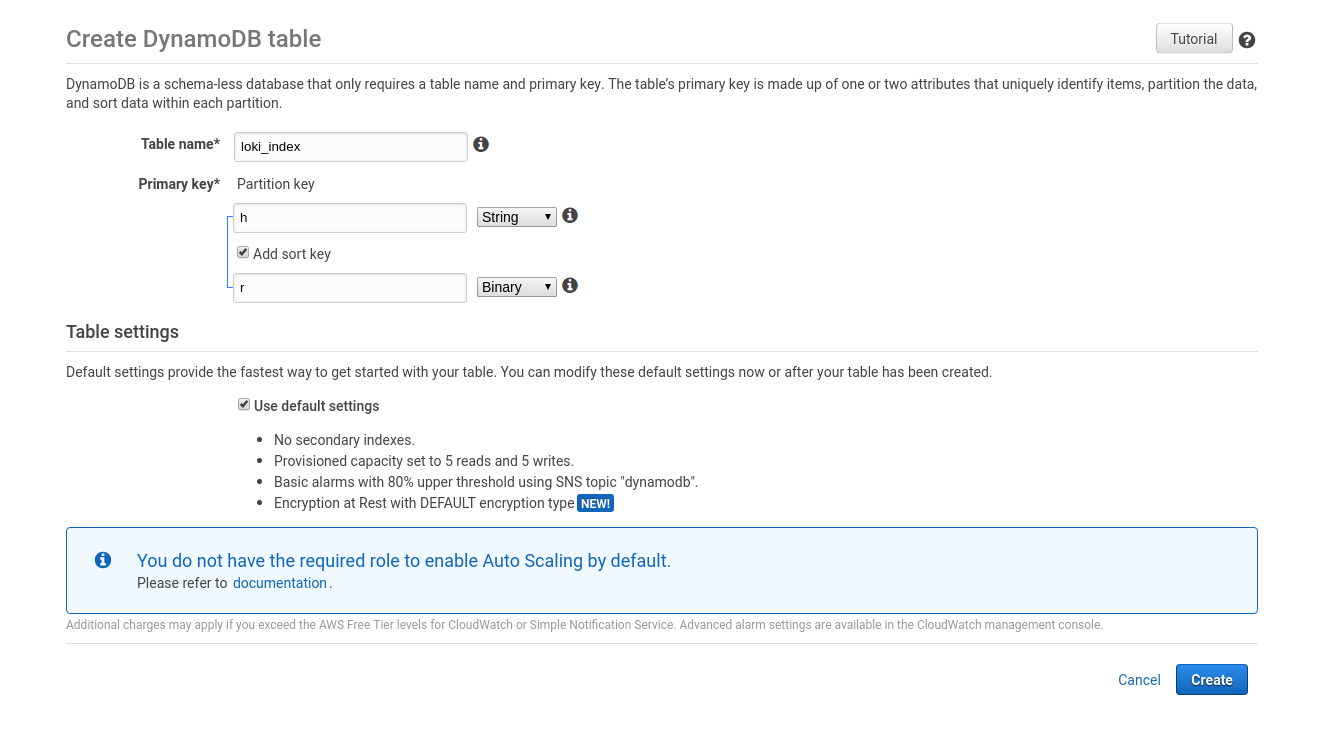
Create a new table with the Primary key called “h” name and String type and the Sort key named “r” of the Binary type (don’t ask me why such a names 🙂 ):
Update your Loki’s config loki-conf.yml– now it has to look like this:
auth_enabled: false

server:
  http_listen_port: 3100

ingester:
  lifecycler:
    address: 0.0.0.0
    ring:
      store: inmemory
      replication_factor: 1
  chunk_idle_period: 15m

#schema_config:
#  configs:
#  - from: 0
#    store: boltdb
#    object_store: filesystem
#    schema: v9
#    index:
#      prefix: index_
#      period: 168h

schema_config:
  configs:
  - from: 0
    store: aws
    object_store: aws
    schema: v9
    index:
      prefix: loki_index
      period: 0

storage_config:

#  boltdb:
#    directory: /tmp/loki/index

#  filesystem:
#    directory: /tmp/loki/chunks

  aws:
     s3: s3://AKI***PHA:0/W***WFN@eu-west-1/logger-loki-poc
     dynamodbconfig:
       dynamodb: dynamodb://AKI***Y7A:lTH***zg4@eu-west-1

limits_config:
  enforce_metric_name: false
Note: the SECRET_KEY parser doesn’t work(ed?) properly and deletes “0/” and “/” symbols so had to generate new ACCEES:SECRETkey pair. Issue: https://github.com/grafana/loki/issues/310
Start the service:
[simterm]
root@ip-172-31-38-97:/home/admin# docker-compose -f loki-compose.yml up -d
Starting admin_loki_1 ... done
[/simterm]
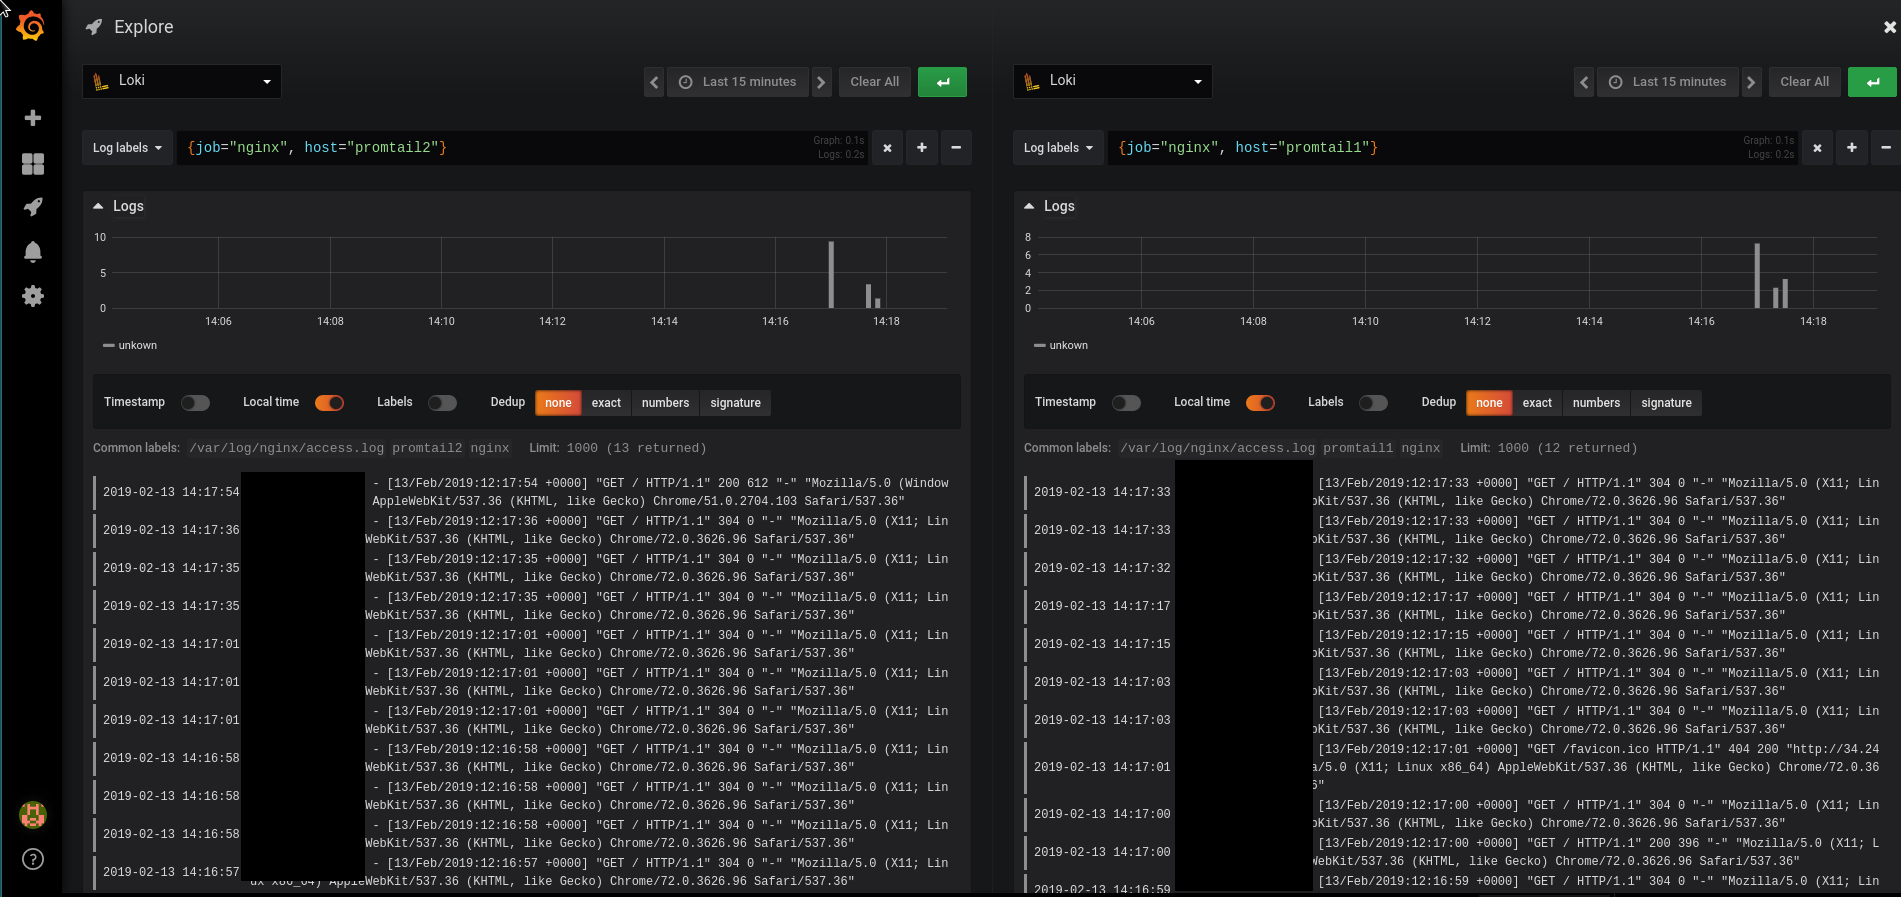
Wait a couple of minutes and check your Grafana (here is the Split feature used):
Okay – the data is present, but the S3 bucket is empty… And no indexes in the DynamoDB…
Also, there are errors in Loki’s container output:
loki_1 | level=error ts=2019-02-13T12:05:57.928786555Z caller=flush.go:118 org_id=fake msg=”failed to flush user” err=”NoCredentialProviders: no valid providers in chain. Deprecated.\n\tFor verbose messaging see aws.Config.CredentialsCha
inVerboseErrors”
Solved it by using the same ACCESS:SECRET key pair for both S3 and DynamoDB configs.
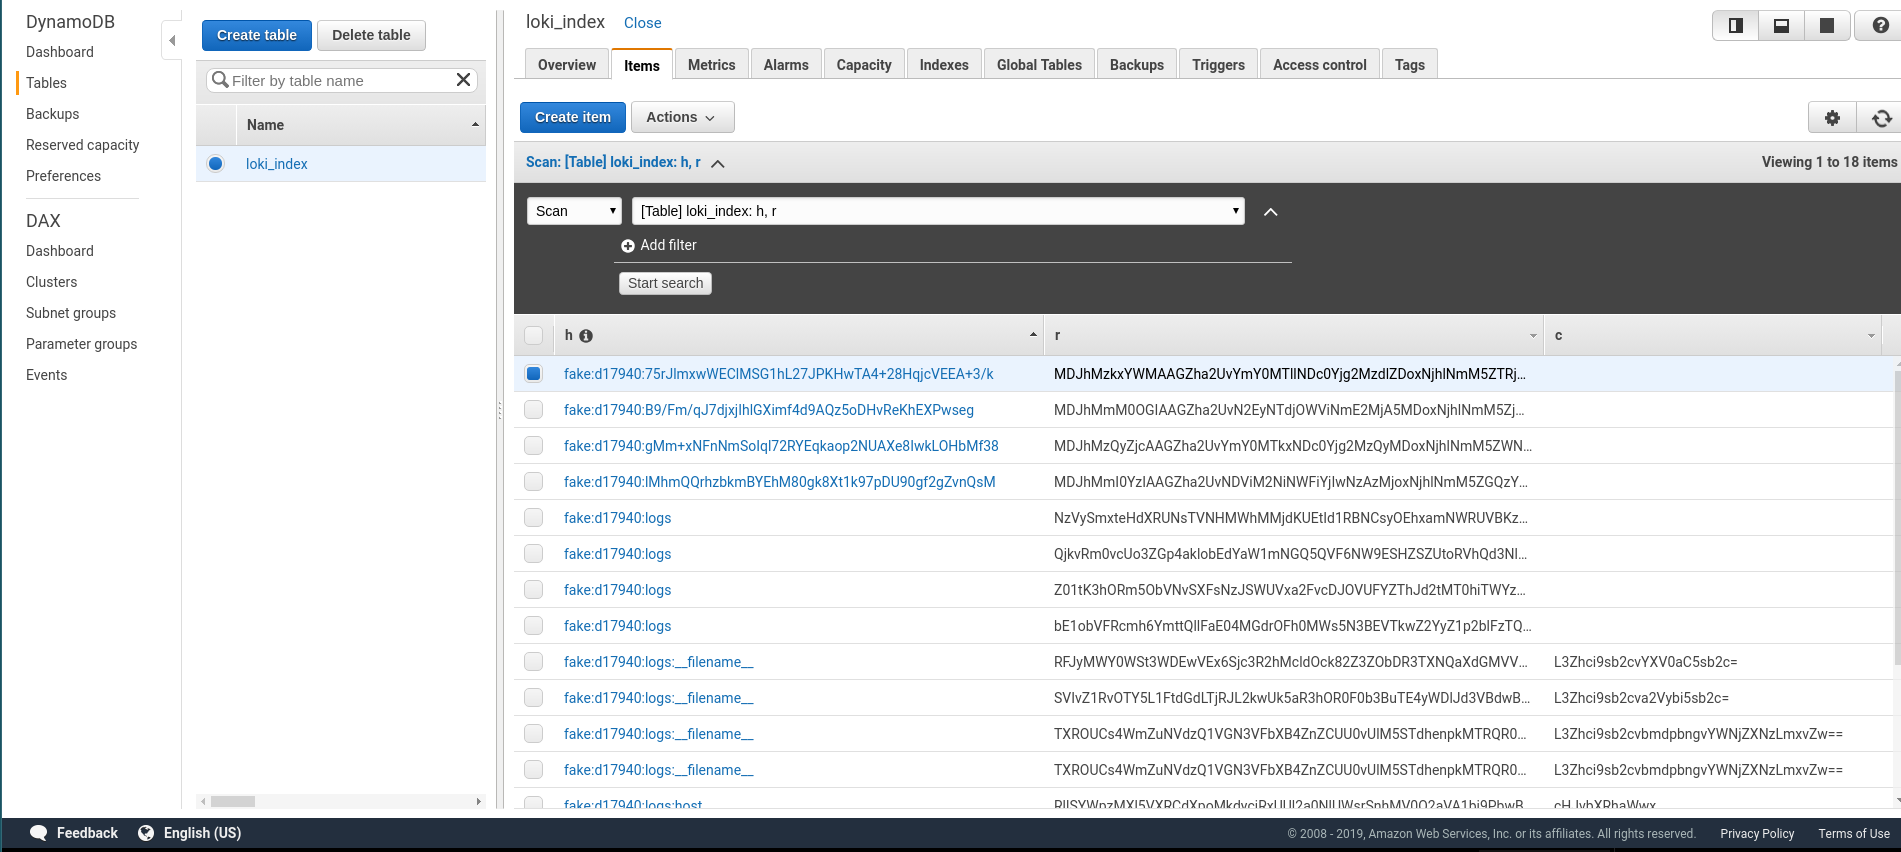
And data in the S3 and DynamoDB appeared after ~ 15 minutes:
AWS S3:
[simterm]
$ aws s3 ls s3://logger-loki-poc/fake --profile loki-poc --recursive
2019-02-13 14:32:18       1048 fake/45b3cb5abb207032:168e6c9dd3c:168e6c9e4c2:fb4b2bc6
2019-02-13 14:32:18        419 fake/7a257c9eb6a62090:168e6c9f488:168e6c9f48b:a1a29aa7
2019-02-13 14:32:48        688 fake/bf4191474b863420:168e6c9ecc1:168e6ca72f7:deeb5910
2019-02-13 14:33:18        730 fake/bf419e474b8637ed:168e6c9e4c1:168e6cac1ac:824c11f9
[/simterm]
All good so far.
P.S. After all – I’m using Loki with my current Monitoring Production stack, just with two Grafana’s instances – one is the current Stable version for Prometheu’s and CloudWatch dashboards and the second one – with the Grafana 6.0 Beta version for logs. Will “merge” them after Grafana 6.0 will be released:
admin@monitoring-production:~$ cat /opt/prometheus/prometheus-compose.yml
version: '3.3'

networks:
  prometheus:

services:

  prometheus-server:
    image: prom/prometheus
    networks:
      - prometheus
    ports:
      - 9090:9090
    volumes:
      - /etc/prometheus/prometheus-server-conf.yml:/etc/prometheus.yml
      - /etc/prometheus/alert.rules:/etc/alert.rules
      - /data/prometheus:/prometheus/data/
    command:
      - '--config.file=/etc/prometheus.yml'
      - '--web.external-url=https://monitor.example.com/prometheus'
    restart: always

  grafana-ui:

    image: grafana/grafana
    networks:
     - prometheus
    ports:
    - 3000:3000
    volumes:
      - /etc/grafana:/etc/grafana/
      - /data/grafana:/var/lib/grafana
    depends_on:
      - prometheus-server

...

  loki:
    image: grafana/loki:master
    networks:
      - prometheus
    ports:
      - "3100:3100"
    volumes:
      - /data/loki/loki-conf.yml:/etc/loki/local-config.yaml
    command: -config.file=/etc/loki/local-config.yaml
    restart: unless-stopped

  grafana-loki:
    image: grafana/grafana:master
    ports:
      - "3001:3000"
    networks:
      - prometheus
    volumes:
      - /data/loki:/etc/grafana/
      - /etc/loki:/var/lib/grafana
    depends_on:
      - loki
    restart: unless-stopped
That’s all for now with Loki.
![]()


