![]() Prometheus — open-source система мониторинга, изначально разработанная в SoundCloud в 2012, публичный релиз состоялся в 2015.
Prometheus — open-source система мониторинга, изначально разработанная в SoundCloud в 2012, публичный релиз состоялся в 2015.
Сам Prometheus написан большей частью на Go, компоненты связываются по HTTP.
Для визуализации имеет собственные графики, но может работать с системами типа Grafana (о ней позже, тоже будем применять).
Данные хранит локально, в собственной TSDB базе, индексы хранятся в LevelDB. Подробнее — тут>>>.
Метрики представляют собой time series данные — каждая состоит из имени метрики, временной метки и пары «ключ — значение». Больше деталей — тут>>>.
Содержание
Компоненты
- сам сервер Prometheus
- клиентские библиотеки
- push gateway для работы с кратковременными процессами (когда сервис работает слишком мало времени, что бы Prometheus имел возможность выполнять к нему запросы для получения метрик)
- exporters для сбора метрик из сторонних сервисом (и таких экспортёров — миллион, и имя им легион)
- alertmanager — менеджер уведомлений (умеет Slack, почту и т.д.)
В целом архитектура самого Prometheus выглядит примерно так:
 Больше — в документации.
Пробный запуск
Самый просто способ увидеть Prometheus в действии — запустить Docker контейнер.
Выполняем docker run -p 9090:9090 prom/prometheus:
[simterm]
$ docker run -p 9090:9090 prom/prometheus
time="2017-09-18T09:02:34Z" level=info msg="Starting prometheus (version=1.7.1, branch=master, revision=3afb3fffa3a29c3de865e1172fb740442e9d0133)" source="main.go:88"
time="2017-09-18T09:02:34Z" level=info msg="Build context (go=go1.8.3, user=root@0aa1b7fc430d, date=20170612-11:44:05)" source="main.go:89"
time="2017-09-18T09:02:34Z" level=info msg="Host details (Linux 4.12.12-1-ARCH #1 SMP PREEMPT Sun Sep 10 09:41:14 CEST 2017 x86_64 b446e48e4889 (none))" source="main.go:90"
time="2017-09-18T09:02:34Z" level=info msg="Loading configuration file /etc/prometheus/prometheus.yml" source="main.go:252"
time="2017-09-18T09:02:34Z" level=info msg="Loading series map and head chunks..." source="storage.go:428"
time="2017-09-18T09:02:34Z" level=info msg="0 series loaded." source="storage.go:439"
time="2017-09-18T09:02:34Z" level=info msg="Starting target manager..." source="targetmanager.go:63"
time="2017-09-18T09:02:34Z" level=info msg="Listening on :9090" source="web.go:259"
...
[/simterm]
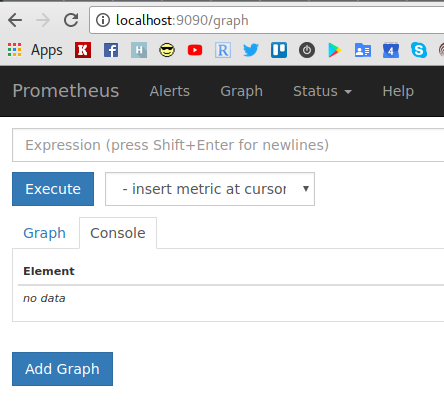
И открываем дашборд на localhost:9090:
Пример графика метрики времени выполнения проверок:

Другие примеры запуска — в документации тут>>>.
Сначала запустим Prometheus локально, в будущем — будем разворачивать и обновлять с помощью Ansbile, например — /ansible-prometheus (ну — по крайней мере так планируется на данный момент).
Запуск Prometheus
Запуск Docker контейнера — это хорошо, но посмотреть на Prometheus «изнутри» — нужно.
Загружаем архив со страницы загрузок:
[simterm]
$ sudo mkdir /opt/prometheus
$ sudo chown setevoy:setevoy /opt/prometheus
$ cd /opt/prometheus
$ wget https://github.com/prometheus/prometheus/releases/download/v2.0.0-beta.4/prometheus-2.0.0-beta.4.linux-amd64.tar.gz
$ tar xfp prometheus-2.0.0-beta.4.linux-amd64.tar.gz
$ cd prometheus-2.0.0-beta.4.linux-amd64
[/simterm]
Содержимое каталога:
[simterm]
$ ls -l
total 77048
drwxrwxr-x 2 setevoy setevoy     4096 Sep 14 14:21 console_libraries
drwxrwxr-x 2 setevoy setevoy     4096 Sep 14 14:21 consoles
-rw-rw-r-- 1 setevoy setevoy    11357 Sep 14 14:21 LICENSE
-rw-rw-r-- 1 setevoy setevoy     2793 Sep 14 14:21 NOTICE
-rwxr-xr-x 1 setevoy setevoy 65725853 Sep 14 14:24 prometheus
-rw-rw-r-- 1 setevoy setevoy      995 Sep 14 14:21 prometheus.yml
-rwxr-xr-x 1 setevoy setevoy 13138183 Sep 14 14:24 promtool
[/simterm]
prometheus— исполняемый файл сервераprometheus.yml— файл настроек, полная документация тут>>>
Есть и Prometheus CLI — но пока не пользовался им.
Файл настроек по умолчанию умеет мониторить сам Prometheus.
Помощь — стандартно, через --help:
[simterm]
$ ./prometheus --help
usage: prometheus [<flags>]

The Prometheus monitoring server

Flags:
  -h, --help                     Show context-sensitive help (also try --help-long and --help-man).
      --version                  Show application version.
...
[/simterm]
Например — там есть параметр для указания директории для данных:
...
      --storage.tsdb.path="data/"
                                 Base path for metrics storage.
...
Запускаем, посмотрим:
[simterm]
$ ./prometheus --config.file=prometheus.yml
INFO[0000] Starting prometheus (version=2.0.0-beta.4, branch=HEAD, revision=1b80f631a88a01473c1356d50da12eb49b462050)  source="main.go:210"
INFO[0000] Build context (go=go1.8.3, user=root@c5b3f10ffc51, date=20170914-11:22:50)  source="main.go:211"
INFO[0000] Host details (Linux 4.12.12-1-ARCH #1 SMP PREEMPT Sun Sep 10 09:41:14 CEST 2017 x86_64 setevoy-arch-work (none))  source="main.go:212"
INFO[0000] Starting tsdb                                 source="main.go:224"
INFO[0000] tsdb started                                  source="main.go:230"
INFO[0000] Loading configuration file prometheus.yml     source="main.go:363"
INFO[0000] Server is ready to receive requests.          source="main.go:340"
INFO[0000] Listening on 0.0.0.0:9090                     source="web.go:359"
INFO[0000] Starting target manager...                    source="targetmanager.go:67"
[/simterm]
Появился каталог с данными:
[simterm]
$ ls -l data/
total 8
-rw------- 1 setevoy setevoy    6 Sep 18 13:27 lock
drwxr-xr-x 2 setevoy setevoy 4096 Sep 18 13:27 wal
[/simterm]
Просмотреть метрики по умолчанию можно открыв http://localhost:9090/metrics:
[simterm]
$ curl -s http://localhost:9090/metrics | head
# HELP go_gc_duration_seconds A summary of the GC invocation durations.
# TYPE go_gc_duration_seconds summary
go_gc_duration_seconds{quantile="0"} 2.8536e-05
go_gc_duration_seconds{quantile="0.25"} 4.0398e-05
go_gc_duration_seconds{quantile="0.5"} 6.5249e-05
go_gc_duration_seconds{quantile="0.75"} 9.6245e-05
go_gc_duration_seconds{quantile="1"} 0.006219725
go_gc_duration_seconds_sum 0.010451709
go_gc_duration_seconds_count 19
# HELP go_goroutines Number of goroutines that currently exist.
[/simterm]
Примеры
Добавление targets
Не будем отходить далеко от Getting started — продолжим с добавления локальных таргетов для мониторинга.
Клонируем тестовые клиенты:
[simterm]
$ git clone https://github.com/prometheus/client_golang.git
$ cd client_golang/examples/random
$ go get -d
$ go build
[/simterm]
Запускаем три клиента:
[simterm]
$ ./random -listen-address=:8081 &
$ ./random -listen-address=:8082 &
$ ./random -listen-address=:8083 &
[/simterm]
Каждый начинает отдавать набор метрик:
[simterm]
$ curl -s localhost:8081/metrics | head
# HELP go_gc_duration_seconds A summary of the GC invocation durations.
# TYPE go_gc_duration_seconds summary
go_gc_duration_seconds{quantile="0"} 0
go_gc_duration_seconds{quantile="0.25"} 0
go_gc_duration_seconds{quantile="0.5"} 0
go_gc_duration_seconds{quantile="0.75"} 0
go_gc_duration_seconds{quantile="1"} 0
go_gc_duration_seconds_sum 0
go_gc_duration_seconds_count 0
# HELP go_goroutines Number of goroutines that currently exist.
[/simterm]
Теперь — добавим их в Prometheus.
Редактируем prometheus.yml, добавляем новые таргеты:
...
scrape_configs:
  # The job name is added as a label `job=<job_name>` to any timeseries scraped from this config.
  - job_name: 'prometheus'

    # metrics_path defaults to '/metrics'
    # scheme defaults to 'http'.

    static_configs:
      - targets: ['localhost:9090']

  - job_name:       'example-random'

    # Override the global default and scrape targets from this job every 5 seconds.
    scrape_interval: 5s

    static_configs:
      - targets: ['localhost:8080', 'localhost:8081']
        labels:
          group: 'production'

      - targets: ['localhost:8082']
        labels:
          group: 'canary'
Перезапускам Prometheus, проверяем:

Отлично!
Одна нода Down, т.к. конфиг копировал из документации, а ноды у себя запускал на портах 8081-8083. ОК, работает, идём дальше.
Фильтры и запросы Promeheus
Отфильтруем запросы в графиках.
Если перейти в графики и выбрать, например, go_gc_duration_seconds_count — будут отображены метрики от всех таргетов:
 Используем язык запросов Prometheus.
Обновляем выражение в строке консоли. В примере файла настроек выше мы добавили три таргета в две группы — два таргета в production, один — в canaris.
Сделаем выборку по production, форматируем запрос:
go_gc_duration_seconds_count{group="production",job="example-random"}
Жмём Execute:

ОК, работает. Очень удобно.
Еднственный момент — в группе production добавлено два таргета, а в графике выводится только один — потому что второй в Down.
Запускаем ещё один random таргет, проверяем снова:
[simterm]
$ ./random -listen-address=:8080 &
[/simterm]
Обновляем страницу:

Замечательно.
Exporters
Теперь для примера — добавим Node exporter, что бы промониторить ресурсы локального сервера (вообще-то — рабочего ноутбука, на котором сейчас запущен Prometheus).
Качаем со страницы загрузок:
[simterm]
$ mkdir -p exporters/node_exporter
$ cd exporters/node_exporter/ && wget https://github.com/prometheus/node_exporter/releases/download/v0.14.0/node_exporter-0.14.0.linux-amd64.tar.gz
$ tar xfp node_exporter-0.14.0.linux-amd64.tar.gz
$ ls -l node_exporter-0.14.0.linux-amd64
total 12824
-rw-rw-r-- 1 setevoy setevoy    11357 Mar 21 14:11 LICENSE
-rwxr-xr-x 1 setevoy setevoy 13115134 Mar 21 14:13 node_exporter
-rw-rw-r-- 1 setevoy setevoy      463 Mar 21 14:11 NOTICE
[/simterm]
Список коллекторов (т.е. метрик, которые будет отдавать експортёр) есть в README.
Запускаем:
[simterm]
$ ./node_exporter-0.14.0.linux-amd64/node_exporter
INFO[0000] Starting node_exporter (version=0.14.0, branch=master, revision=840ba5dcc71a084a3bc63cb6063003c1f94435a6)  source="node_exporter.go:140"
INFO[0000] Build context (go=go1.7.5, user=root@bb6d0678e7f3, date=20170321-12:12:54)  source="node_exporter.go:141"
INFO[0000] No directory specified, see --collector.textfile.directory  source="textfile.go:57"
INFO[0000] Enabled collectors:                           source="node_exporter.go:160"
INFO[0000]  - diskstats                                  source="node_exporter.go:162"
INFO[0000]  - time                                       source="node_exporter.go:162"
INFO[0000]  - wifi                                       source="node_exporter.go:162"
INFO[0000]  - conntrack                                  source="node_exporter.go:162"
INFO[0000]  - edac                                       source="node_exporter.go:162"
INFO[0000]  - filesystem                                 source="node_exporter.go:162"
INFO[0000]  - infiniband                                 source="node_exporter.go:162"
INFO[0000]  - netdev                                     source="node_exporter.go:162"
INFO[0000]  - stat                                       source="node_exporter.go:162"
INFO[0000]  - entropy                                    source="node_exporter.go:162"
INFO[0000]  - hwmon                                      source="node_exporter.go:162"
INFO[0000]  - sockstat                                   source="node_exporter.go:162"
INFO[0000]  - textfile                                   source="node_exporter.go:162"
INFO[0000]  - uname                                      source="node_exporter.go:162"
INFO[0000]  - zfs                                        source="node_exporter.go:162"
INFO[0000]  - filefd                                     source="node_exporter.go:162"
INFO[0000]  - loadavg                                    source="node_exporter.go:162"
INFO[0000]  - mdadm                                      source="node_exporter.go:162"
INFO[0000]  - meminfo                                    source="node_exporter.go:162"
INFO[0000]  - netstat                                    source="node_exporter.go:162"
INFO[0000]  - vmstat                                     source="node_exporter.go:162"
INFO[0000] Listening on :9100                            source="node_exporter.go:186"
[/simterm]
Собственно — повторяем те же дейсвия.
Проверим доступные метрики:
[simterm]
$ ./node_exporter-0.14.0.linux-amd64/node_exporter
INFO[0000] Starting node_exporter (version=0.14.0, branch=master, revision=840ba5dcc71a084a3bc63cb6063003c1f94435a6)  source="node_exporter.go:140"
INFO[0000] Build context (go=go1.7.5, user=root@bb6d0678e7f3, date=20170321-12:12:54)  source="node_exporter.go:141"
INFO[0000] No directory specified, see --collector.textfile.directory  source="textfile.go:57"
INFO[0000] Enabled collectors:                           source="node_exporter.go:160"
INFO[0000]  - diskstats                                  source="node_exporter.go:162"
INFO[0000]  - time                                       source="node_exporter.go:162"
INFO[0000]  - wifi                                       source="node_exporter.go:162"
INFO[0000]  - conntrack                                  source="node_exporter.go:162"
INFO[0000]  - edac                                       source="node_exporter.go:162"
INFO[0000]  - filesystem                                 source="node_exporter.go:162"
INFO[0000]  - infiniband                                 source="node_exporter.go:162"
INFO[0000]  - netdev                                     source="node_exporter.go:162"
INFO[0000]  - stat                                       source="node_exporter.go:162"
INFO[0000]  - entropy                                    source="node_exporter.go:162"
INFO[0000]  - hwmon                                      source="node_exporter.go:162"
INFO[0000]  - sockstat                                   source="node_exporter.go:162"
INFO[0000]  - textfile                                   source="node_exporter.go:162"
INFO[0000]  - uname                                      source="node_exporter.go:162"
INFO[0000]  - zfs                                        source="node_exporter.go:162"
INFO[0000]  - filefd                                     source="node_exporter.go:162"
INFO[0000]  - loadavg                                    source="node_exporter.go:162"
INFO[0000]  - mdadm                                      source="node_exporter.go:162"
INFO[0000]  - meminfo                                    source="node_exporter.go:162"
INFO[0000]  - netstat                                    source="node_exporter.go:162"
INFO[0000]  - vmstat                                     source="node_exporter.go:162"
INFO[0000] Listening on :9100                            source="node_exporter.go:186"
[/simterm]
Отдаёт — все замечательно.
Редактируем prometheus.yml, добавляем новый таргет:
...
scrape_configs:
  # The job name is added as a label `job=<job_name>` to any timeseries scraped from this config.
  - job_name: 'prometheus'

    # metrics_path defaults to '/metrics'
    # scheme defaults to 'http'.

    static_configs:
      - targets: ['localhost:9090']

  - job_name:       'example-random'

    # Override the global default and scrape targets from this job every 5 seconds.
    scrape_interval: 5s

    static_configs:
      - targets: ['localhost:8080', 'localhost:8081']
        labels:
          group: 'production'

      - targets: ['localhost:8082']
        labels:
          group: 'canary'

  - job_name: "node_local"
    scrape_interval: "5s"
    static_configs:
    - targets: ['localhost:9100']
      labels:
        group: 'local'
Запускаем, проверяем таргеты:

Графики:

Всё работает.
Итоги
Prometheus потрогал первый раз. Весьма понравился как возможностями, так и удобством настройки и запуска.
Всё легко запускается в Docker, все настройки в файлах — отлично.
Далее — добавлю к нему Grafana, посмотрю на мониторинг уже Docker контейнеров, отдельных приложений (типа NodeJS) и начнём внедрять.
Ссылки по теме
Checking if SSH is responding with Prometheus
How To Use Prometheus to Monitor Your Ubuntu 14.04 Server
How to Use Prometheus to Monitor Your CentOS 7 Server
Prometheus Monitoring With Grafana
Initial experiences with the Prometheus monitoring system
Мониторинг сервисов с Prometheus
Prometheus — практическое использование
Мониторинг докер-хостов, контейнеров и контейнерных служб
Monitoring with Prometheus, Grafana & Docker Part 1
![]()