 Active alerts sending frequency via Alertmanager is configured via the
 repeat_interval in the /etc/alertmanager/config.yml file.
We have this interval set to 15 minutes, and as result, we have notifications about alerts in our Slack each fifteen minutes.
Still, some alerts are such a “known issues”, when we already started the investigation or fixing it, but the alert is repeatedly sent to Slack.
To mute those alerts to prevent them to be sent over and over they can be disabled by marking them as “silenced“.
An alert can be silenced with Web UI of the Alertmanager, see documentation.
So, what we will do in this post:
- update Alertmanager’s startup options to enable Web UI
- update a NGINX virtualhost to get access to the Alertmanager’s Web UI
- will check and configure Prometheus server to send alerts
- will add a test alert to check how to Silence it
Contents
Alertmanager Web UI configuration
We have our Alertmanager running from a Docker Compose file, let’s add two parameters to the command field – a web.route-prefix which will specify a URI for the Alertmanager Web UI, and a web.external-url, to set a full URL.
This full URL will look like dev.monitor.example.com/alertmanager – add them:
...
  alertmanager:
    image: prom/alertmanager:v0.21.0
    networks:
      - prometheus
    ports:
      - 9093:9093
    volumes:
      - /etc/prometheus/alertmanager_config.yml:/etc/alertmanager/config.yml
    command:
      - '--config.file=/etc/alertmanager/config.yml'
      - '--web.route-prefix=/alertmanager'
      - '--web.external-url=https://dev.monitor.example.com/alertmanager'
...
Alertmanager is working in a Docker container and is accessible via localhost:9093 from the monitoring host:
[simterm]
root@monitoring-dev:/home/admin# docker ps | grep alert
24ae3babd644        prom/alertmanager:v0.21.0                                          "/bin/alertmanager -…"   3 seconds ago       Up 1 second             0.0.0.0:9093->9093/tcp   prometheus_alertmanager_1
[/simterm]
In the NGINX’s virtualhost config add a new upstream with the Alertmanager’s Docker container:
...
upstream alertmanager {
    server 127.0.0.1:9093;
}
...
Also, add a new location in this file which will proxy-pass all requests to the dev.monitor.example.com/alertmanager to this upstream:
...
    location /alertmanager {

        proxy_redirect          off;
        proxy_set_header        Host            $host;
        proxy_set_header        X-Real-IP       $remote_addr;
        proxy_set_header        X-Forwarded-For $proxy_add_x_forwarded_for;
        proxy_pass http://alertmanager$request_uri;
    }
...
Save and reload NGINX and Alertmanager.
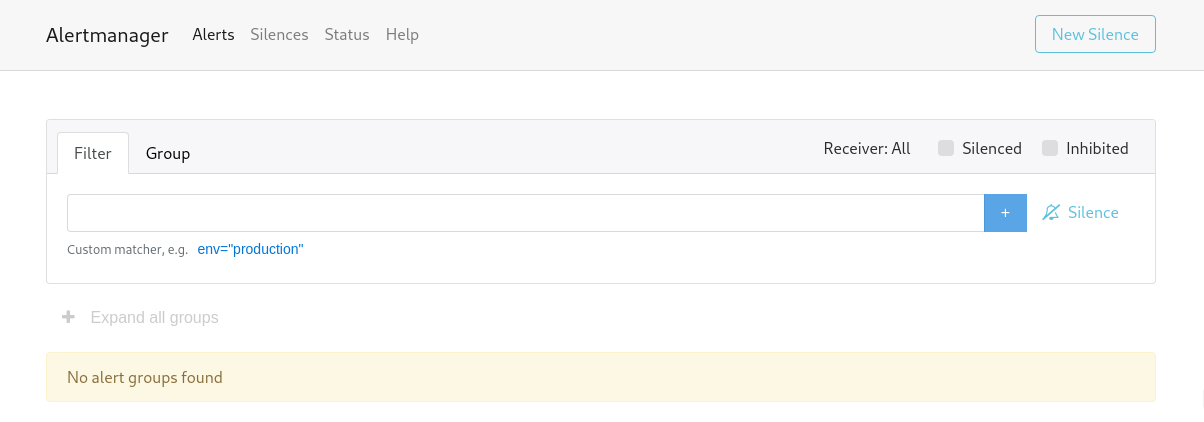
Now, open the https://dev.monitor.example.com/alertmanager URL and you must see the Alertmanager Web UI:
Here are no alerts yet – wait for Prometheus to send new alerts.
Prometheus: “Error sending alert” err=”bad response status 404 Not Found”
After a new alert in the Prometheus server will appear you can see the following error in its log:
caller=notifier.go:527 component=notifier alertmanager=http://alertmanager:9093/api/v1/alerts count=3 msg=”Error sending alert” err=”bad response status 404 Not Found”
It happens because currently, we have the alertmanagers set as:
...
alerting:
  alertmanagers:
  - static_configs:
    - targets:
      - alertmanager:9093
...
So, need to add the URI of the Alertmanager by using the path_prefix setting:
...
alerting:
  alertmanagers:
  - path_prefix: "/alertmanager/"
    static_configs:
    - targets:
      - alertmanager:9093
...
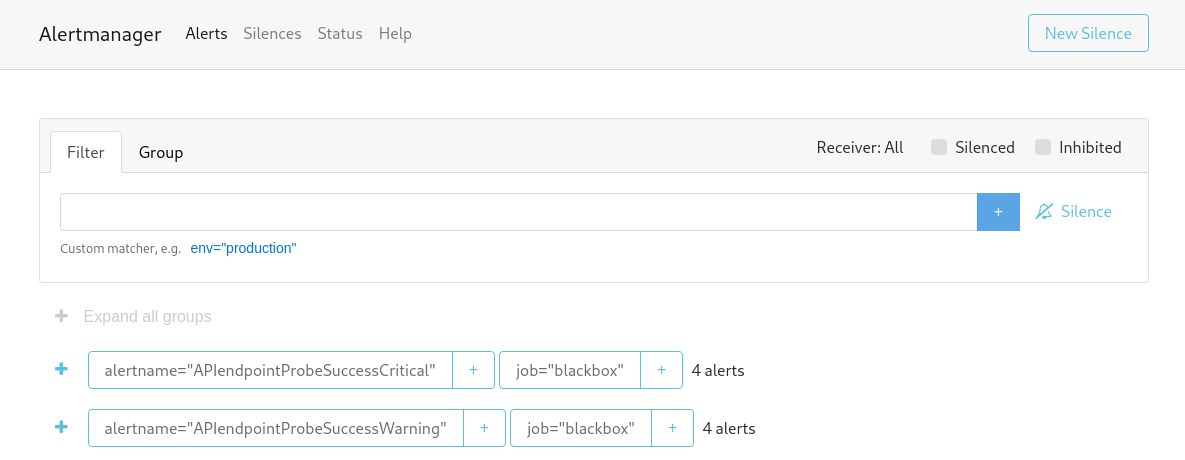
Restart the Prometheus, and wait again for alerts:
At this time, you must see them in the Alertmanager Web UI too:
Alertmanager: an alert Silence
Now, let’s add a Silence for an alert to stop sending them.
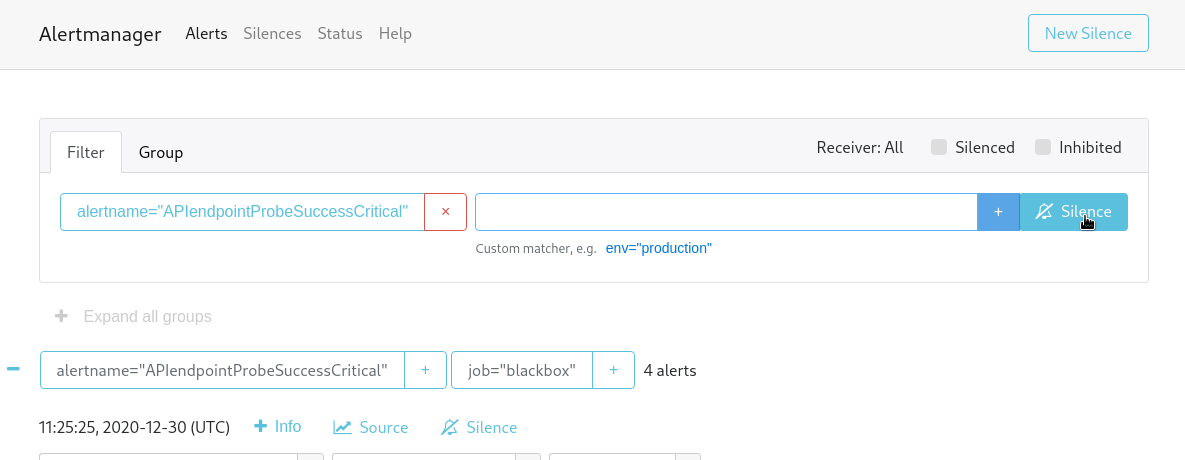
For example, to disable re-sending of the alertname=”APIendpointProbeSuccessCritical”, click at the + button at the right side:
Then on the Silence button:
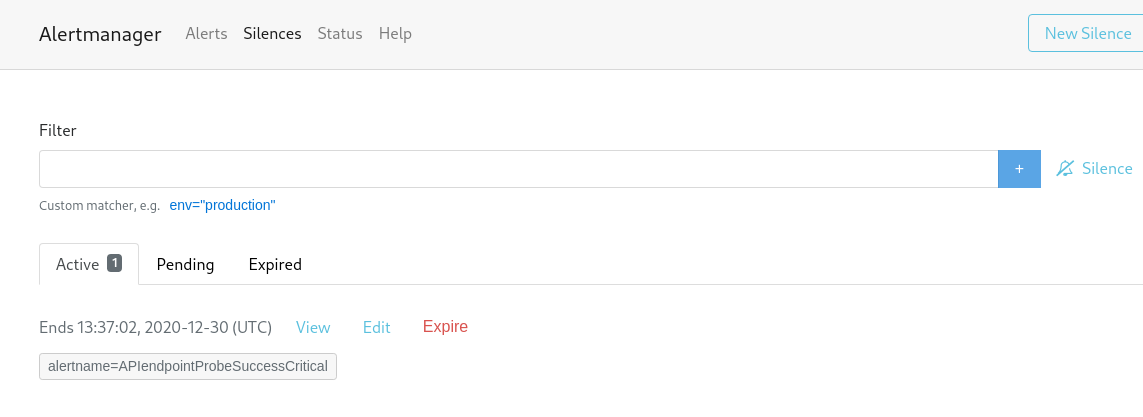
The alertname label was added to the silencing condition with the default rule of the 2 hours, add an author and description why it was silenced:
Click Create – and it’s done:
You can check this alert via API now:
[simterm]
root@monitoring-dev:/home/admin# curl -s http://localhost:9093/alertmanager/api/v1/alerts | jq '.data[1]'
{
  "labels": {
    "alertname": "APIendpointProbeSuccessCritical",
    "instance": "http://push.example.com",
    "job": "blackbox",
    "monitor": "monitoring-dev",
    "severity": "critical"
  },
  "annotations": {
    "description": "Cant access API endpoint http://push.example.com!",
    "summary": "API endpoint down!"
  },
  "startsAt": "2020-12-30T11:25:25.953289015Z",
  "endsAt": "2020-12-30T11:43:25.953289015Z",
  "generatorURL": "https://dev.monitor.example.com/prometheus/graph?g0.expr=probe_success%7Binstance%21%3D%22https%3A%2F%2Fokta.example.com%22%2Cjob%3D%22blackbox%22%7D+%21%3D+1&g0.tab=1",
  "status": {
    "state": "suppressed",
    "silencedBy": [
      "ec11c989-f66e-448e-837c-d788c1db8aa4"
    ],
    "inhibitedBy": null
  },
  "receivers": [
    "critical"
  ],
  "fingerprint": "01e79a8dd541cf69"
}
[/simterm]
So, this alert will not be sent to the Slack or wherever else because on the "state": "suppressed" field:
[simterm]
...
  "status": {
    "state": "suppressed",
    "silencedBy": [
      "ec11c989-f66e-448e-837c-d788c1db8aa4"
    ],
...
[/simterm]
Done.
![]()


