 So, let’s continue our journey with migrating GitLab to Kubernetes. See previous parts:
- GitLab: Components, Architecture, Infrastructure, and Launching from the Helm Chart in Minikube
- GitLab: Helm chart of values, dependencies, and deployment in Kubernetes with AWS S3
- GitLab: міграція даних з GitLab cloud та процес backup-restore у self-hosted версії в Kubernetes
In general, everything is working, and we are already preparing to transfer the repositories, the last ( 🙂) that remains to be done is monitoring.
Contents
GitLab and Prometheus
GitLab monitoring documentation:
In our Kubernetes cluster, we have deployed our Prometheus using the Kube Prometheus Stack (hereinafter – KPS) and its Prometheus Operator.
GitLab can run its own Prometheus, which is from the box configured to collect metrics from all Kubernetes Pods and Services that have the annotation gitlab.com/prometheus_scrape=true.
In addition, all Pods and Services have an annotation prometheus.io/scrape=true, but KPS does not work with annotations, see documentation:
The prometheus operator does not support annotation-based discovery of services
So we have two options for collecting metrics:
- turn off Prometheus GitLab itself, and through ServiceMonitors collect metrics from components directly in KPS Prometheus – but then all components will have to include ServiceMonitor (and not all of them have them, so some will have to be added manually through separate manifests)
- or we can leave the built-in Prometheus, where everything is already configured, and through the Prometheus Federation simply collect the metrics we need for the Prometheus KPS
In the second case, we will spend extra resources for the additional Prometheus but will avoid the necessity for the additional configuration of GitLab charts and Prometheus with KPS.
Setting up Prometheus Federation
Documentation – Federation.
First, let’s check the Prometheus settings of GitLab itself – whether there are metrics and jobs.
Find the Prometheus Service:
[simterm]
$ kk -n gitlab-cluster-prod get svc gitlab-cluster-prod-prometheus-server
NAME                                    TYPE        CLUSTER-IP      EXTERNAL-IP   PORT(S)   AGE
gitlab-cluster-prod-prometheus-server   ClusterIP   172.20.194.14   <none>        80/TCP    27d
[/simterm]
Open access to it:
[simterm]
$ kk -n gitlab-cluster-prod port-forward svc/gitlab-cluster-prod-prometheus-server 9090:80
[/simterm]
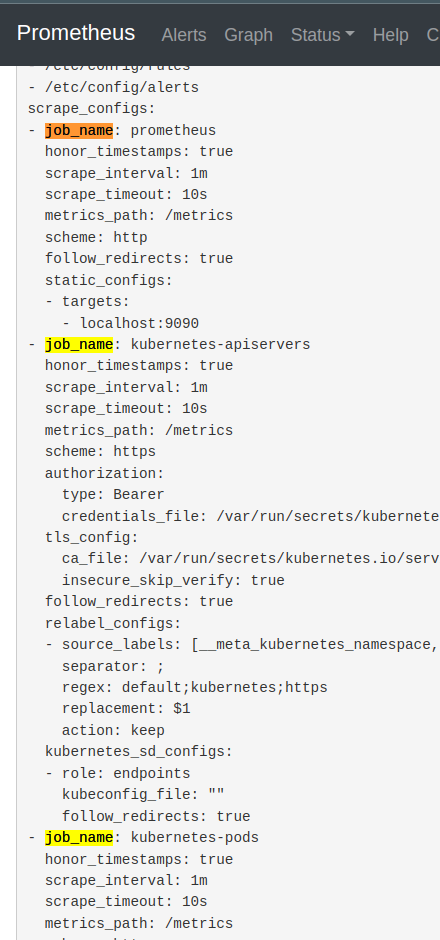
Go to http://localhost:9090 in the browser, navigate to the Status > Configuration, and check scrape jobs there:
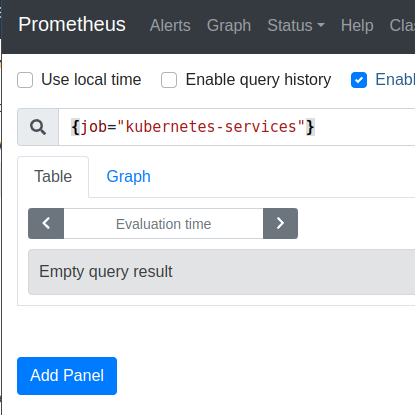
Below, there is also a job_name: kubernetes-service-endpoints and job_name: kubernetes-services jobs, but there are currently no metrics for them:
We don’t need jobs prometheus and kubernetes-apiservers, because it’s just pushing extra metrics into KPS Prometheus: the job=prometheus job has metrics from GitLab Prometheus itself, and in the job=kubernetes-apiservers there is data about the Kubernetes API, which Prometheus KPS already collects itself.
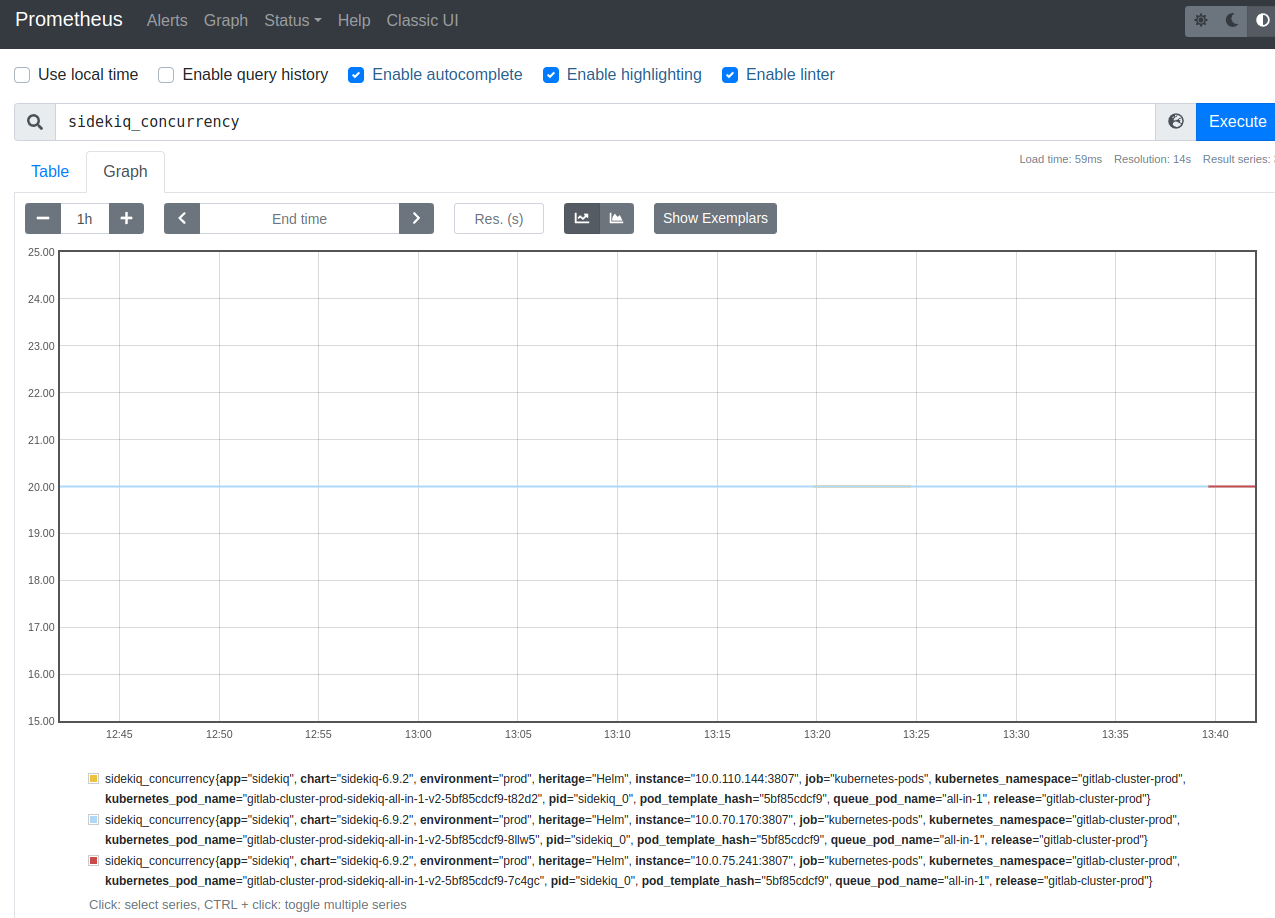
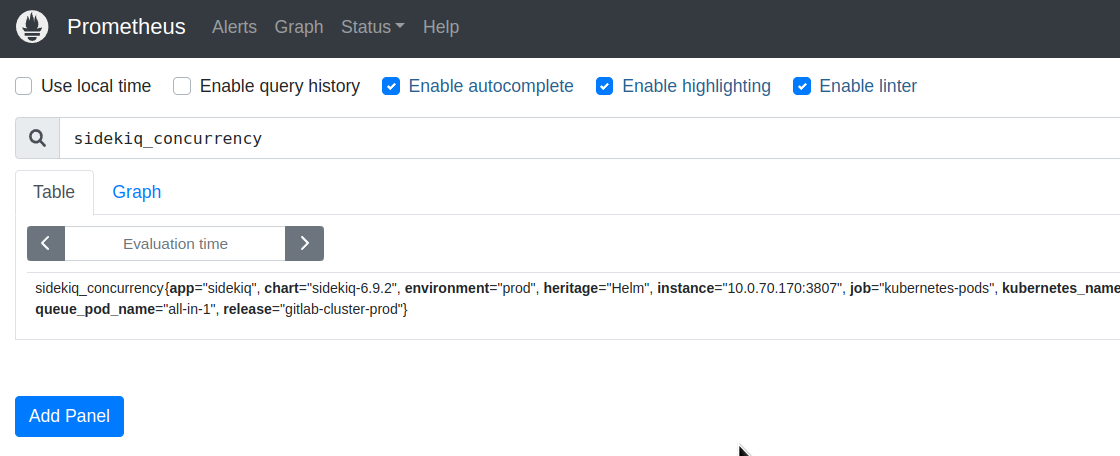
Let’s check that there are metrics in GitLab Prometheus at all. For example, let’s check the metric sidekiq_concurrency, see GitLab Prometheus metrics:
Next, configure the federation – in the Kube Prometheus Stack values find the prometheus block and add the additionalScrapeConfigs, where we specify the name of the job, the path for federation, in params – specify a match, by which we select only the metrics we need from GitLab Prometheus, and in the static_configs we specify the target – GitLab Prometheus Service URL:
...
      additionalScrapeConfigs:
        - job_name: 'gitlab_federation'
          honor_labels: true
          metrics_path: '/federate'
          params:
            'match[]':
              - '{job="kubernetes-pods"}'
              - '{job="kubernetes-service-endpoints"}'
              - '{job="kubernetes-services"}'
          static_configs:
          - targets: ["gitlab-cluster-prod-prometheus-server.gitlab-cluster-prod:80"]
...
Deploy and check the Targets in the KPS Prometheus:
And in a minute or two, check the metrics in the Graph of the Prometheus KPS:
GitLab Prometheus Metrics
Now that we have metrics in our Prometheus, let’s see what can and should be monitored in GitLab.
First, these are Kubernetes resources, but we will talk about them when we create our own Grafana dashboard.
But we also have components of GitLab itself, which have their own metrics:
- PostgreSQL: monitored by its own exporter
- KeyDB/Redis: monitored by its own exporter
- Gitaly: returns the metrics itself, enabled by default, see values
- Runner: returns the metrics itself, disabled by default, see values
- Shell: returns the metrics itself, disabled by default, see values
- Registry: returns the metrics itself, disabled by default, see values
- Sidekiq: returns the metrics itself, enabled by default, see values
- Toolbox && backups: nothing on metrics, see values
- Webservice: returns the metrics itself, enabled by default, see values
- additionally, metrics fromе the Workhorse, disabled by default, see values
There is also a GitLab Exporter with its own metrics – values.
There are many metrics described in the documentation on the GitLab Prometheus metrics page, but not all of them, so it makes sense to go through the steps and view the metrics directly from the services.
For example, Gitaly has a metric gitaly_authentications_total that is not covered by the documentation.
Open access to the port with metrics (it is in its values):
[simterm]
$ kk -n gitlab-cluster-prod port-forward gitlab-cluster-prod-gitaly-0 9236:9236
[/simterm]
Check the metrics
[simterm]
$ curl localhost:9236/metrics
# HELP gitaly_authentications_total Counts of of Gitaly request authentication attempts
# TYPE gitaly_authentications_total counter
gitaly_authentications_total{enforced="true",status="ok"} 5511
...
[/simterm]
Below is a list of interesting (in my own opinion) metrics from components that can then be used to build Grafana dashboards per GitLab service and alerts.
Gitaly
Metrics here:
gitaly_authentications_total: Counts of Gitaly request authentication attemptsgitaly_command_signals_received_total: Sum of signals received while shelling outgitaly_connections_total: Total number of connections to Gitalygitaly_git_protocol_requests_total: Counter of Git protocol requestsgitaly_gitlab_api_latency_seconds_bucket: Latency between posting to GitLab’s `/internal/` APIs and receiving a responsegitaly_service_client_requests_total: Counter of client requests received by client, call_site, auth version, response code and deadline_typegitaly_supervisor_health_checks_total: Count of Gitaly supervisor health checksgrpc_server_handled_total: Total number of RPCs completed on the server, regardless of success or failuregrpc_server_handling_seconds_bucket: Histogram of response latency (seconds) of gRPC that had been application-level handled by the server
Runner
Metrics here:
gitlab_runner_api_request_statuses_total: The total number of api requests, partitioned by runner, endpoint and statusgitlab_runner_concurrent: The current value of concurrent settinggitlab_runner_errors_total: The number of caught errorsgitlab_runner_jobs: The current number of running buildsgitlab_runner_limit: The current value of concurrent settinggitlab_runner_request_concurrency: The current number of concurrent requests for a new jobgitlab_runner_request_concurrency_exceeded_total: Count of excess requests above the configured request_concurrency limit
Shell
Here, for some reason, the endpoint metrics do not work, I did not start digging:
[simterm]
$ kk -n gitlab-cluster-prod port-forward gitlab-cluster-prod-gitlab-shell-744675c985-5t8wn 9122:9122
Forwarding from 127.0.0.1:9122 -> 9122
Forwarding from [::1]:9122 -> 9122
Handling connection for 9122
E0311 09:36:35.695971 3842548 portforward.go:407] an error occurred forwarding 9122 -> 9122: error forwarding port 9122 to pod 51856f9224907d4c1380783e46b13069ef5322ae1f286d4301f90a2ed60483c0, uid : exit status 1: 2023/03/11 07:36:35 socat[10867] E connect(5, AF=2 127.0.0.1:9122, 16): Connection refused
[/simterm]
Registry
Metrics here:
registry_http_in_flight_requests: A gauge of requests currently being served by the http serverregistry_http_request_duration_seconds_bucket: A histogram of latencies for requests to the http serverregistry_http_requests_total: A counter for requests to the http serverregistry_storage_action_seconds_bucket: The number of seconds that the storage action takesregistry_storage_rate_limit_total: A counter of requests to the storage driver that hit a rate limit
Sidekiq
Metrics here:
- Jobs:
sidekiq_jobs_cpu_seconds: Seconds of CPU time to run Sidekiq jobsidekiq_jobs_db_seconds: Seconds of DB time to run Sidekiq jobsidekiq_jobs_gitaly_seconds: Seconds of Gitaly time to run Sidekiq jobsidekiq_jobs_queue_duration_seconds: Duration in seconds that a Sidekiq job was queued before being executedsidekiq_jobs_failed_total: Sidekiq jobs failedsidekiq_jobs_retried_total: Sidekiq jobs retriedsidekiq_jobs_interrupted_total: Sidekiq jobs interruptedsidekiq_jobs_dead_total: Sidekiq dead jobs (jobs that have run out of retries)sidekiq_running_jobs: Number of Sidekiq jobs runningsidekiq_jobs_processed_total: (from gitlab-exporter)
- Redis:
sidekiq_redis_requests_total: Redis requests during a Sidekiq job executiongitlab_redis_client_exceptions_total: Number of Redis client exceptions, broken down by exception class
- Queue (from gitlab-exporter):
sidekiq_queue_sizesidekiq_queue_latency_seconds
- Misc:
sidekiq_concurrency: Maximum number of Sidekiq jobs
Webservice
A bit about the services:
- Action Cable: is a Rails engine that handles websocket connections – see Action Cable
- Puma: is a simple, fast, multi-threaded, and highly concurrent HTTP 1.1 server for Ruby/Rack applications – see GitLab Puma
Metrics here:
- Database:
gitlab_database_transaction_seconds: Time spent in database transactions, in secondsgitlab_sql_duration_seconds: SQL execution time, excluding SCHEMA operations and BEGIN / COMMITgitlab_transaction_db_count_total: Counter for total number of SQL callsgitlab_database_connection_pool_size: Total connection pool capacitygitlab_database_connection_pool_connections: Current connections in the poolgitlab_database_connection_pool_waiting: Threads currently waiting on this queue
- HTTP:
http_requests_total: Rack request counthttp_request_duration_seconds: HTTP response time from rack middleware for successful requestsgitlab_external_http_total: Total number of HTTP calls to external systemsgitlab_external_http_duration_seconds: Duration in seconds spent on each HTTP call to external systems
- ActionCable:
action_cable_pool_current_size: Current number of worker threads in ActionCable thread poolaction_cable_pool_max_size: Maximum number of worker threads in ActionCable thread poolaction_cable_pool_pending_tasks: Number of tasks waiting to be executed in ActionCable thread poolaction_cable_pool_tasks_total: Total number of tasks executed in ActionCable thread pool
- Puma:
puma_workers: Total number of workerspuma_running_workers: Number of booted workerspuma_running: Number of running threadspuma_queued_connections: Number of connections in that worker’s “to do” set waiting for a worker threadpuma_active_connections: Number of threads processing a requestpuma_pool_capacity: Number of requests the worker is capable of taking right nowpuma_max_threads: Maximum number of worker threads
- Redis:
gitlab_redis_client_requests_total: Number of Redis client requestsgitlab_redis_client_requests_duration_seconds: Redis request latency, excluding blocking commands
- Cache:
gitlab_cache_misses_total: Cache read missgitlab_cache_operations_total: Cache operations by controller or action
- Misc:
user_session_logins_total: Counter of how many users have logged in since GitLab was started or restarted
Workhorse
A bit about the service: GitLab Workhorse is a smart reverse proxy for GitLab, see GitLab Workhorse.
Metrics here:
gitlab_workhorse_gitaly_connections_total: Number of Gitaly connections that have been establishedgitlab_workhorse_http_in_flight_requests: A gauge of requests currently being served by the http servergitlab_workhorse_http_request_duration_seconds_bucket: A histogram of latencies for requests to the http servergitlab_workhorse_http_requests_total: A counter for requests to the http servergitlab_workhorse_internal_api_failure_response_bytes: How many bytes have been returned by upstream GitLab in API failure/rejection response bodiesgitlab_workhorse_internal_api_requests: How many internal API requests have been completed by gitlab-workhorse, partitioned by status code and HTTP methodgitlab_workhorse_object_storage_upload_requests: How many object storage requests have been processedgitlab_workhorse_object_storage_upload_time_bucket: How long it took to upload objectsgitlab_workhorse_send_url_requests: How many send URL requests have been processed
Uh… A lot.
But it was interesting and useful to dive a little deeper into what generally happens inside the GitLab cluster.
Grafana GitLab Overview dashboard
And finally, let’s build our own dashboard for GitLab, although there are many ready-made ones here>>>, so you can take examples of requests and panels from them.
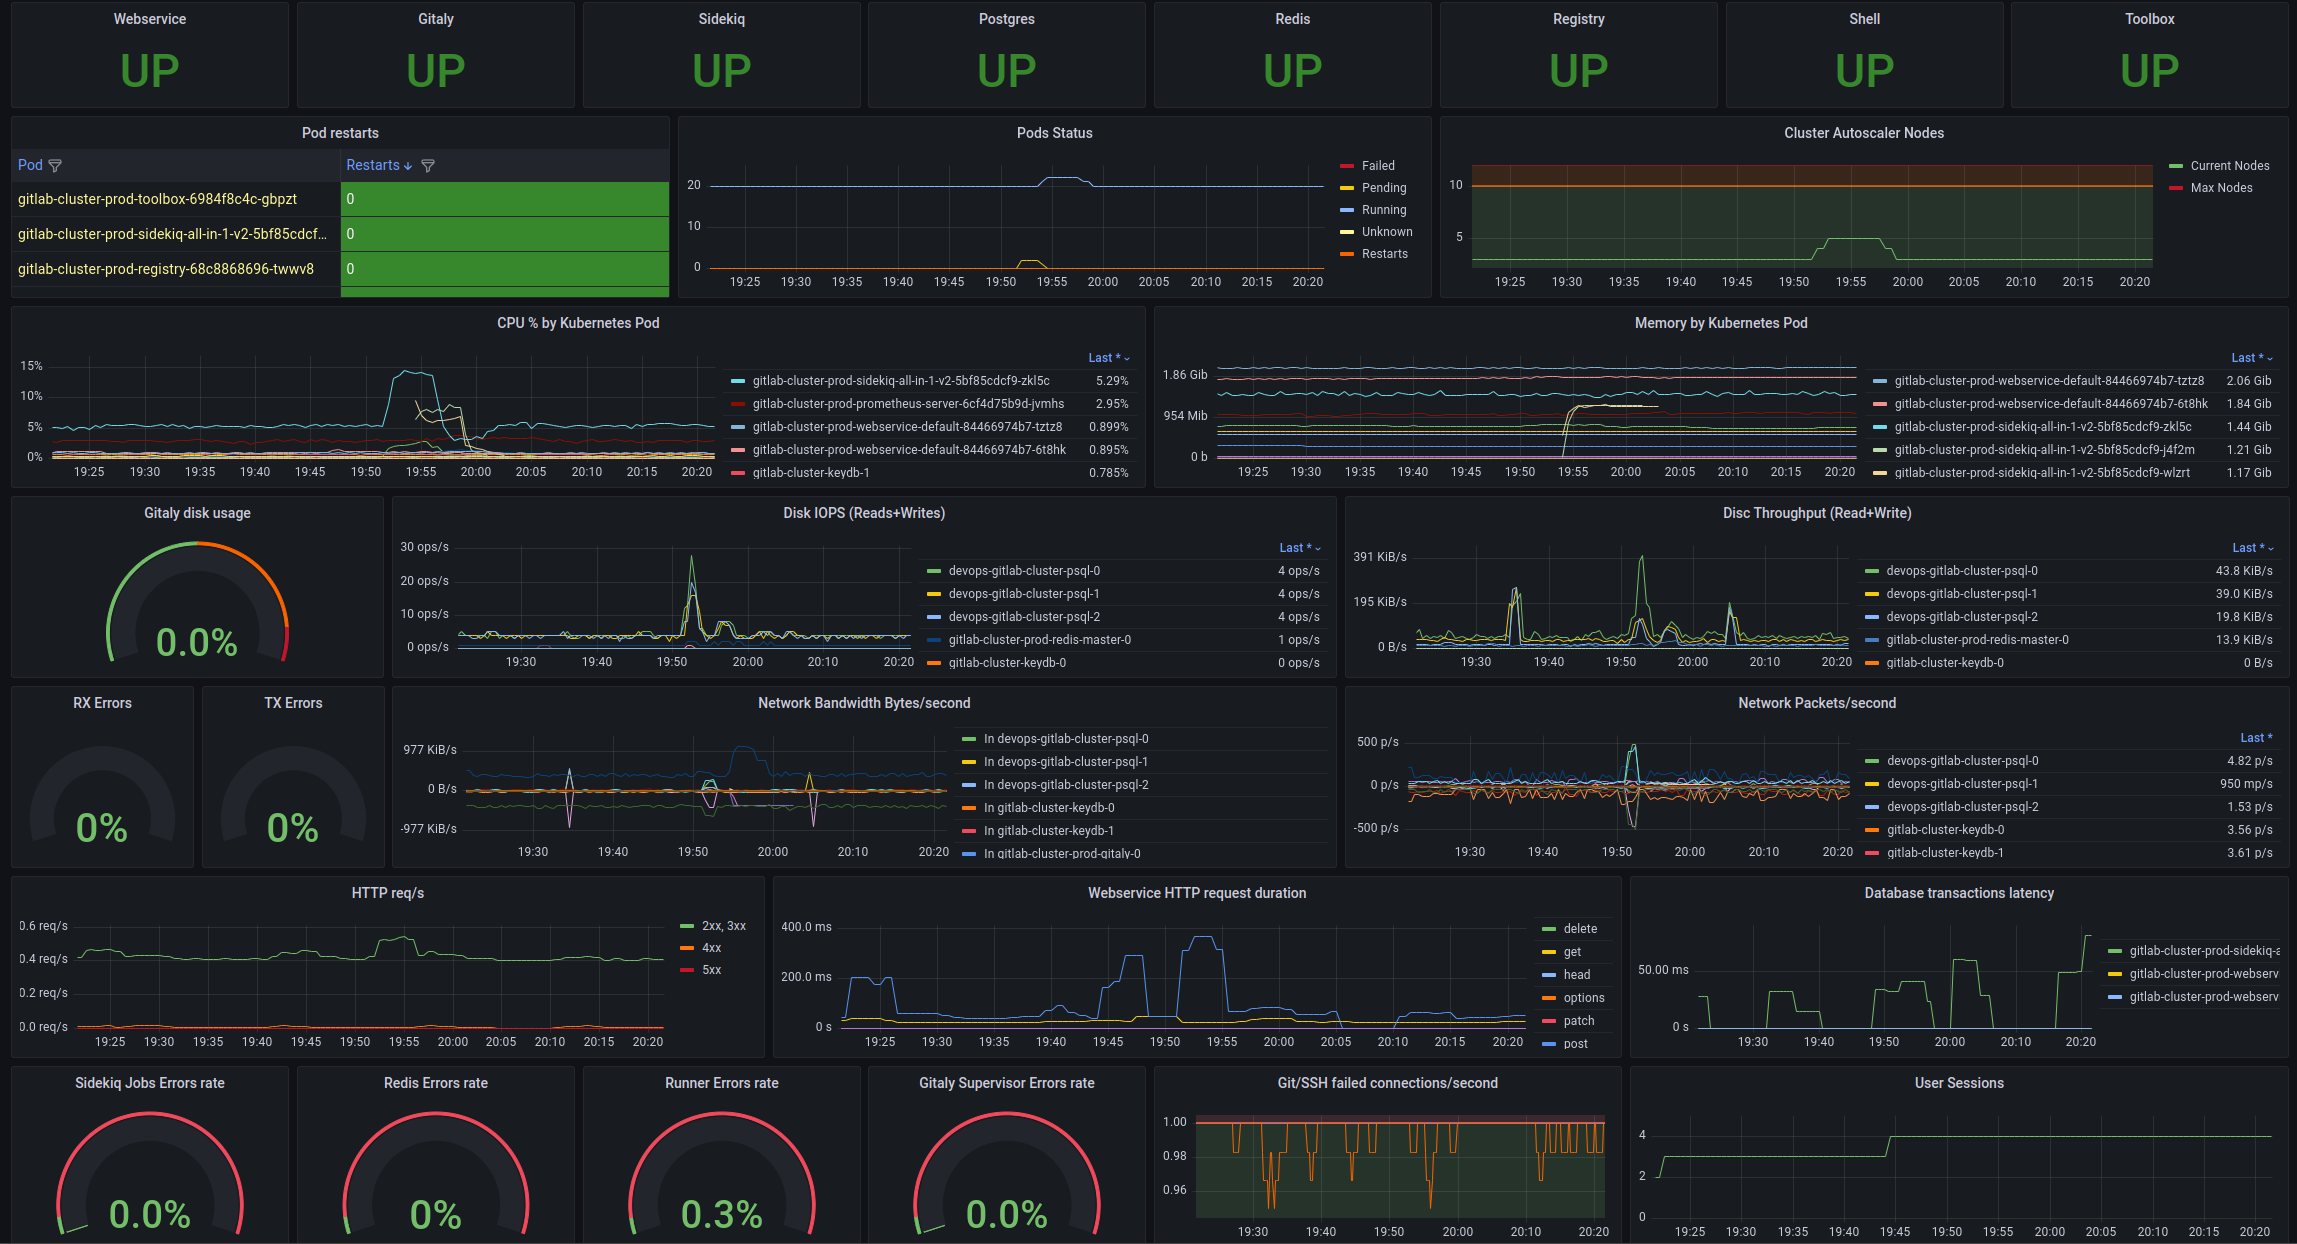
For the GitLab components themselves, it will probably be possible to create a separate one later, but for now, I’d like to see on one screen what is happening with Kubernetes pods, worker nodes, and general information about GitLab services and their status.
What are we interested in?
From Kubernetes resources:
- pods: restarts, pendings
- PVC: used/free disk space, IOPS
- CPU/Memory by pods and CPU throttling (if pods had limits, by default there are none)
- network: in/out bandwidth, error rate
In addition, I would like to see the status of GitLab components, information about the database, Redis, and some statistics on HTTP/Git/SSH.
Purely for me – it is desirable that all data be on one screen/monitor – then it is convenient to see everything you need at once.
Once upon a time, when I was still going to the office, it looked like this – load testing our first Kubernetes cluster at my former job:
Let’s go.
Variables
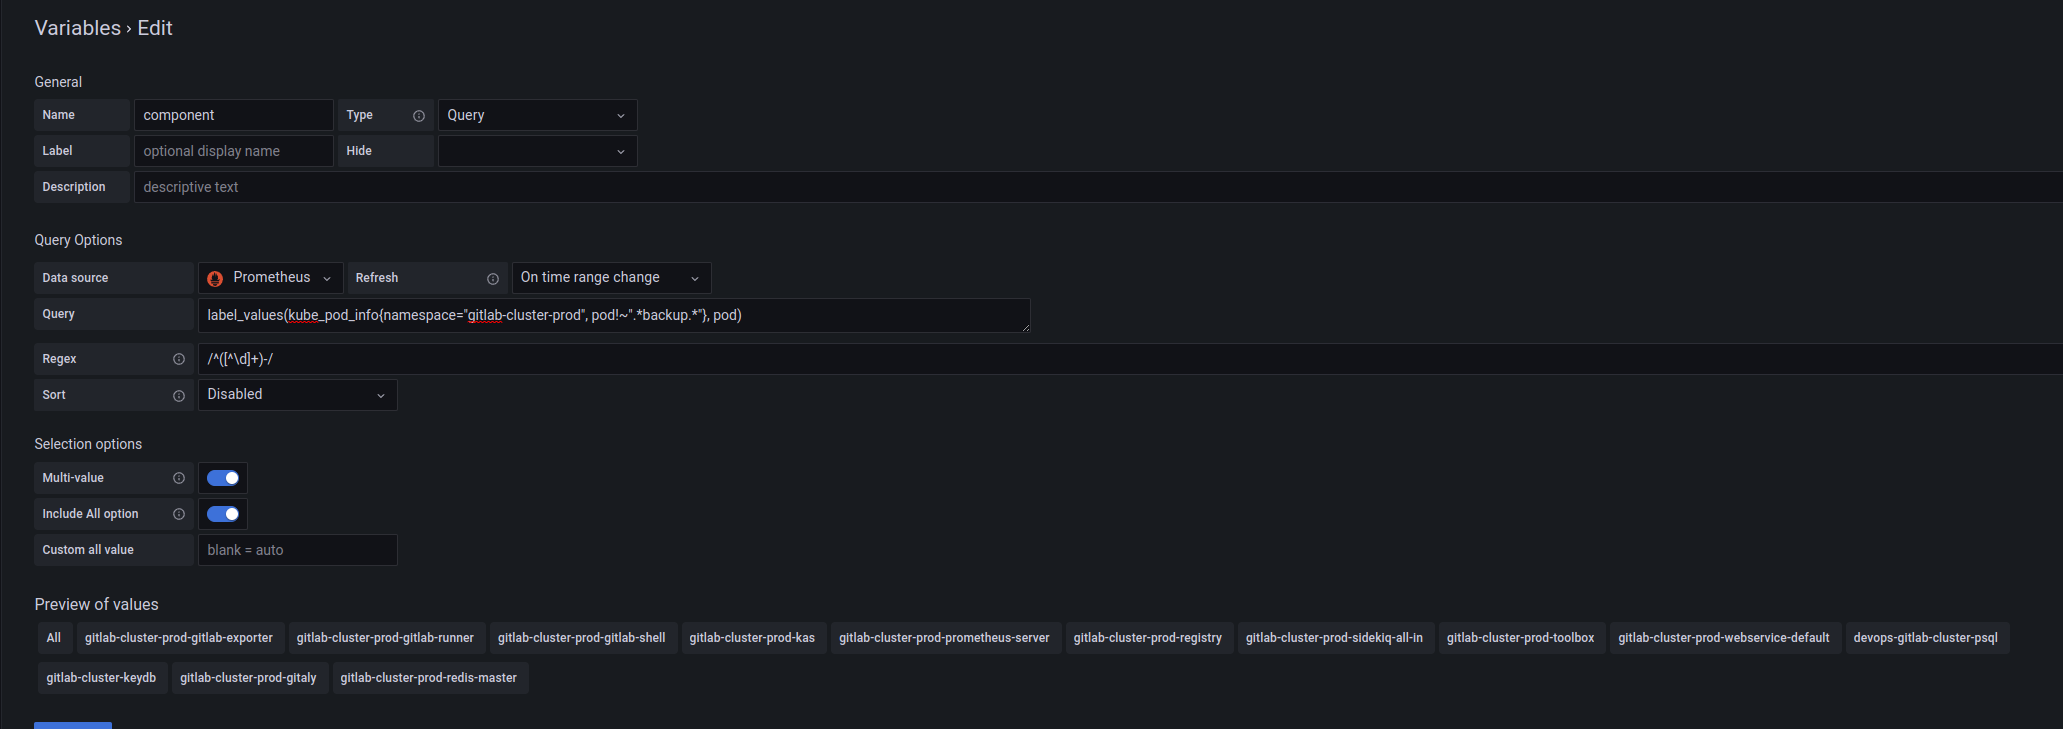
To be able to display information on a specific component of the cluster, add the component variable.
Values are formed by the request to kube_pod_info:
label_values(kube_pod_info{namespace="gitlab-cluster-prod", pod!~".*backup.*"}, pod)
From which we will get a label pod, and then with the /^([^\d]+)-/ regex we cut everything down to the numbers:
And then we can use the $component variable to get only the necessary Pods.
GitLab components status
Here it is quite simple: we know the number of pods of each service, so we count them and display the UP/DEGRADED/DOWN message.
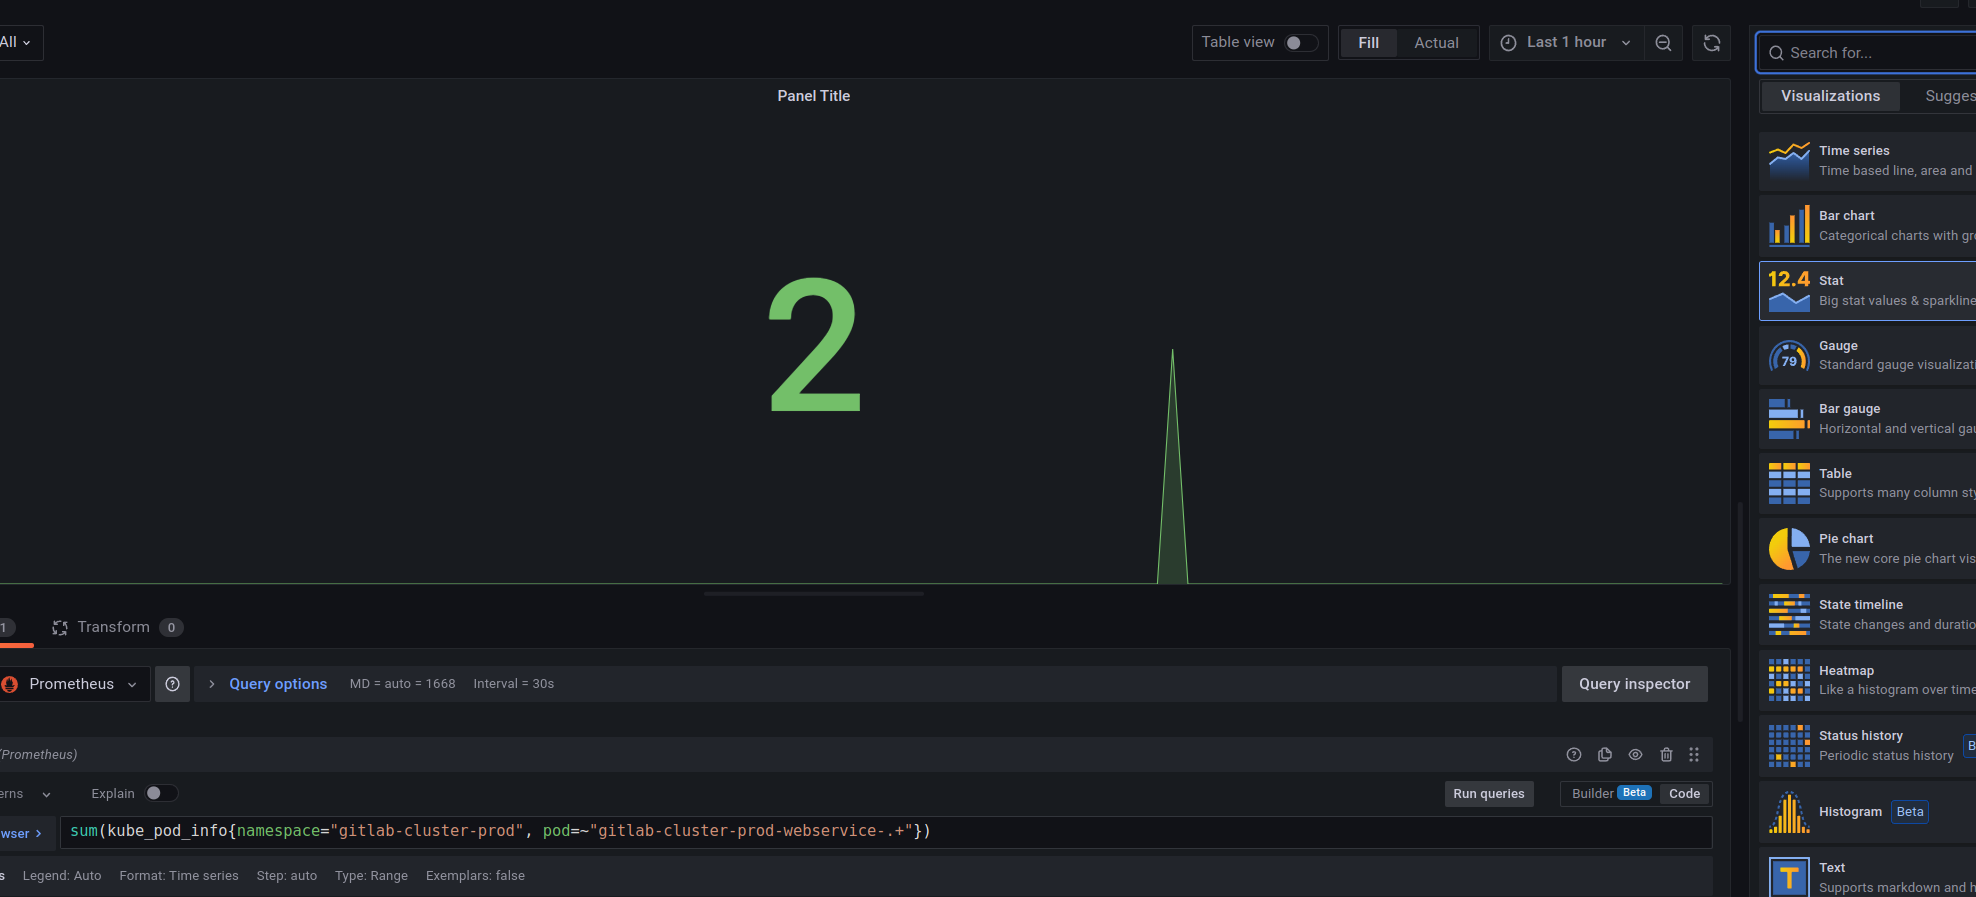
Using Webservice as an example, use the following request:
sum(kube_pod_info{namespace="gitlab-cluster-prod", pod=~"gitlab-cluster-prod-webservice-.+"})
Create a panel with type Stat, and get the number of pods:
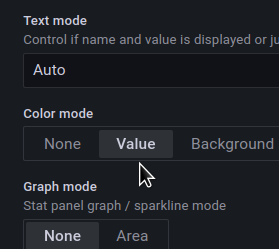
Set the Text mode = Value:
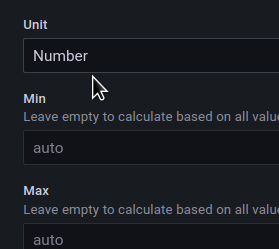
Unit = number:
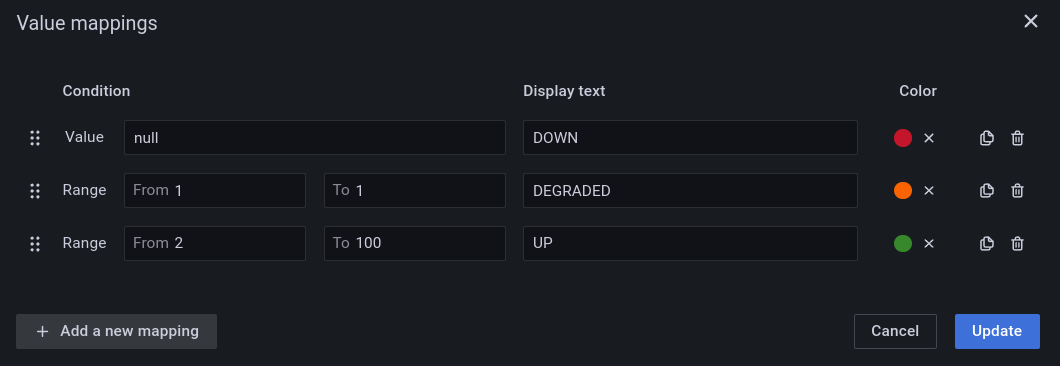
Create Value mappings:
We currently have 2 pods in the Webservice Deployment, so if there will be zero, then it will be displayed as DOWN, if only one – then DEGRADED, and 2 or more – then OK, UP.
Repeat for all services:
Pods status and number of WorkerNodes
The second important thing to monitor is the status of the Kubernetes Pods and the number of EC2 instances in the AWS EC2 AutoScale group as we have a dedicated node pool for the GitLab cluster.
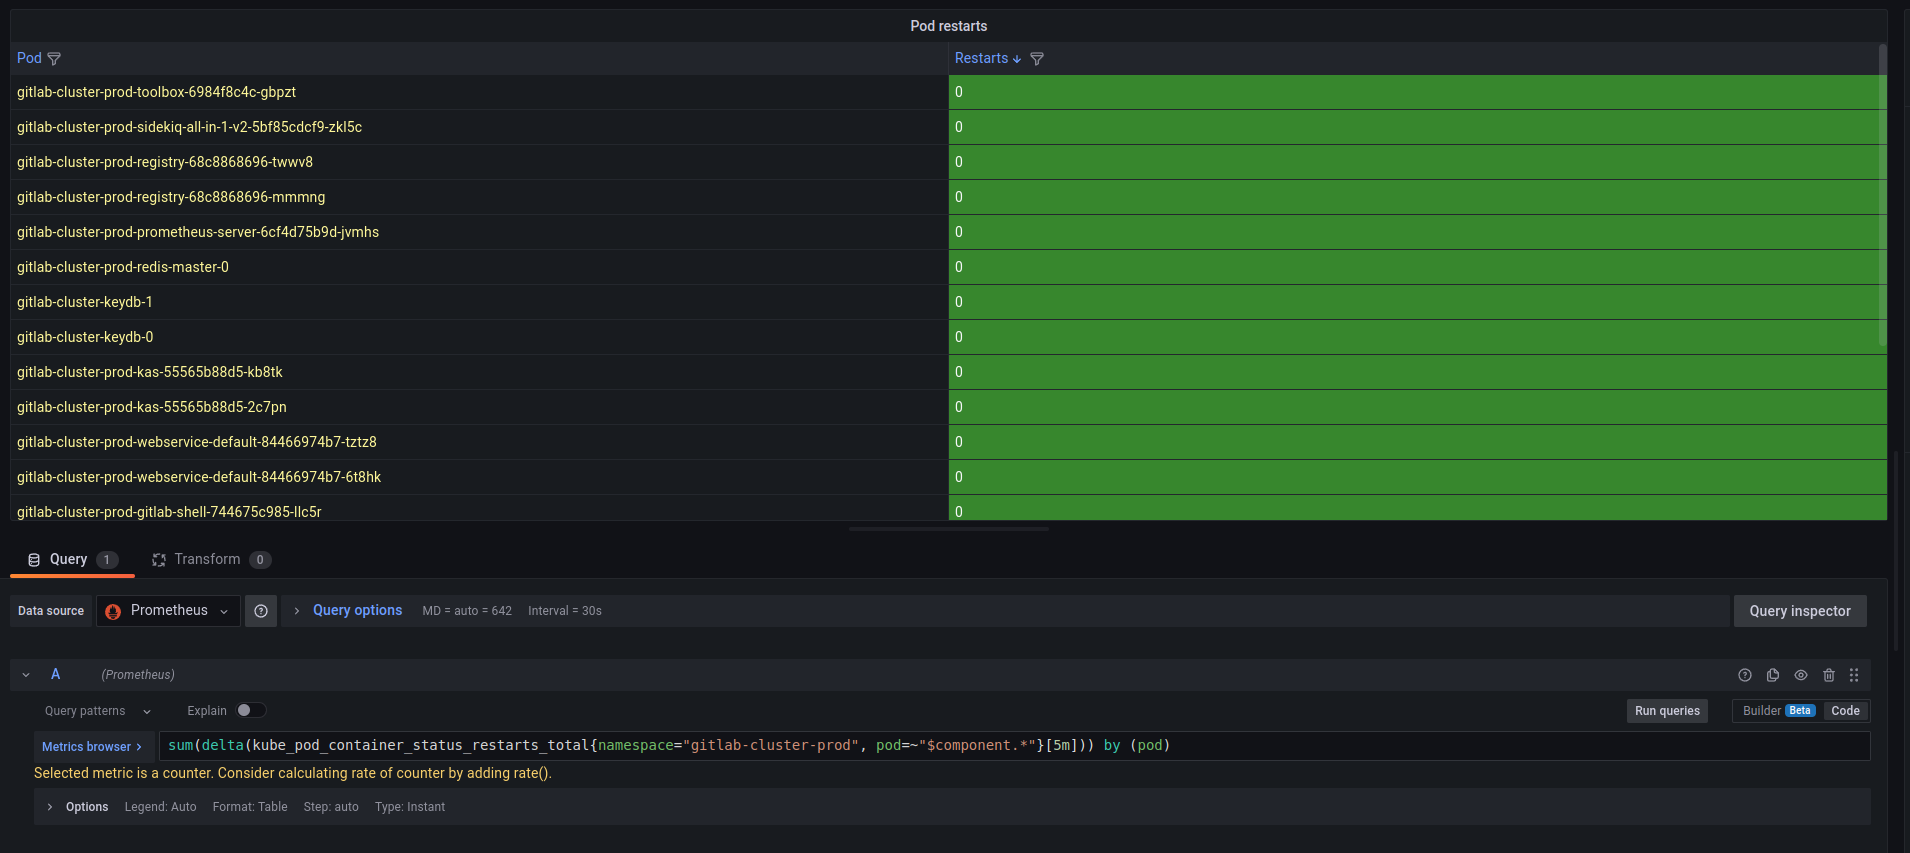
Pod restarts table
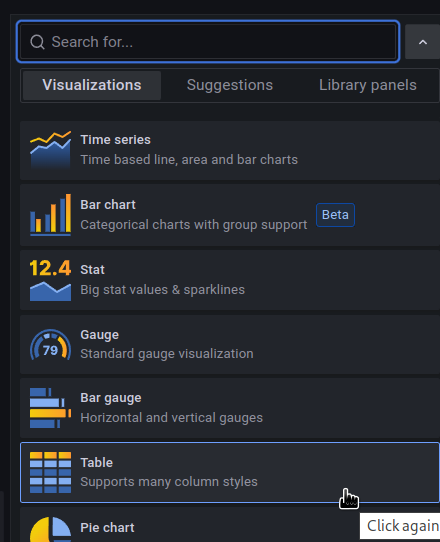
For Pod restarts, we can use the Table type:
The request:
sum(delta(kube_pod_container_status_restarts_total{namespace="gitlab-cluster-prod", pod=~"$component.*"}[5m])) by (pod)
And set the Table format:
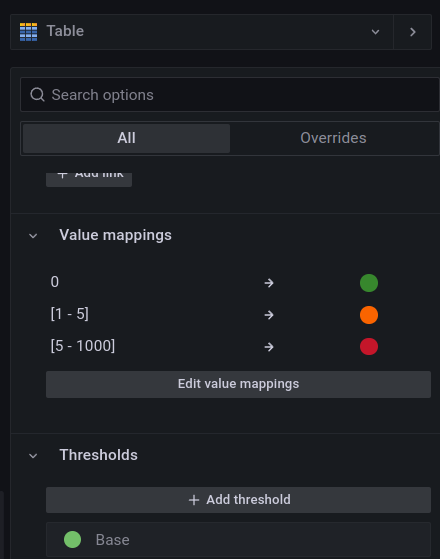
Add the Value mappings – depending on the value in the column of restarts, the cell will change its color:
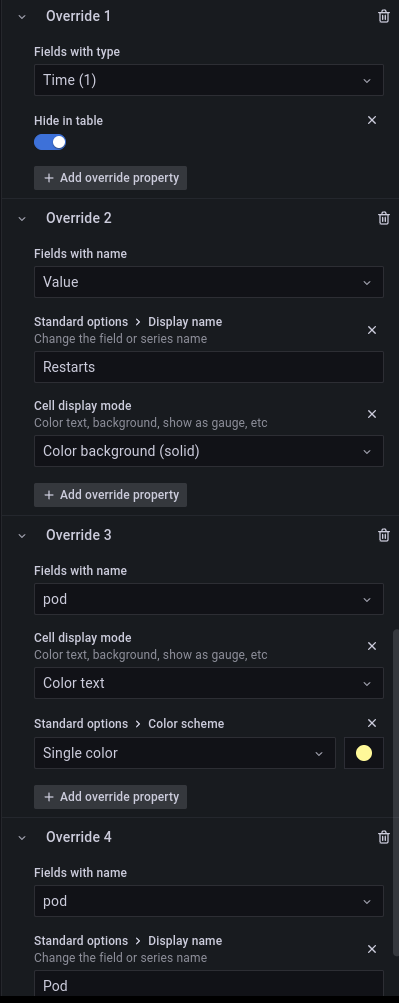
In Override, hide the Time column, rename the Value field Restarts, and change the color of the Pod column and its name:
The result:
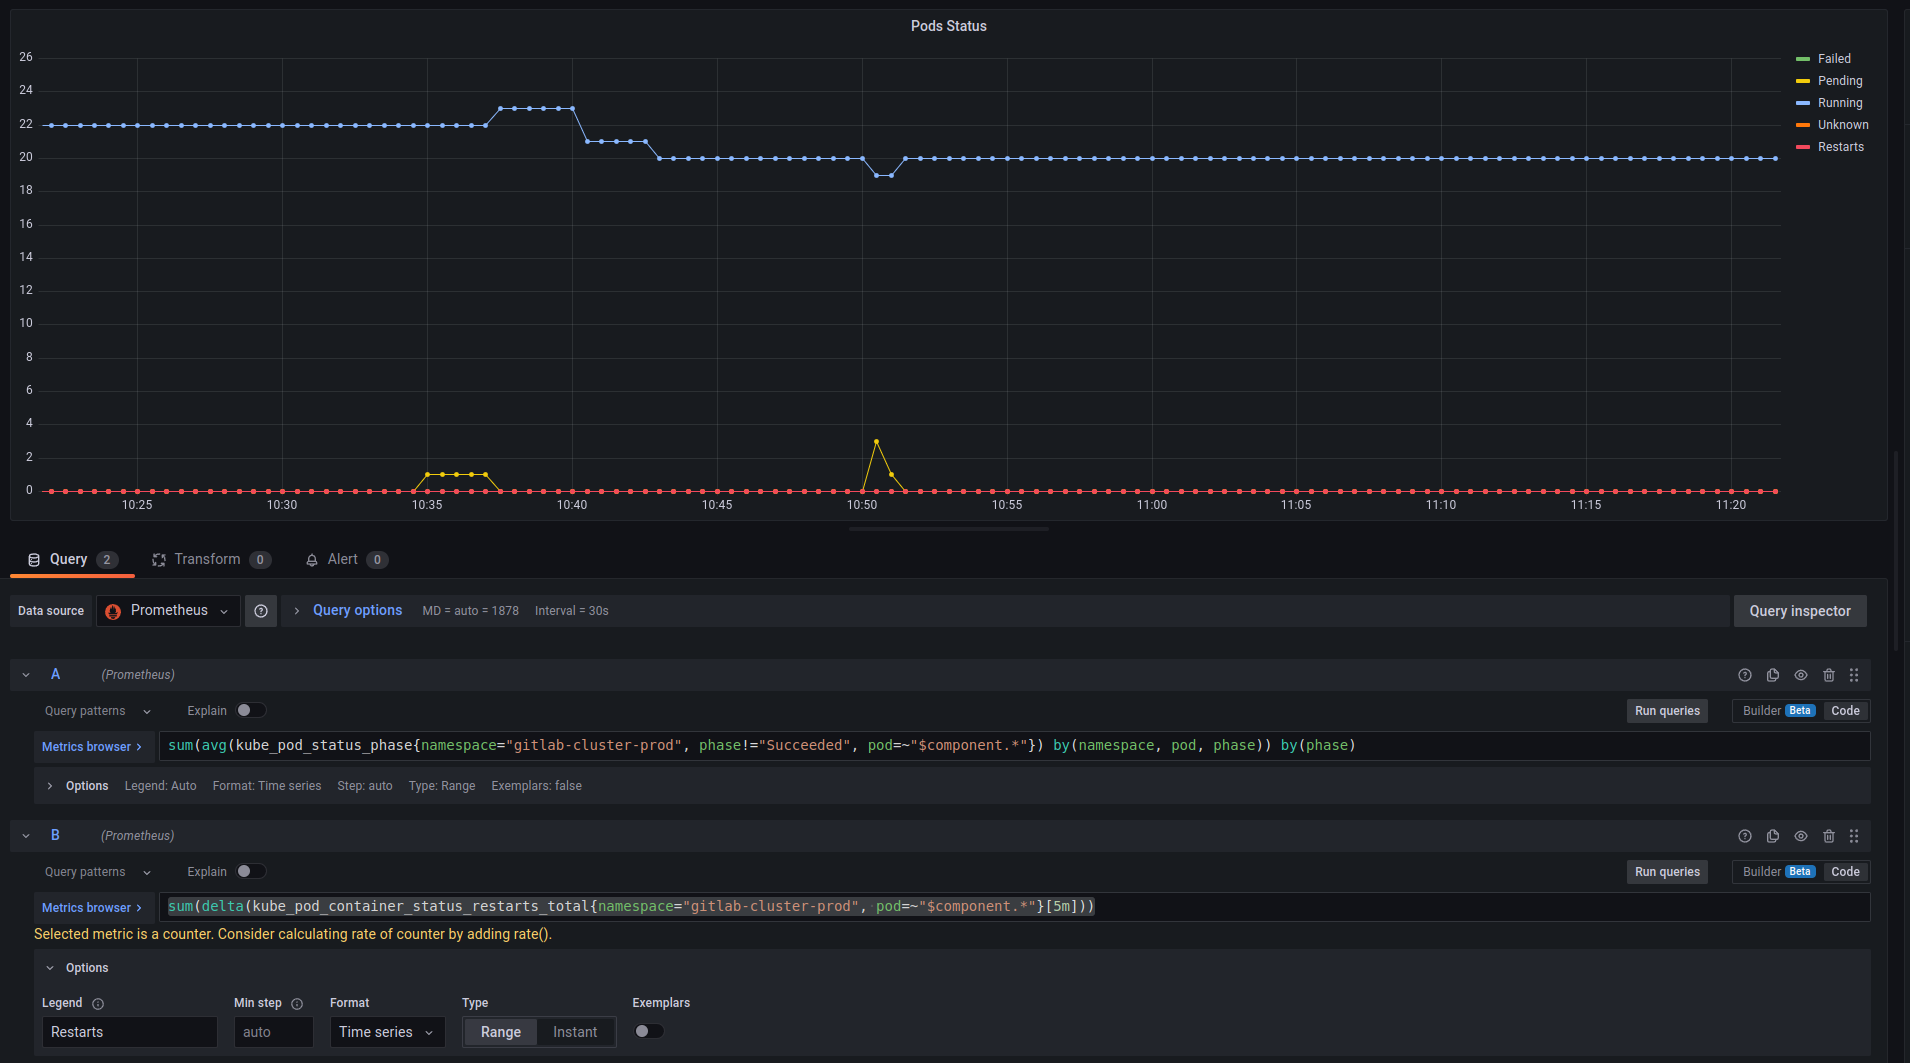
Pods status graph
Next, let’s display the status of Pods – restarts, Pending, etc.
For this, we can use the following query:
sum(avg(kube_pod_status_phase{namespace="gitlab-cluster-prod", phase!="Succeeded", pod=~"$component.*"}) by(namespace, pod, phase)) by(phase)
To display reboots:
sum(delta(kube_pod_container_status_restarts_total{namespace="gitlab-cluster-prod", pod=~"$component.*"}[5m]))
And the result here:
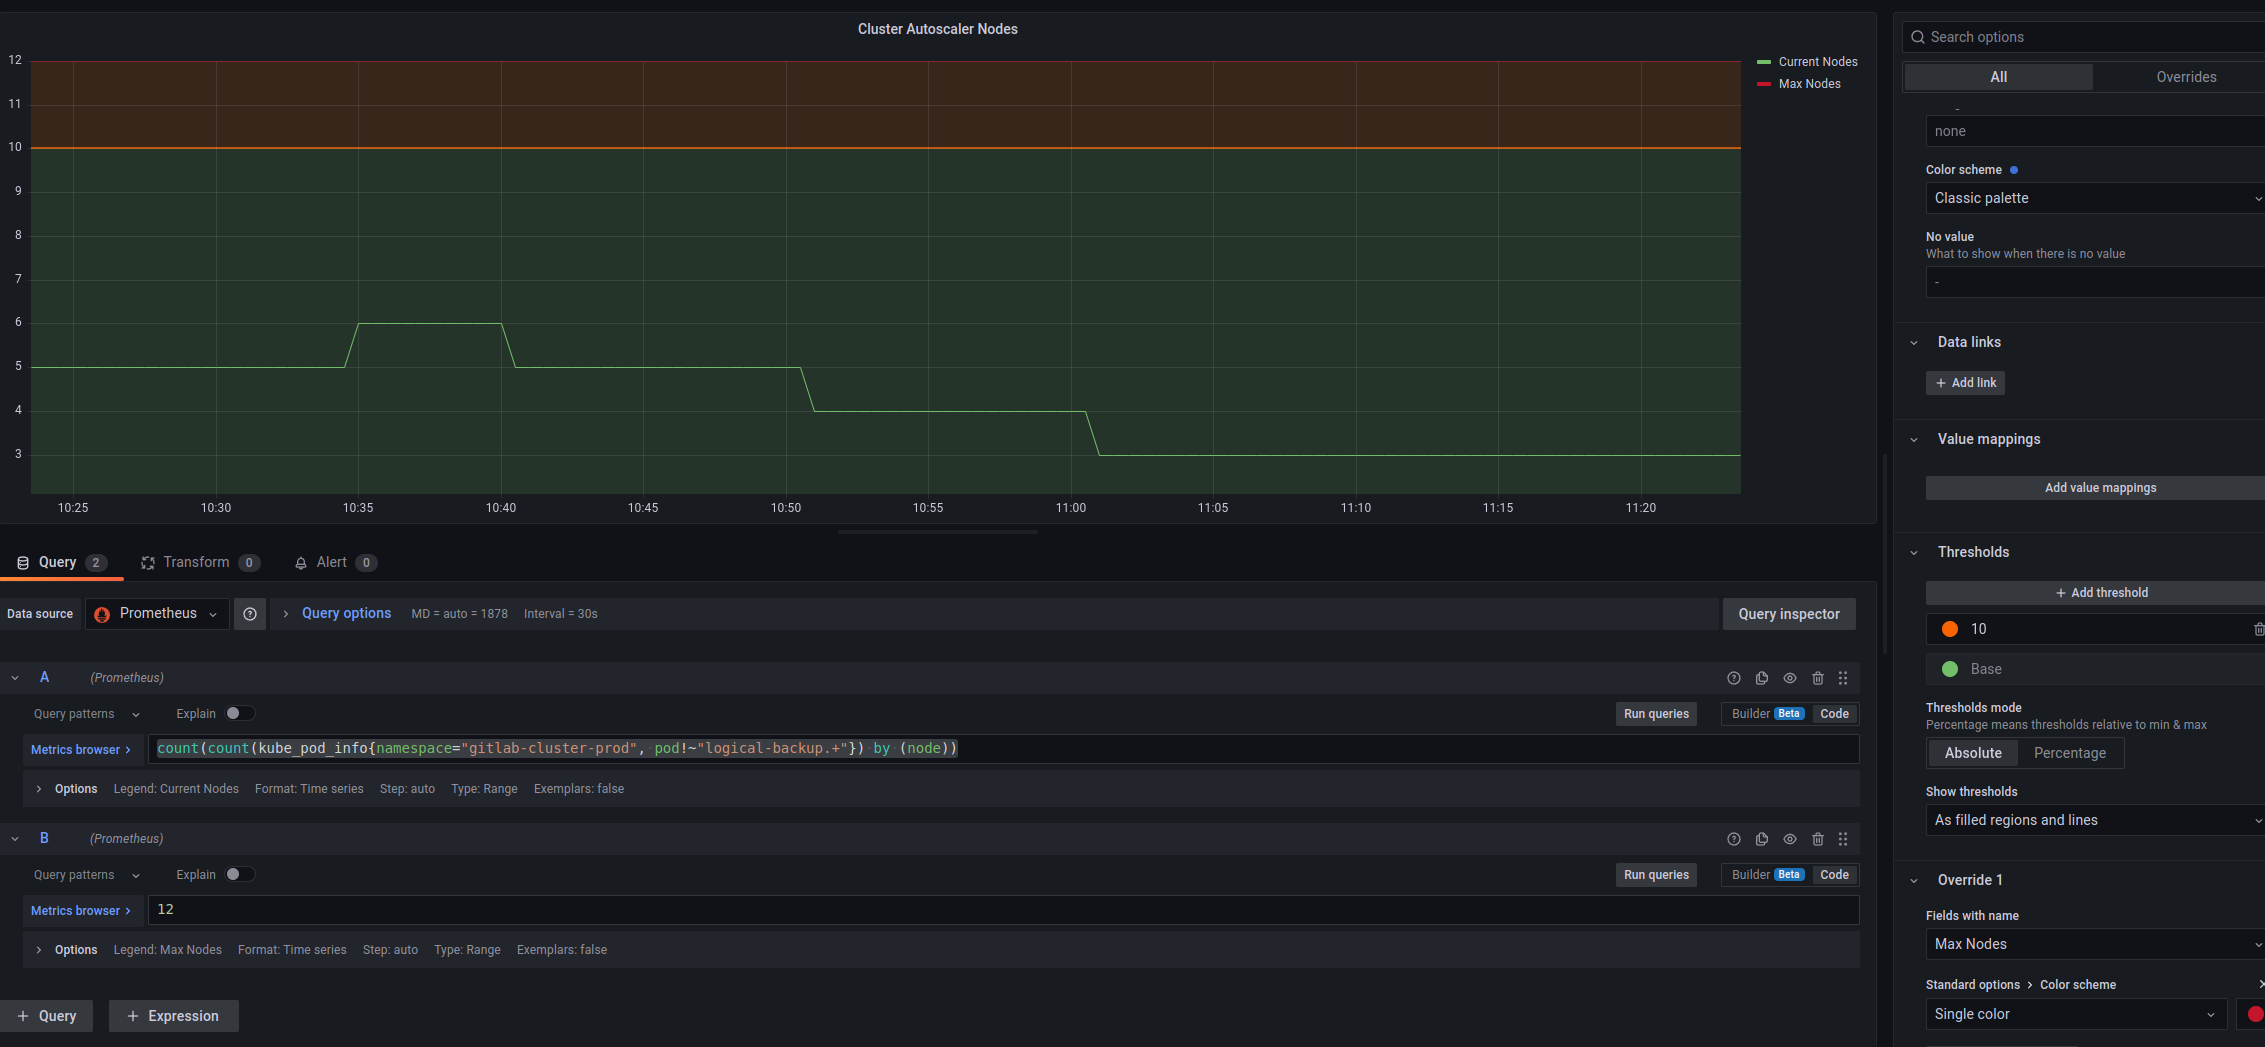
Cluster Autoscaler Worker Nodes
Here it is a bit more interesting: we need to count all Kubernetes Worker Nodes on which there are GitLab Pods, but the metrics from the Cluster AutoScaler itself have no labels like “namespace”, so we will use the metric kube_pod_info, which has the labels namespace and node, and from the sum of the node we will find out the number of EC2 instances:
count(count(kube_pod_info{namespace="gitlab-cluster-prod", pod!~"logical-backup.+"}) by (node))
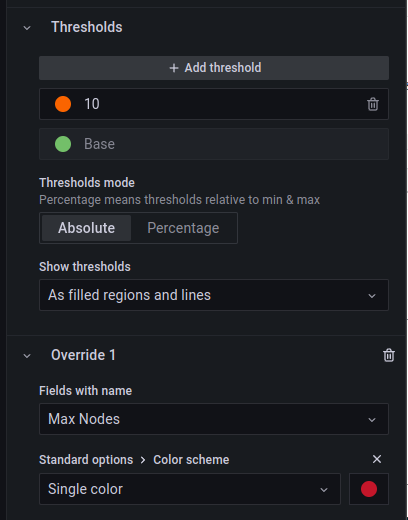
I had to set the value manually for the Max nodes, but it is unlikely to be changed often.
In Thresholds, set the value when you need to pay attention, let it be 10, and turn on the Show thresholds = As filled regions and lines to see it on the graph:
The result:
And all together looks like this:
CPU and Memory by Pod
CPU by Pod
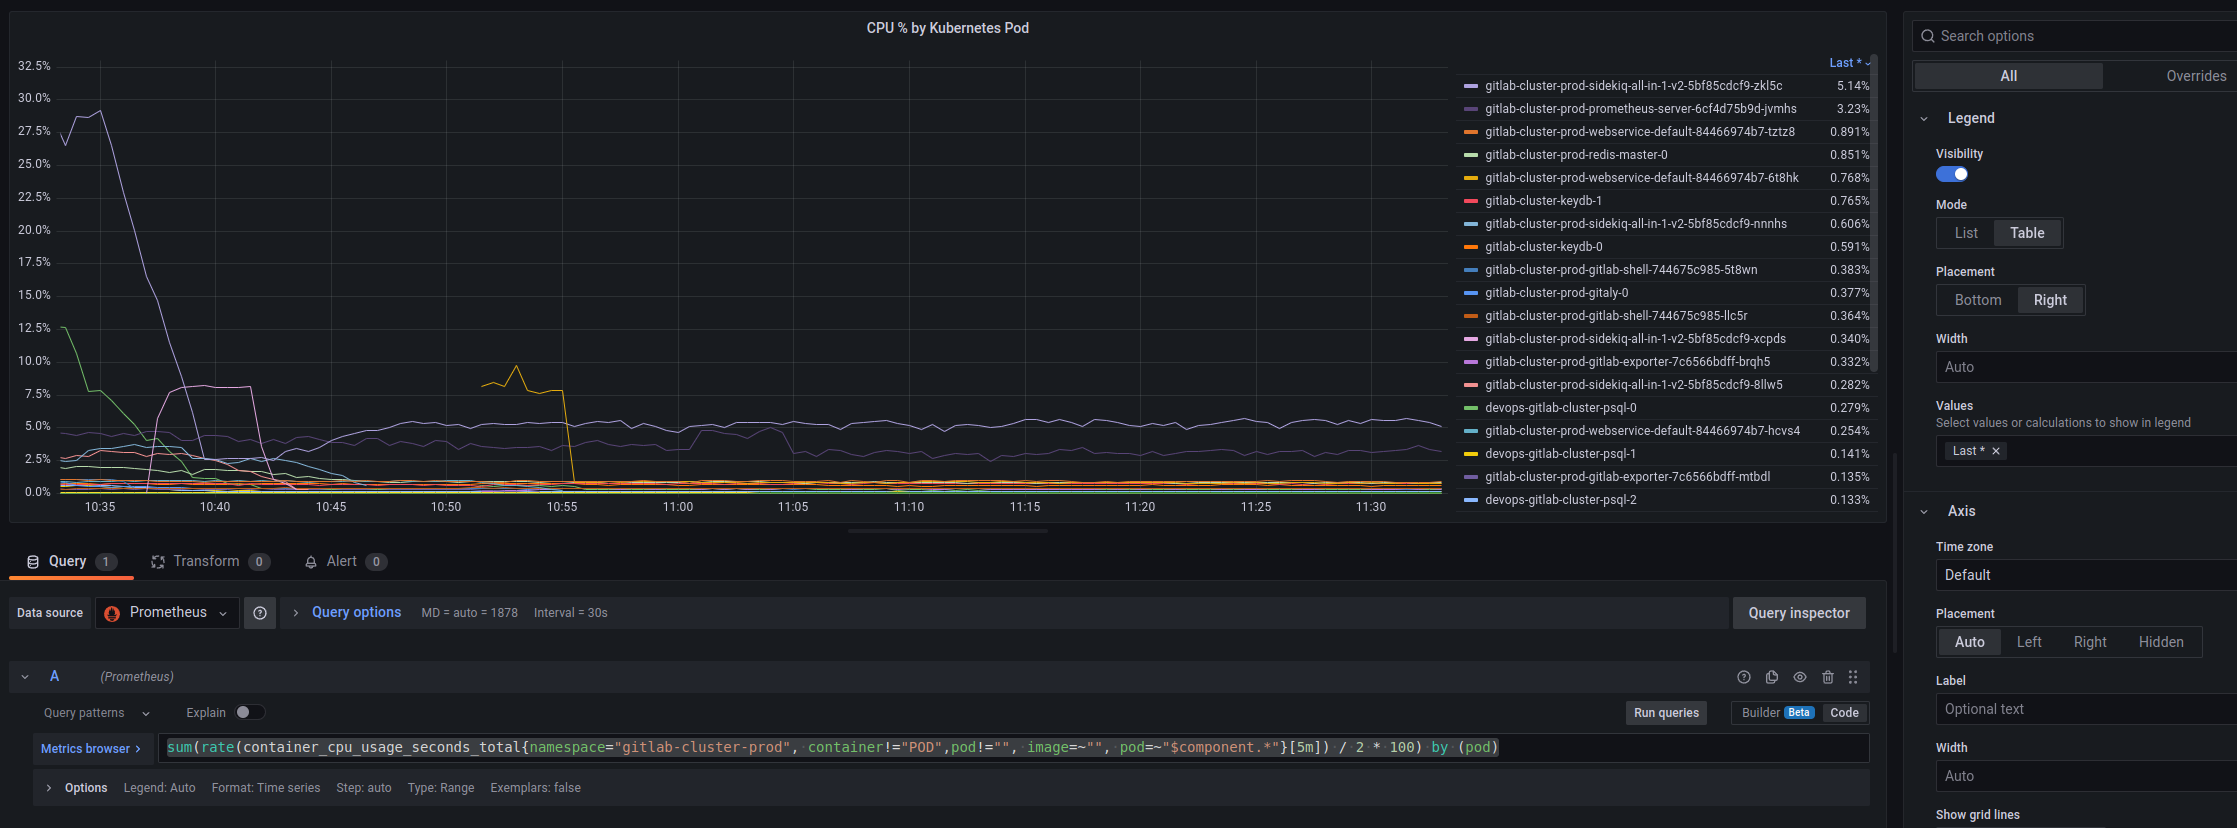
Calculate the % of the available CPU by the number of cores. Here, I also had to set this number manually, knowing the EC2 type, but it’s possible to search for metrics like “cores allocatable”:
sum(rate(container_cpu_usage_seconds_total{namespace="gitlab-cluster-prod", container!="POD",pod!="", image=~"", pod=~"$component.*"}[5m]) / 2 * 100) by (pod)
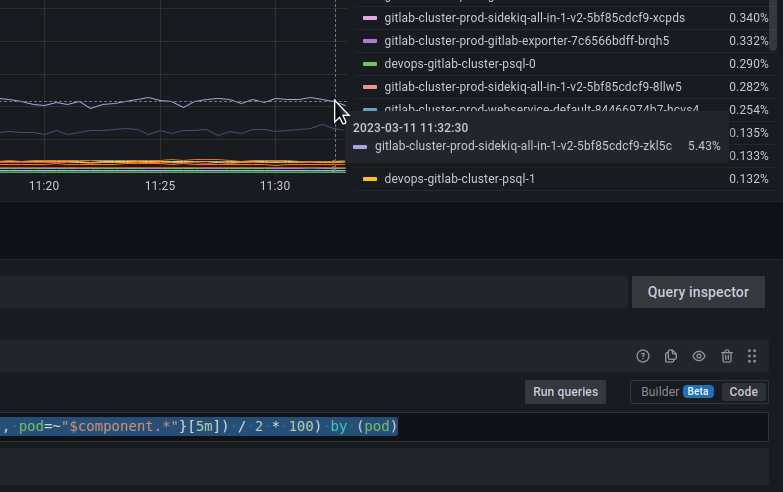
Don’t remember where I got the request, but the result of the kubectl top pod confirms the data – let’s check it on the Sidekiq Pod:
And top:
121 millicpu out of 2000 available (2 cores) is:
[simterm]
>>> 121/2000*100
6.05
[/simterm]
On the graph, the is 5.43, which looks approx the same.
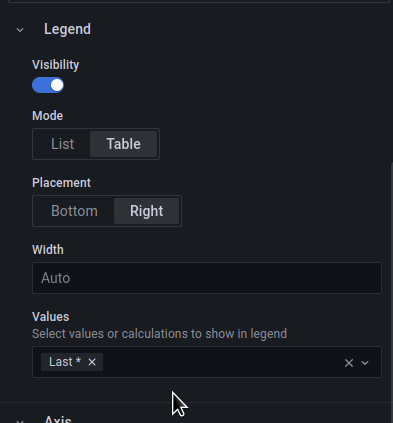
In the Legend, move the list to the right, and include Values = Last to sort by values:
The result:
Memory by Pod
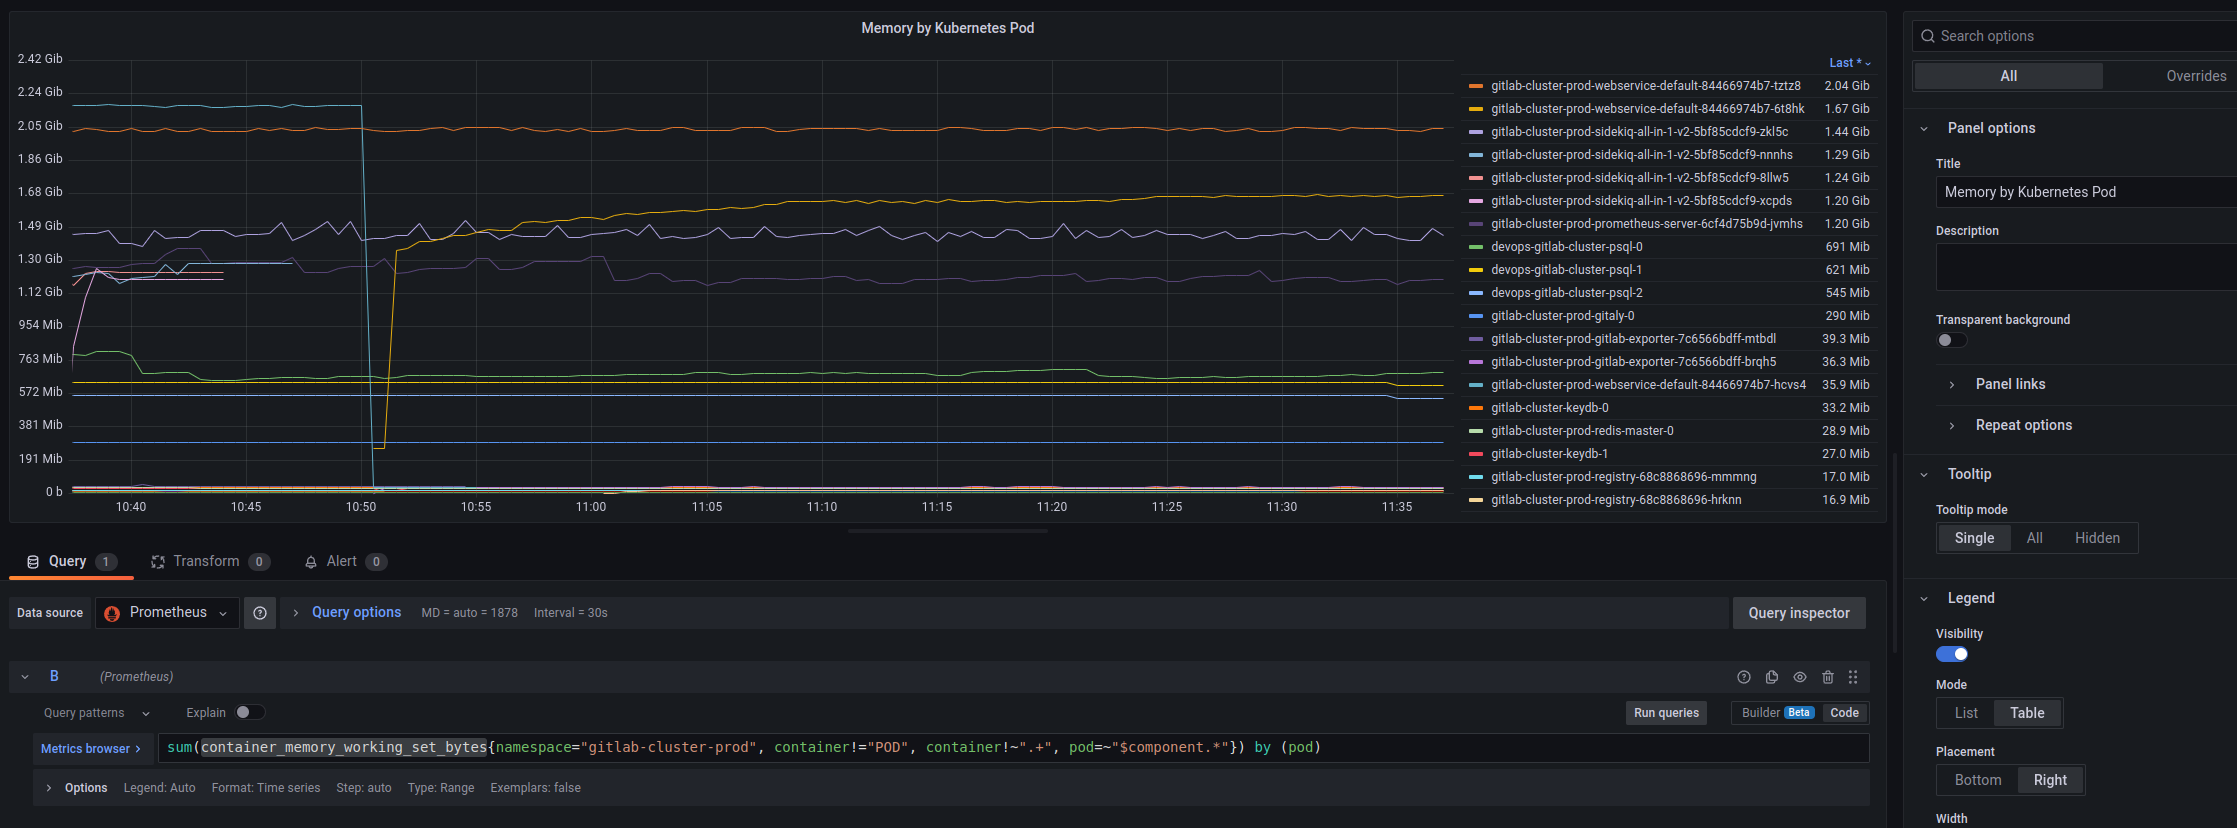
Here we count by the container_memory_working_set_bytes, the table settings are similar:
By the way, it was possible to display % of the available memory on the node, but let it be better in “clean” bytes.
Or you can add Threshold with a maximum of 17179869184 bytes (the EC2 max memory of 16GB), but then the graphics from Pods will not be so well visible.
And together we have the following:
Disc statistics
Gitaly PVC used space
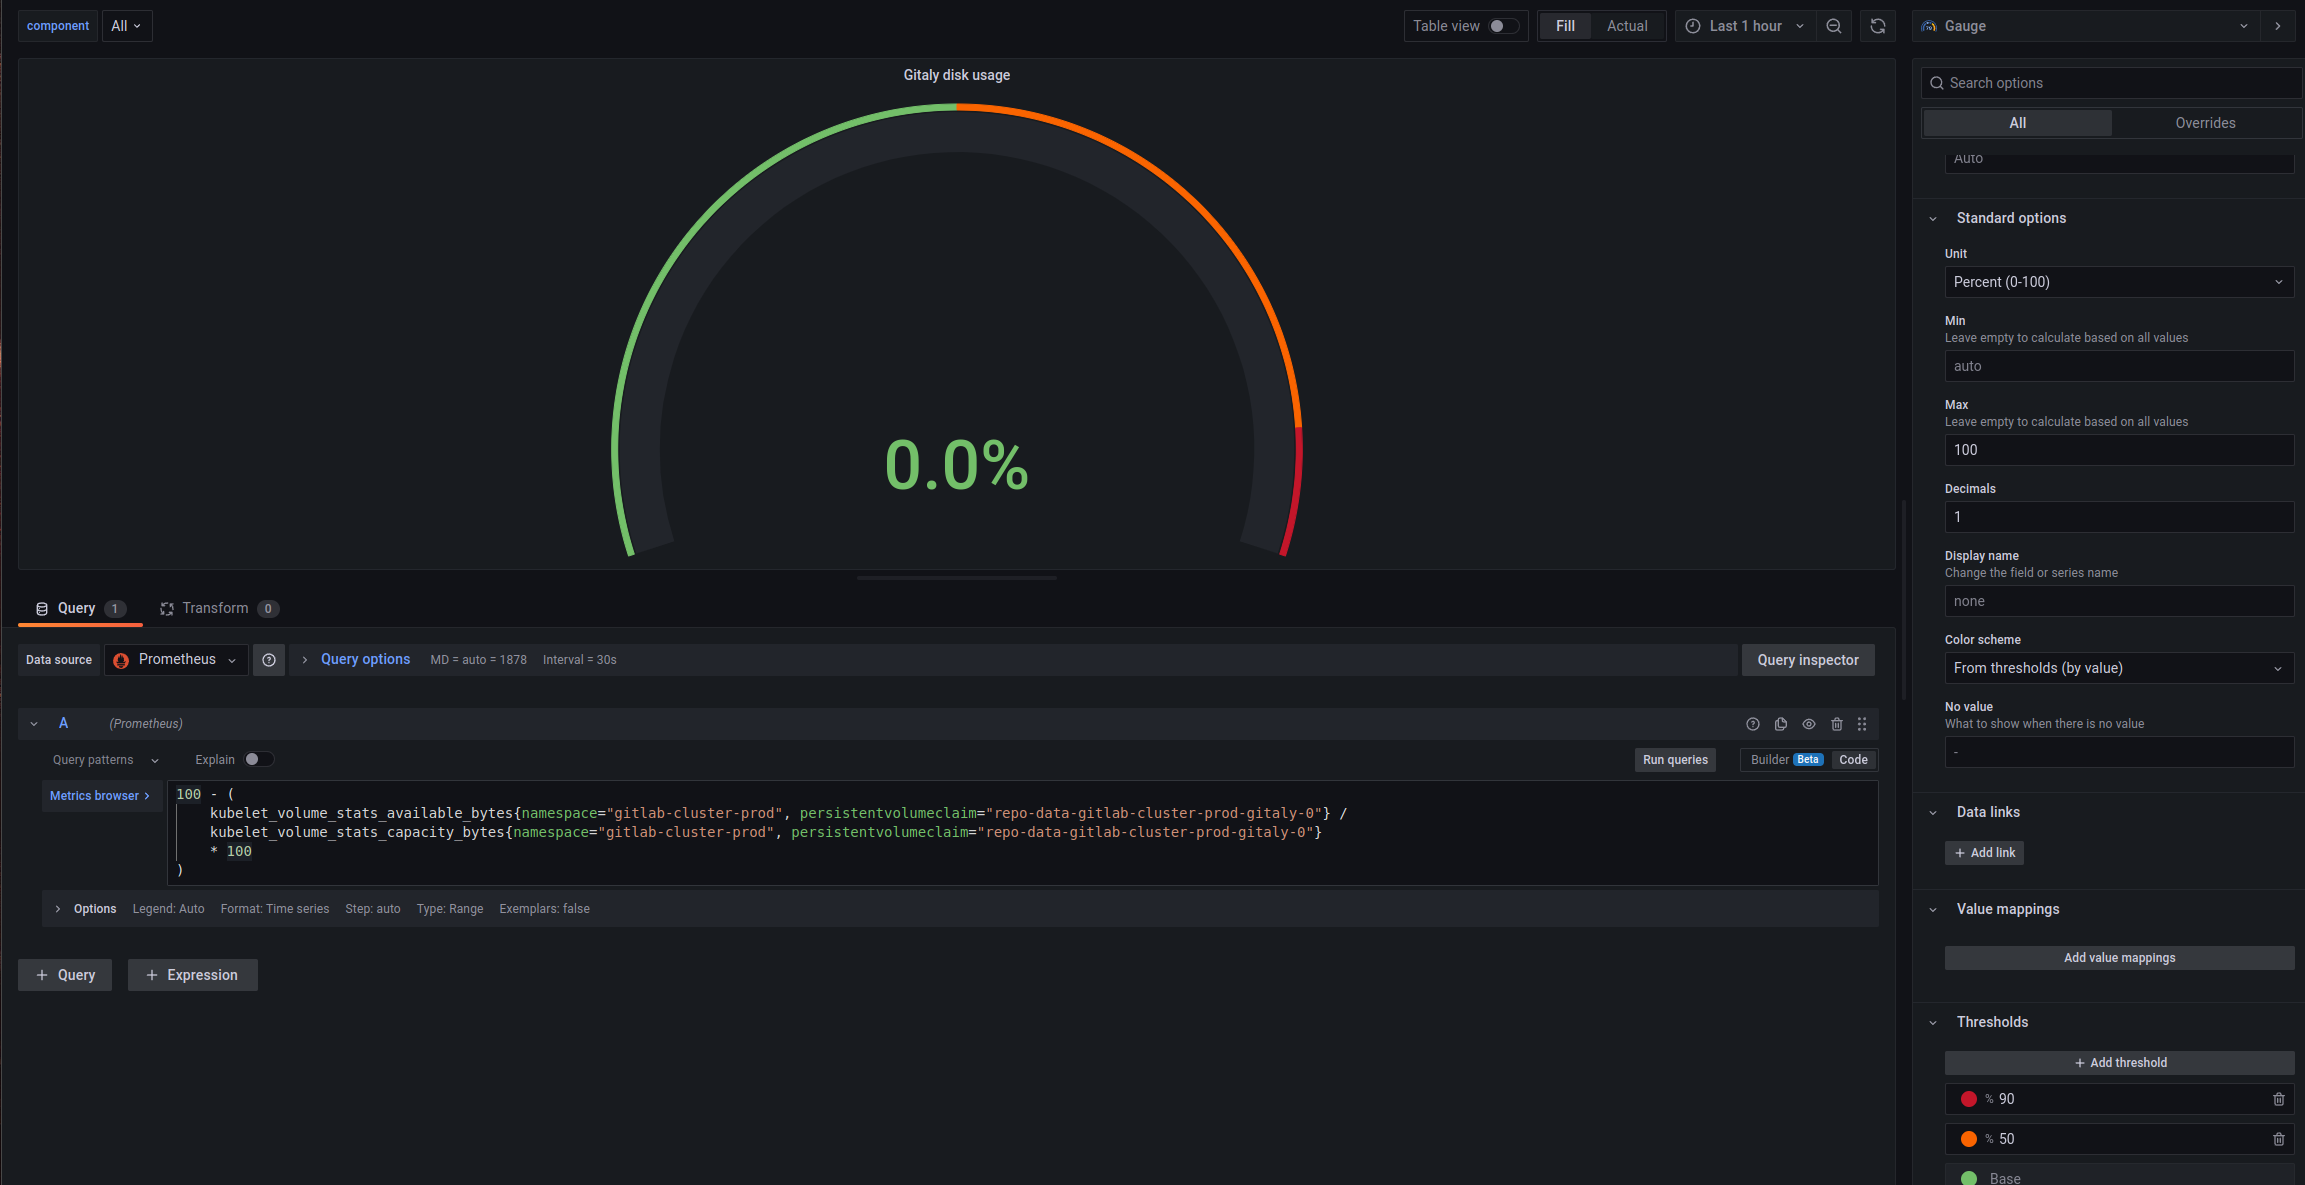
First of all, I would like to see the free space on the Gitaly disk, where all the repositories will be stored, and general statistics on disk writes and reads.
To get the % occupied space on Gitaly, use the query (taken from some default dashboard of the Kube Prometheus Stack):
100 - (
    kubelet_volume_stats_available_bytes{namespace="gitlab-cluster-prod", persistentvolumeclaim="repo-data-gitlab-cluster-prod-gitaly-0"} /
    kubelet_volume_stats_capacity_bytes{namespace="gitlab-cluster-prod", persistentvolumeclaim="repo-data-gitlab-cluster-prod-gitaly-0"}
    * 100
)
And type Gauge, Unit – Percent 0-100, and add Thresholds:
Disc IOPS
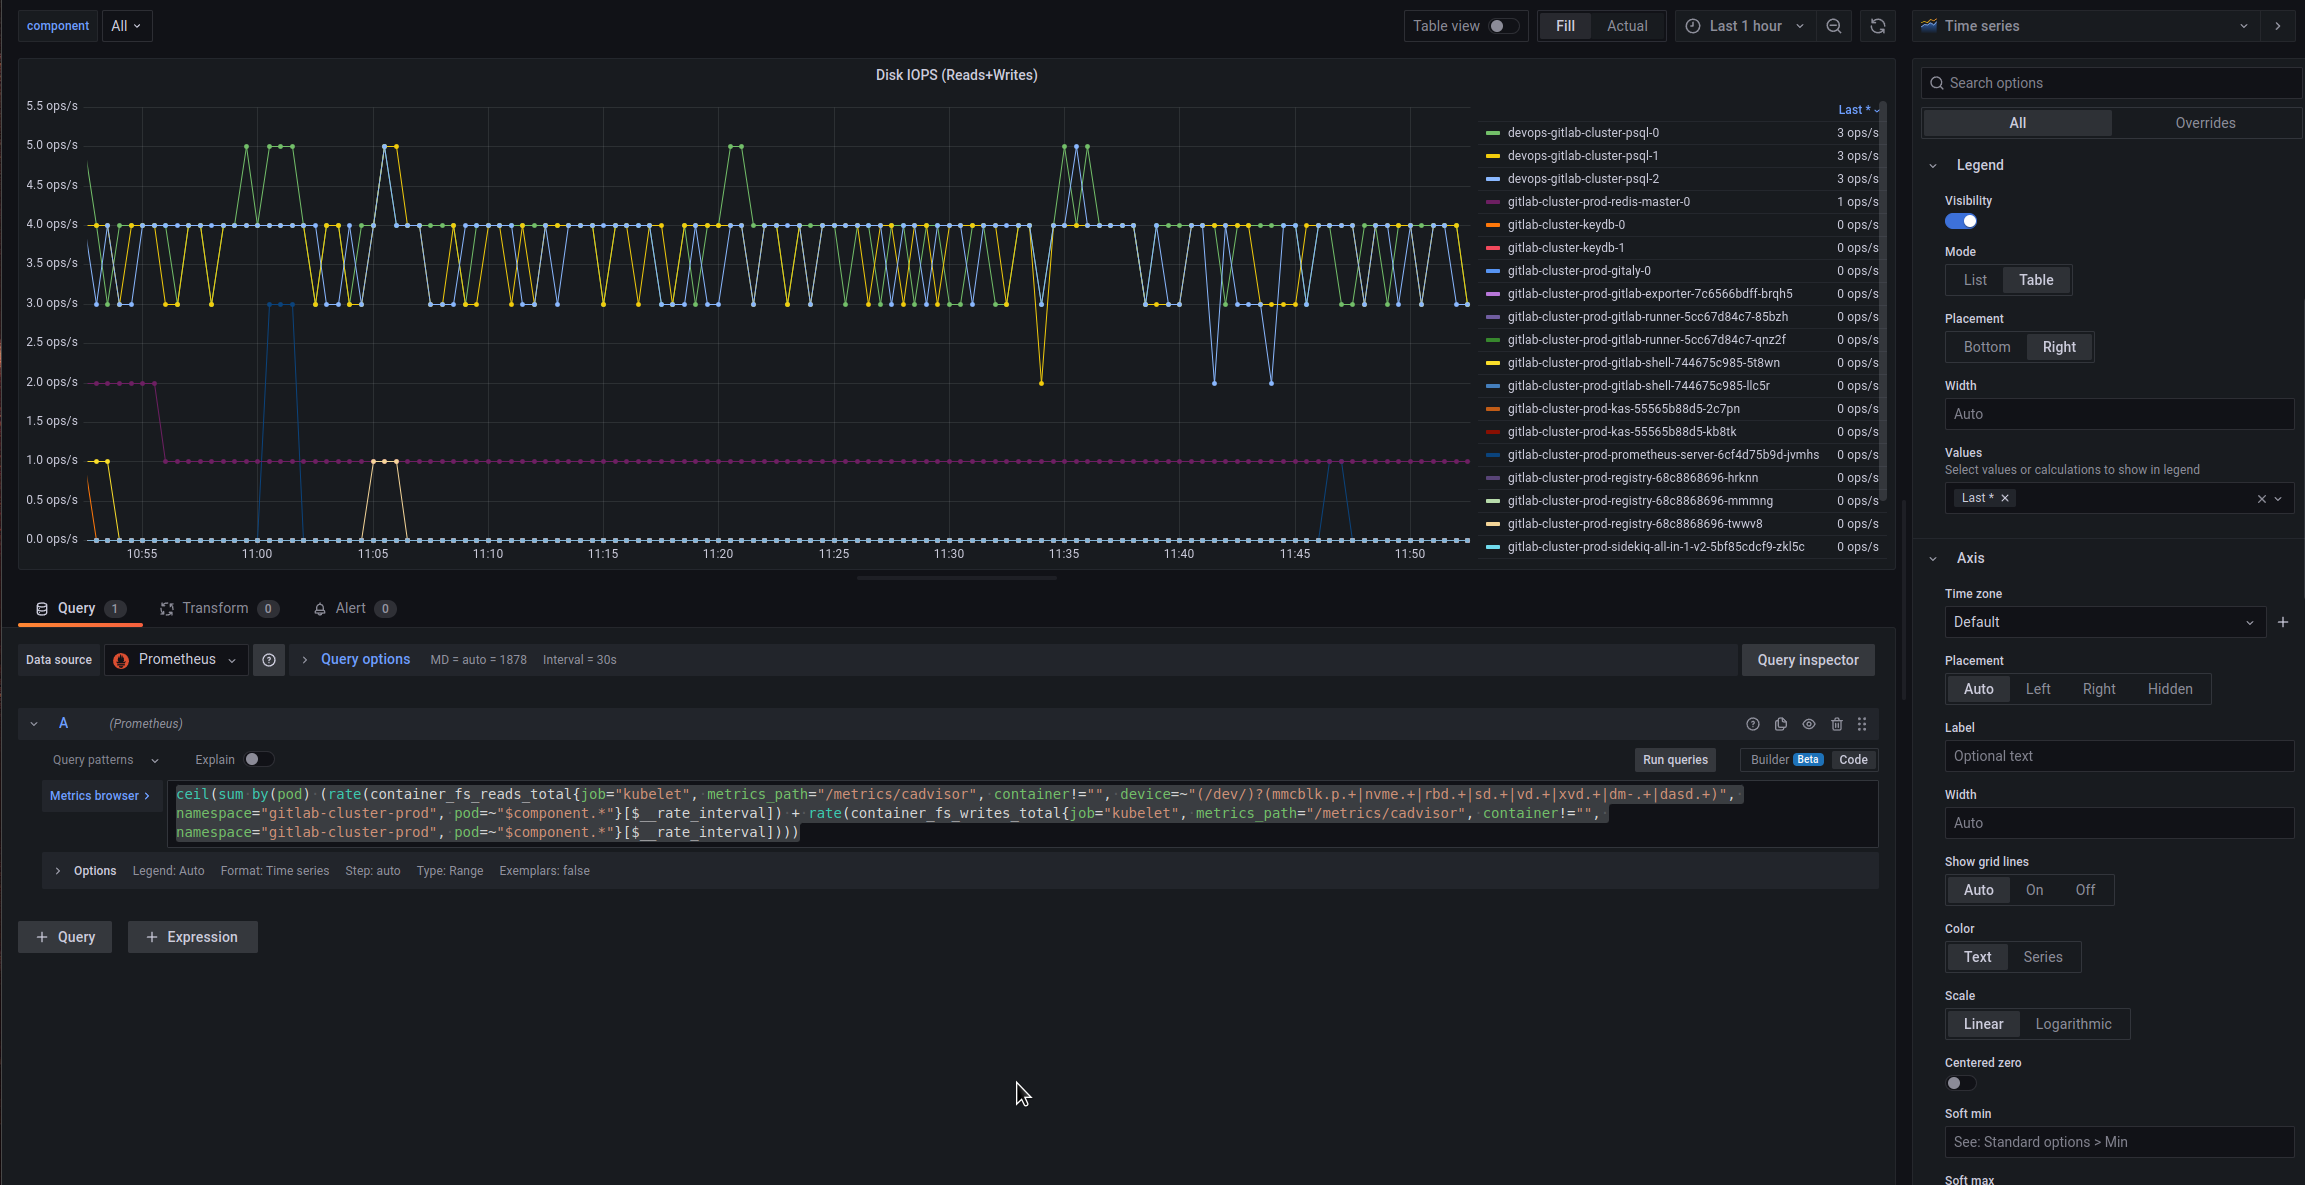
Let’s add Operations per second on the disks, the query was also taken somewhere from ready-made boards:
ceil(sum by(pod) (rate(container_fs_reads_total{job="kubelet", metrics_path="/metrics/cadvisor", container!="", device=~"(/dev/)?(mmcblk.p.+|nvme.+|rbd.+|sd.+|vd.+|xvd.+|dm-.+|dasd.+)", namespace="gitlab-cluster-prod", pod=~"$component.*"}[$__rate_interval]) + rate(container_fs_writes_total{job="kubelet", metrics_path="/metrics/cadvisor", container!="", namespace="gitlab-cluster-prod", pod=~"$component.*"}[$__rate_interval])))
Sum up by the Pods, in the Legend add the Values = Last again to be able to sort:
Disc Throughput
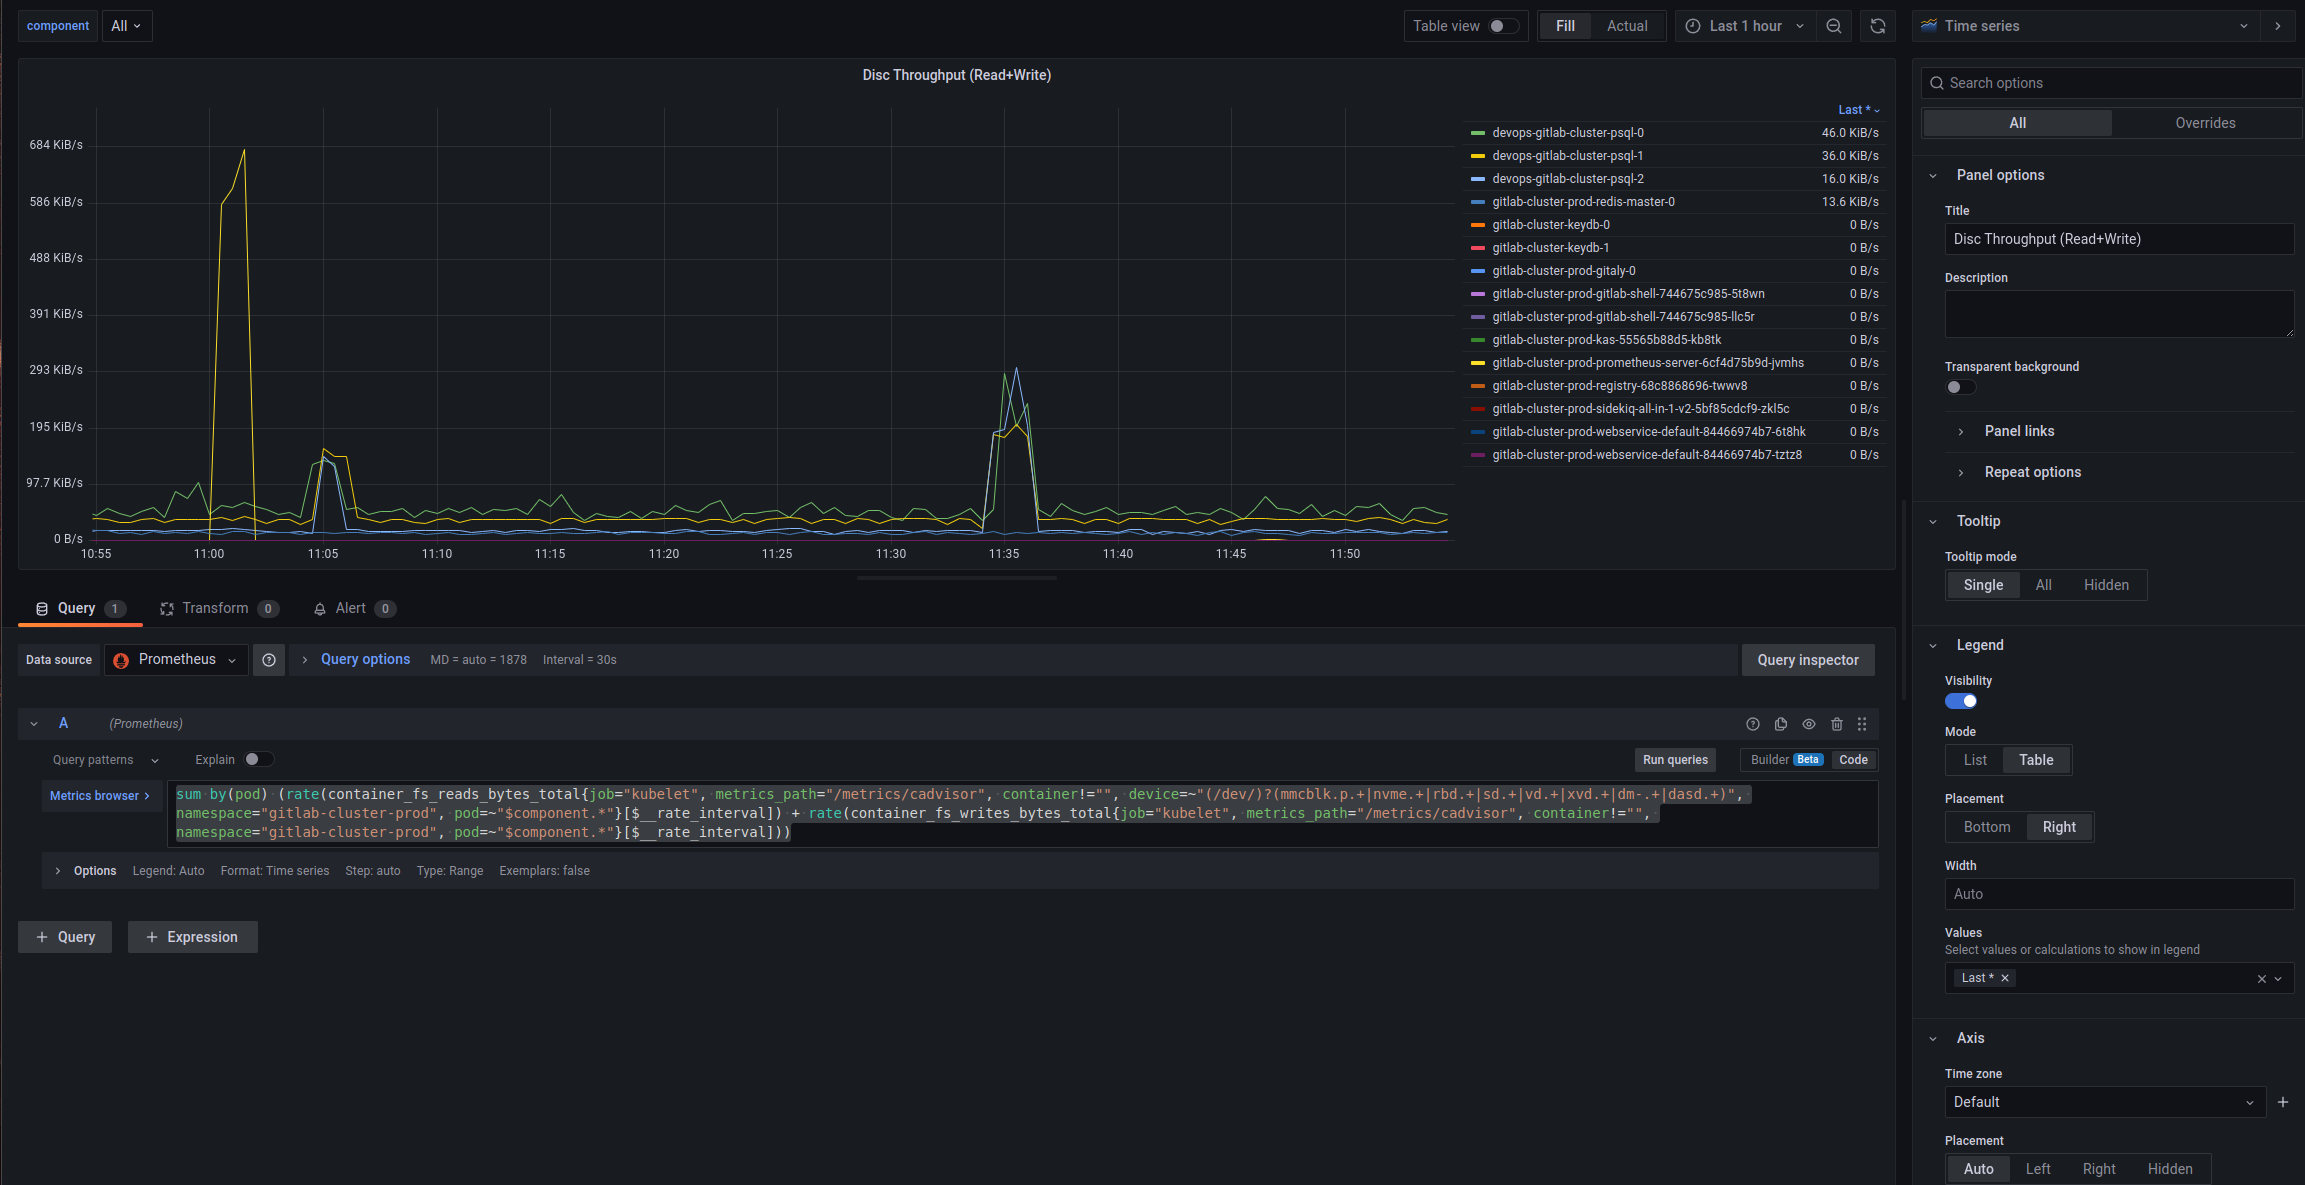
Everything is basically the same here, only a different query:
sum by(pod) (rate(container_fs_reads_bytes_total{job="kubelet", metrics_path="/metrics/cadvisor", container!="", device=~"(/dev/)?(mmcblk.p.+|nvme.+|rbd.+|sd.+|vd.+|xvd.+|dm-.+|dasd.+)", namespace="gitlab-cluster-prod", pod=~"$component.*"}[$__rate_interval]) + rate(container_fs_writes_bytes_total{job="kubelet", metrics_path="/metrics/cadvisor", container!="", namespace="gitlab-cluster-prod", pod=~"$component.*"}[$__rate_interval]))
And all together:
Networking
It will probably be useful to see what is happening with the network – errors and In/Out rates.
Received/Transmitted Errors
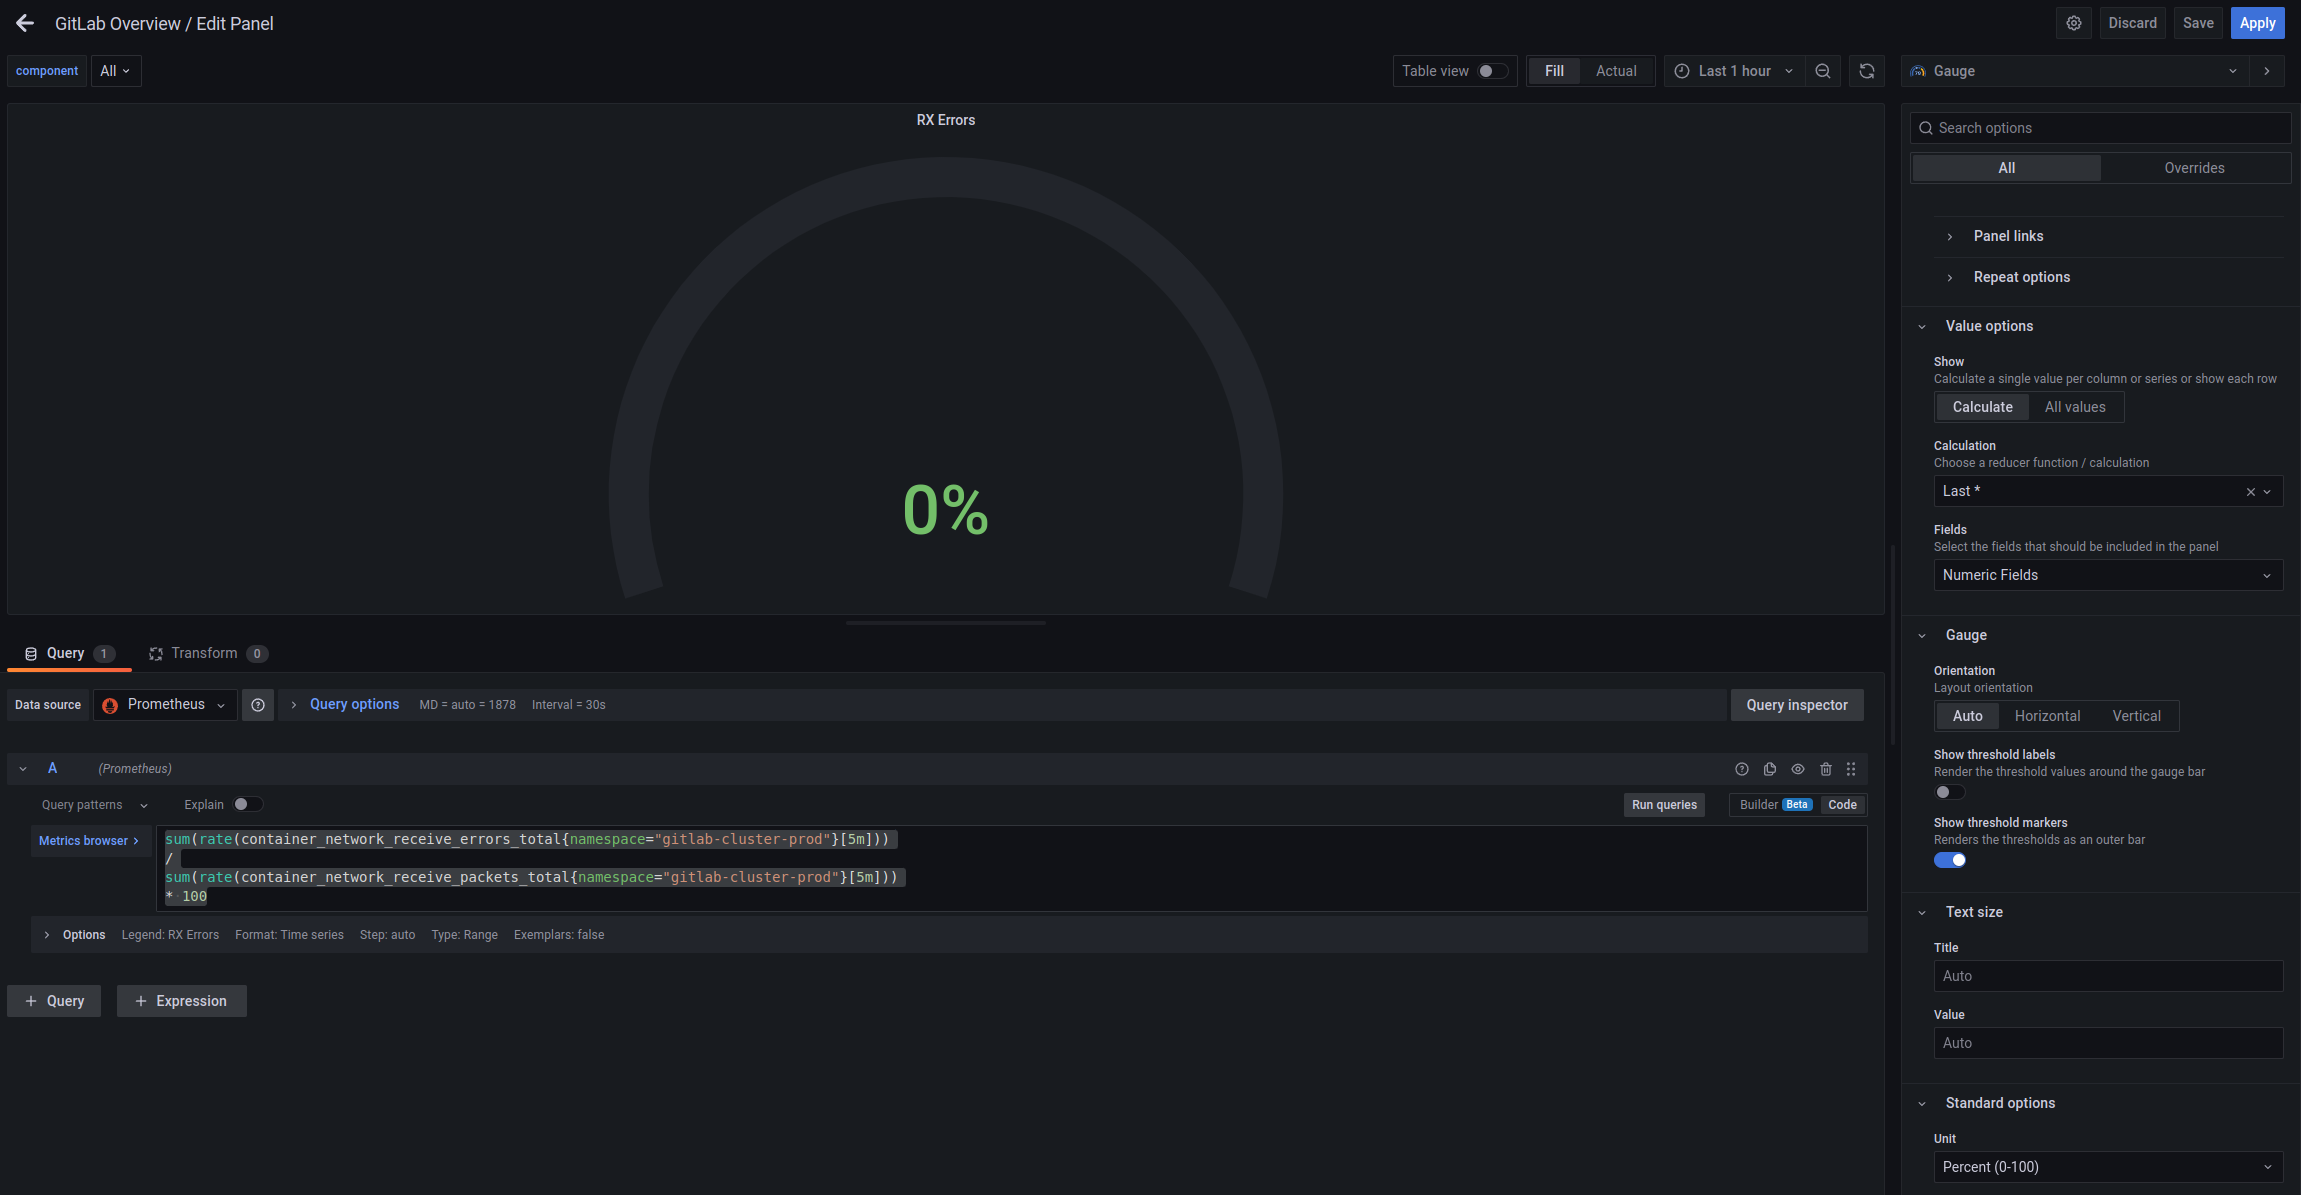
Let’s add a Gauge, where we will display the % of errors – container_network_receive_errors_total which we calculate by the following query:
sum(rate(container_network_receive_errors_total{namespace="gitlab-cluster-prod"}[5m]))
/
sum(rate(container_network_receive_packets_total{namespace="gitlab-cluster-prod"}[5m]))
* 100
And similarly – for the Transmitted:
sum(rate(container_network_transmit_errors_total{namespace="gitlab-cluster-prod"}[5m]))
/
sum(rate(container_network_transmit_packets_total{namespace="gitlab-cluster-prod"}[5m]))
* 100
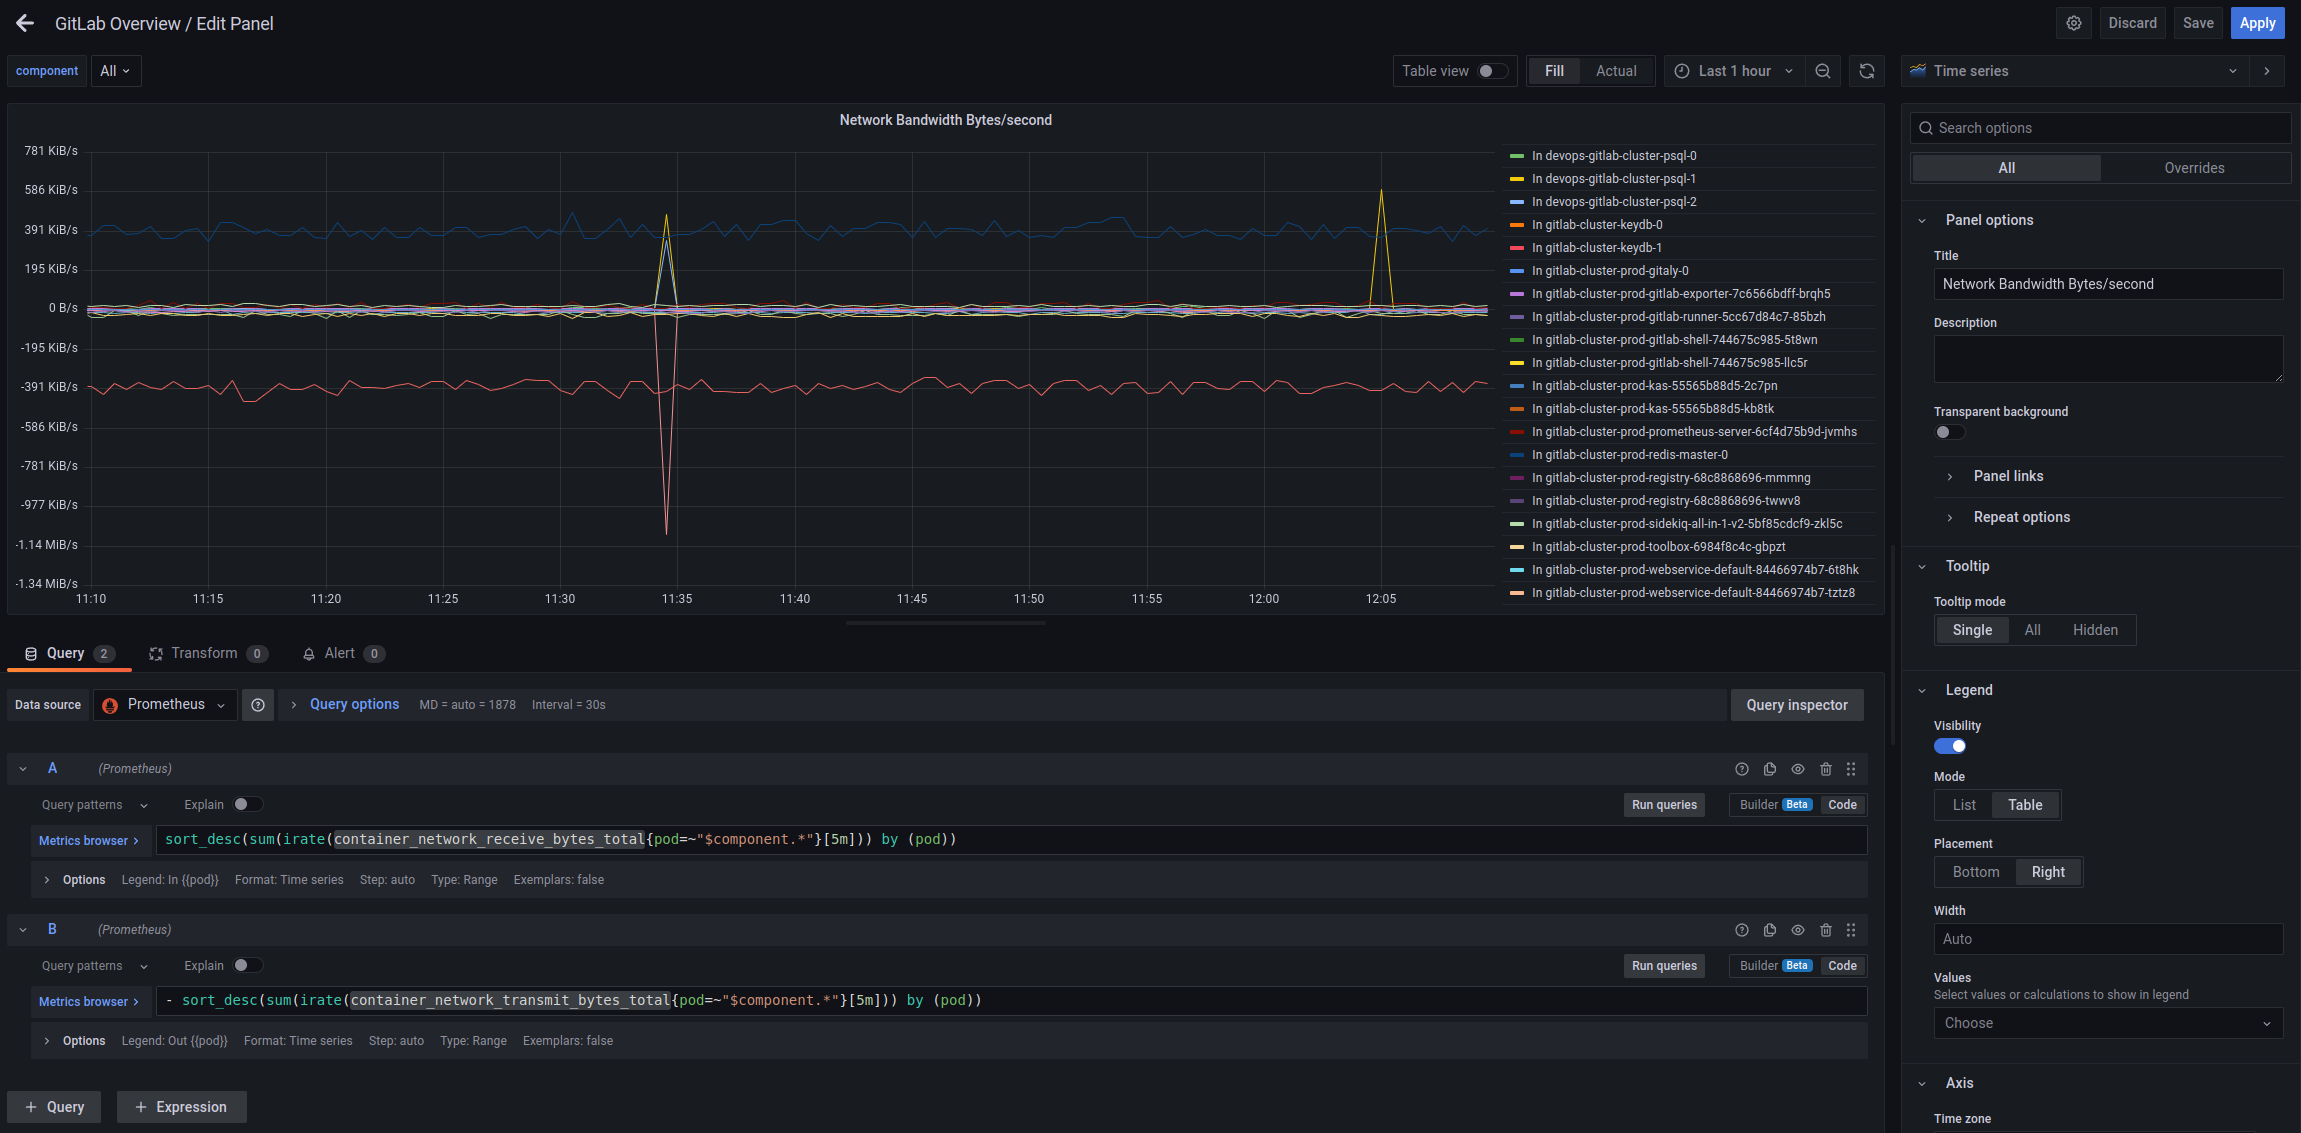
Network Bandwidth Bytes/second
Here we calculate the number of bytes per second on each Pod by using the container_network_receive_bytes_total and container_network_transmit_bytes_total metrics:
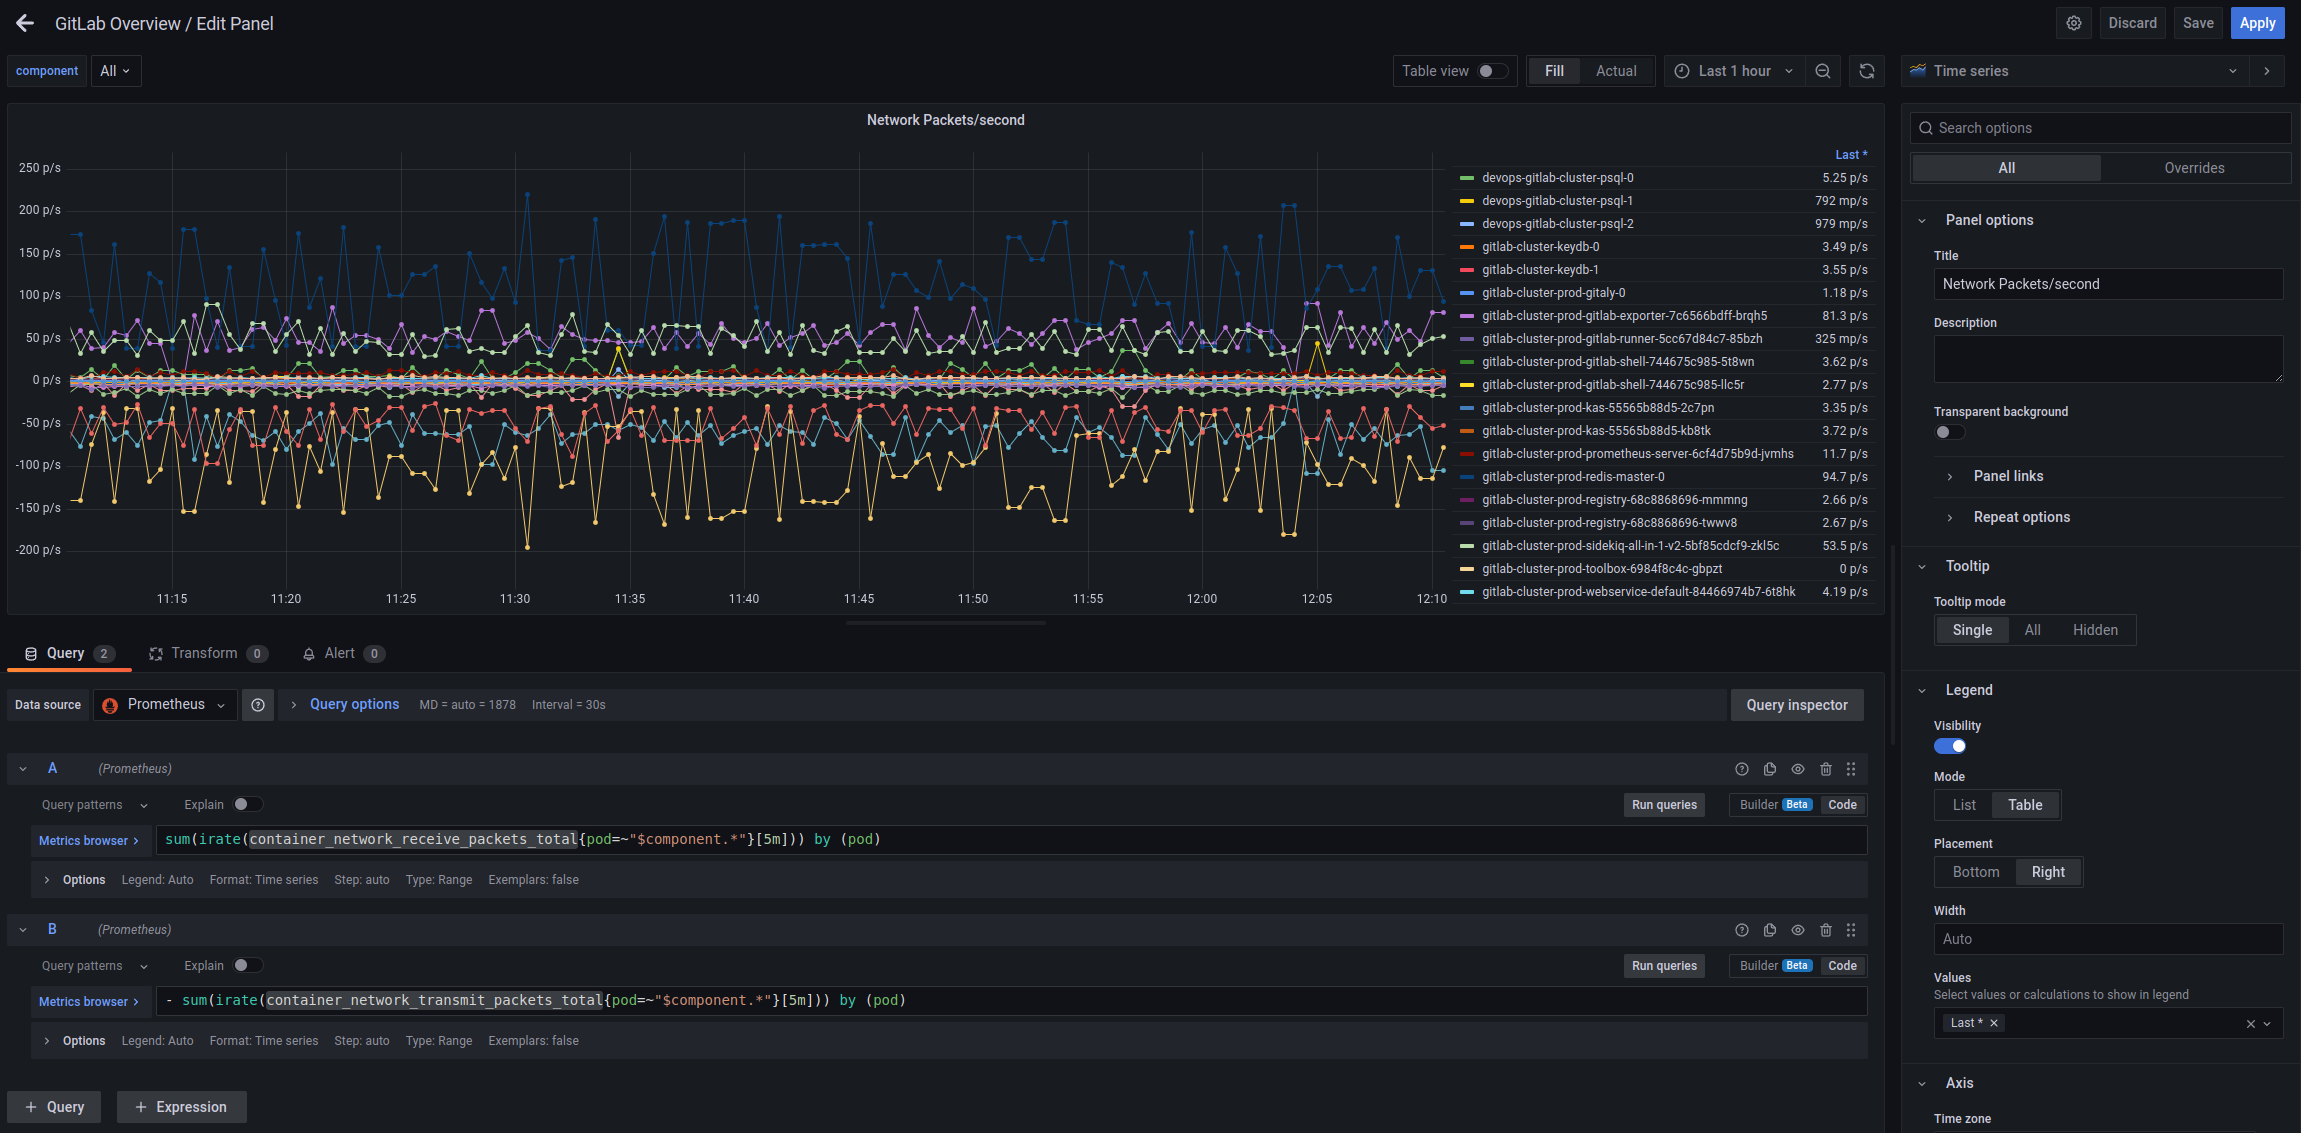
Network Packets/second
Similarly, just with metrics container_network_receive_packets_total/ container_network_transmit_packets_total:
Not sure if it will be useful, but for now let it be.
Webservice HTTP statistic
For the general picture, let’s add some data about HTTP requests to the Webservice.
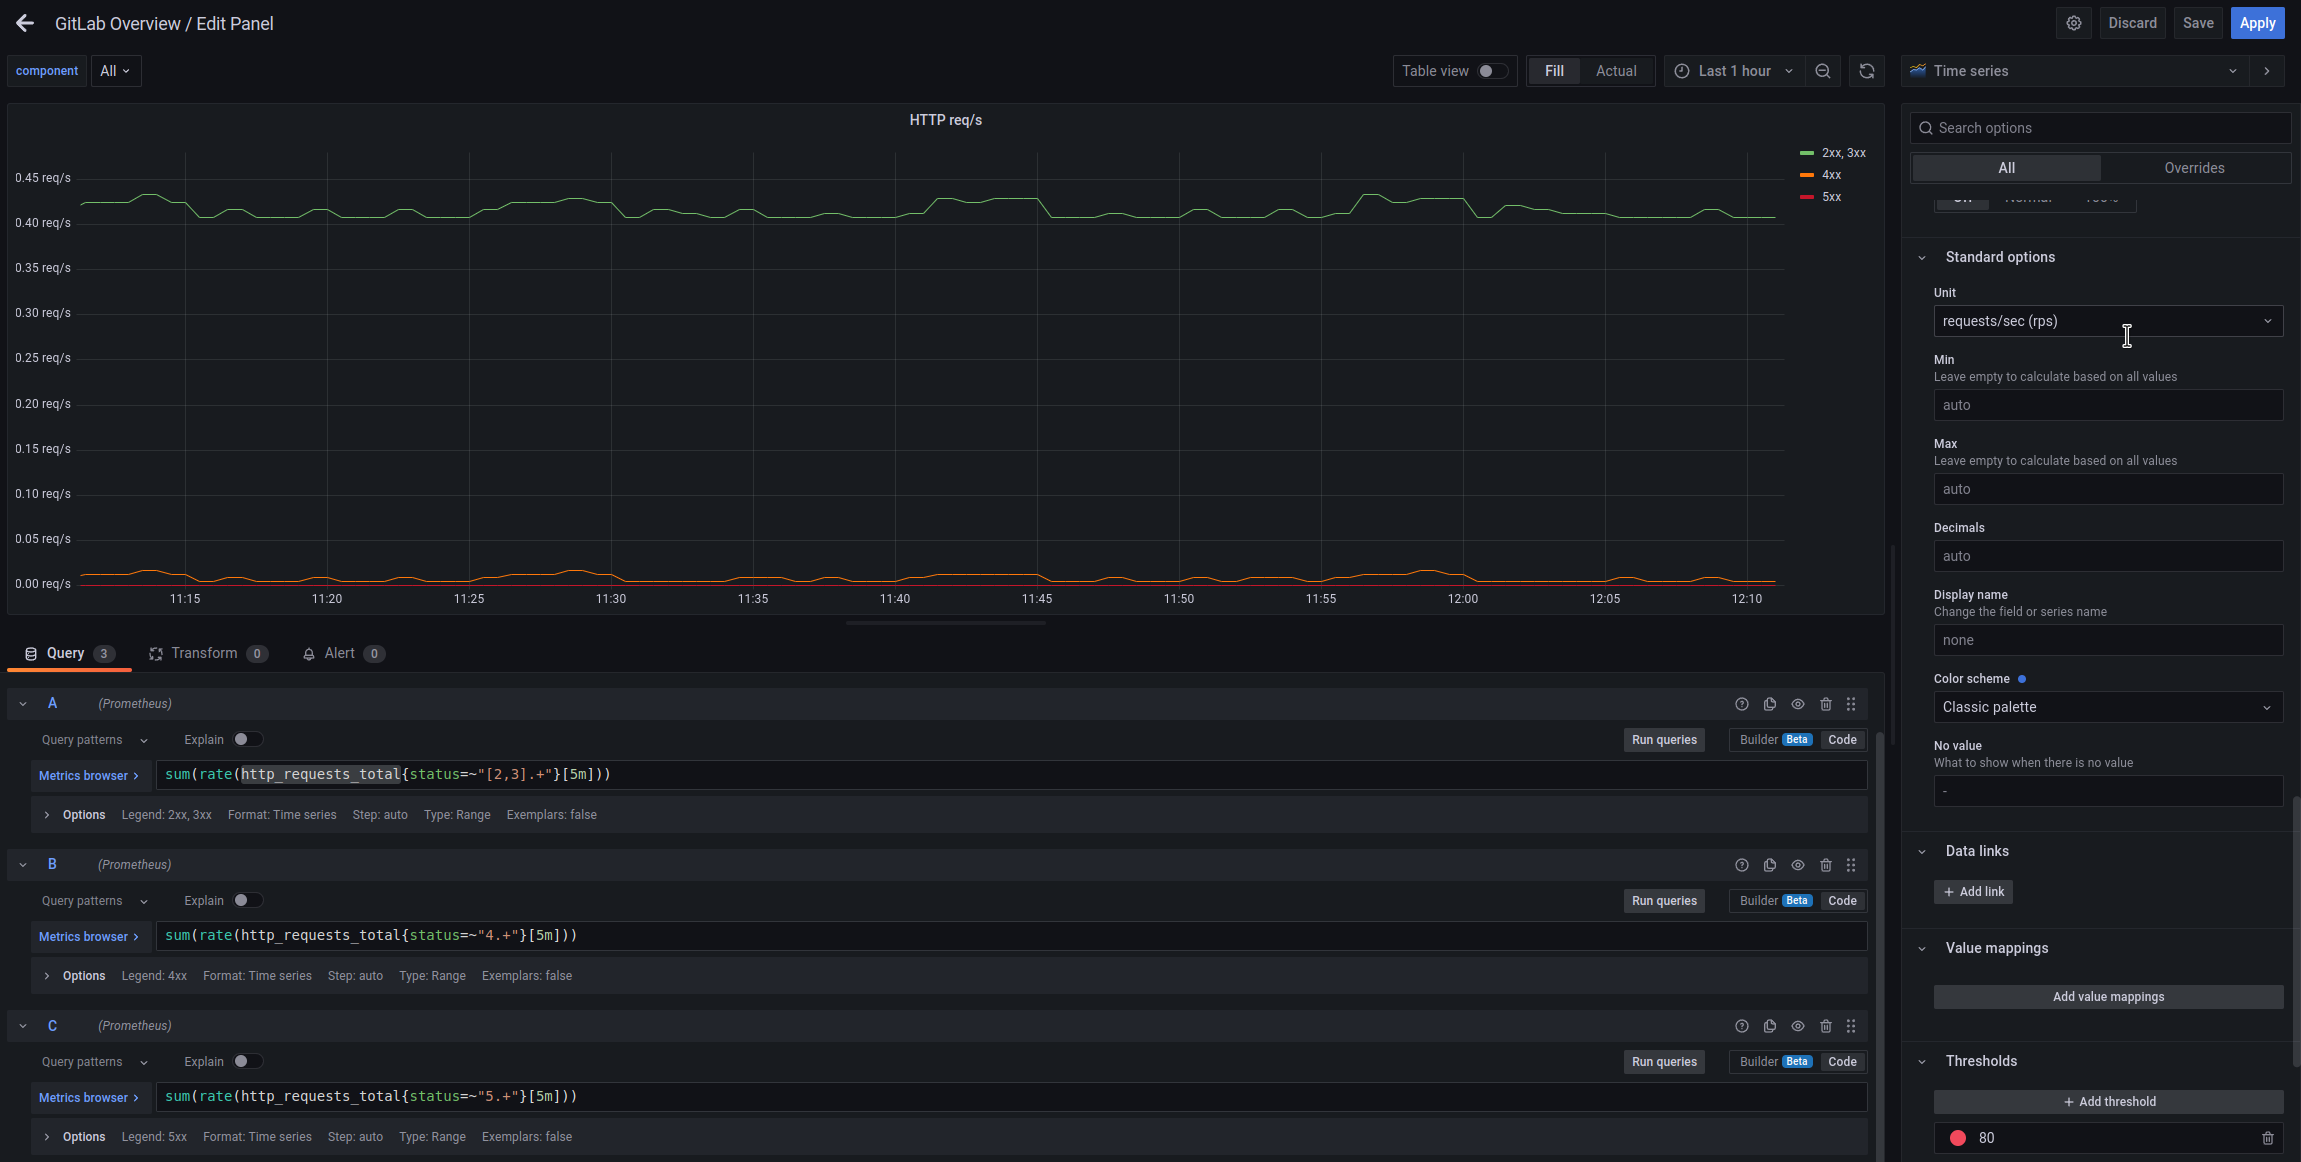
HTTP requests/second
Let’s use the metric http_requests_total:
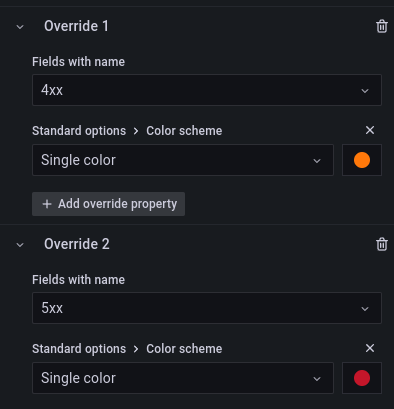
Let’s add an Override to change the color for 4хх and 5хх codes:
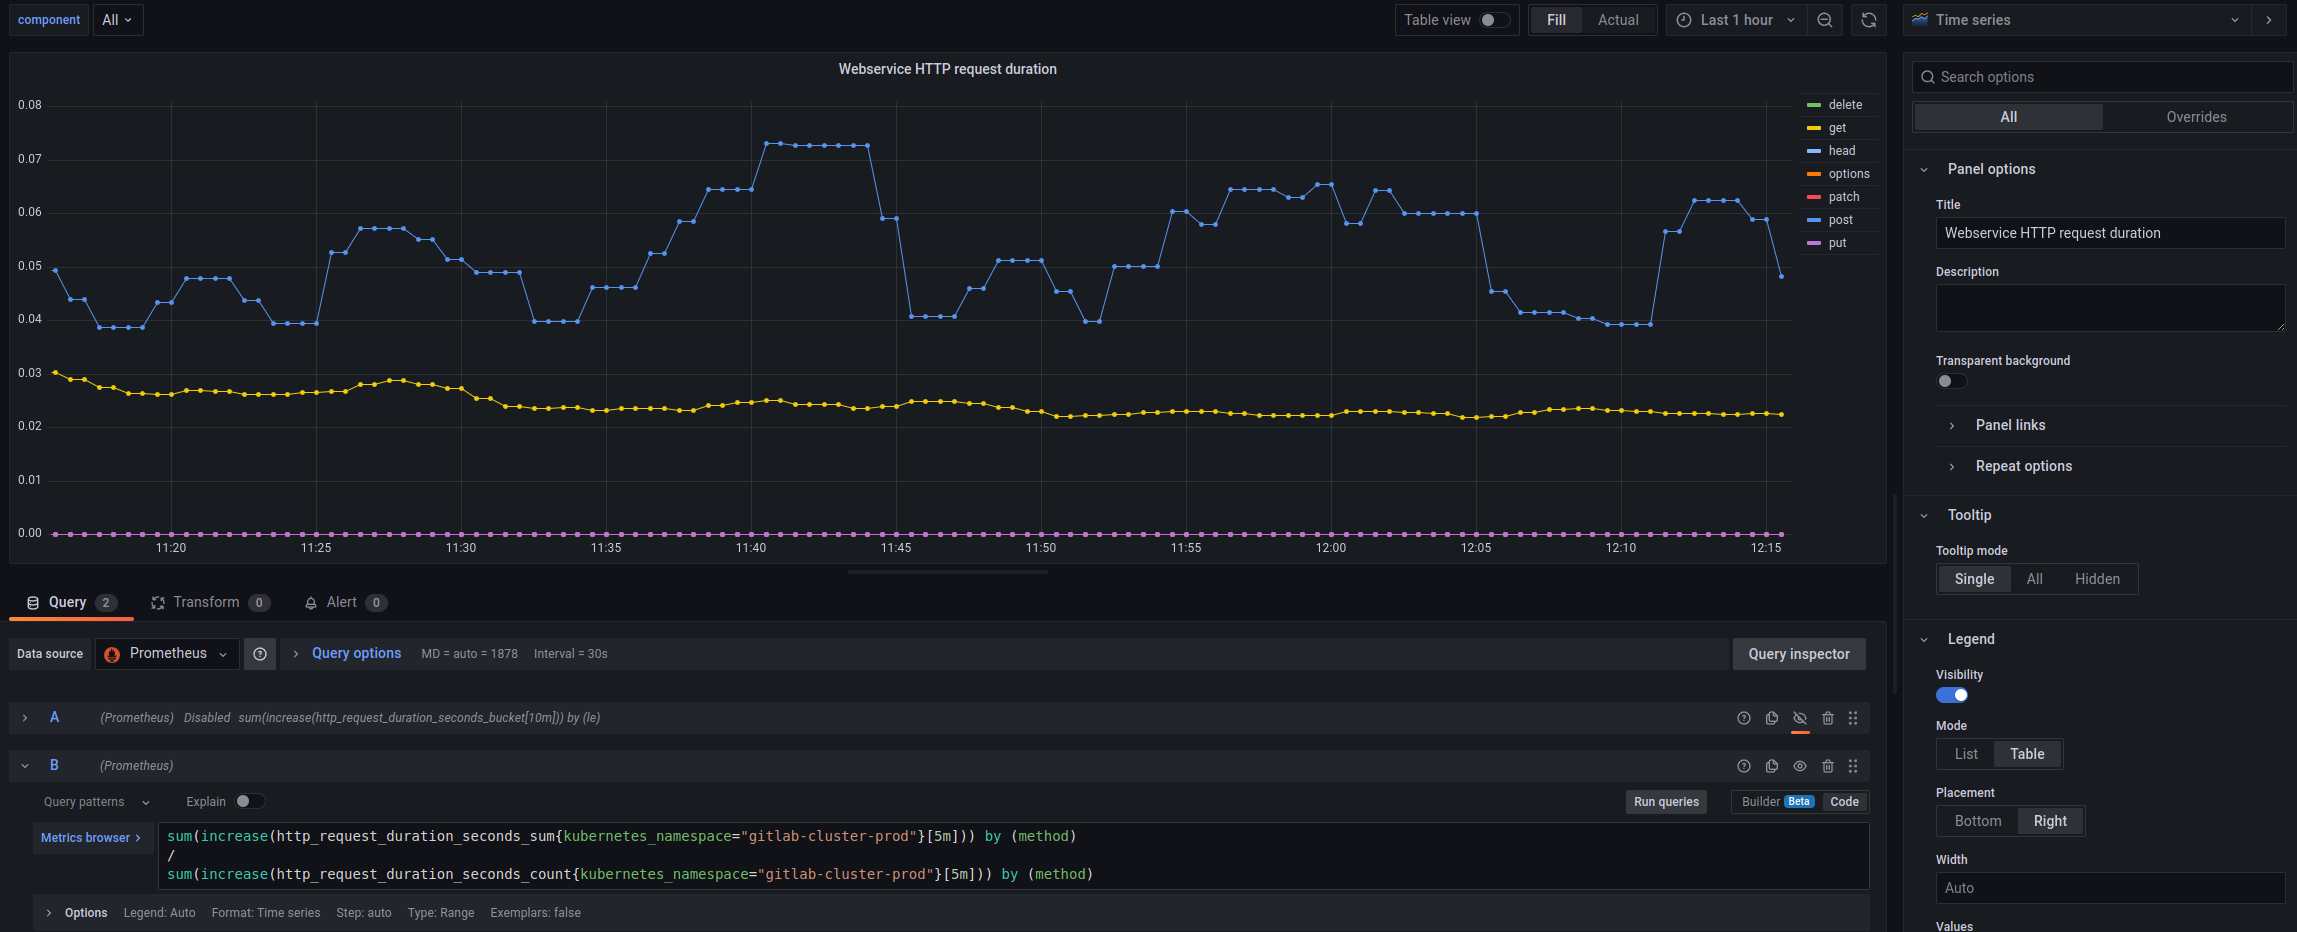
Webservice HTTP request duration
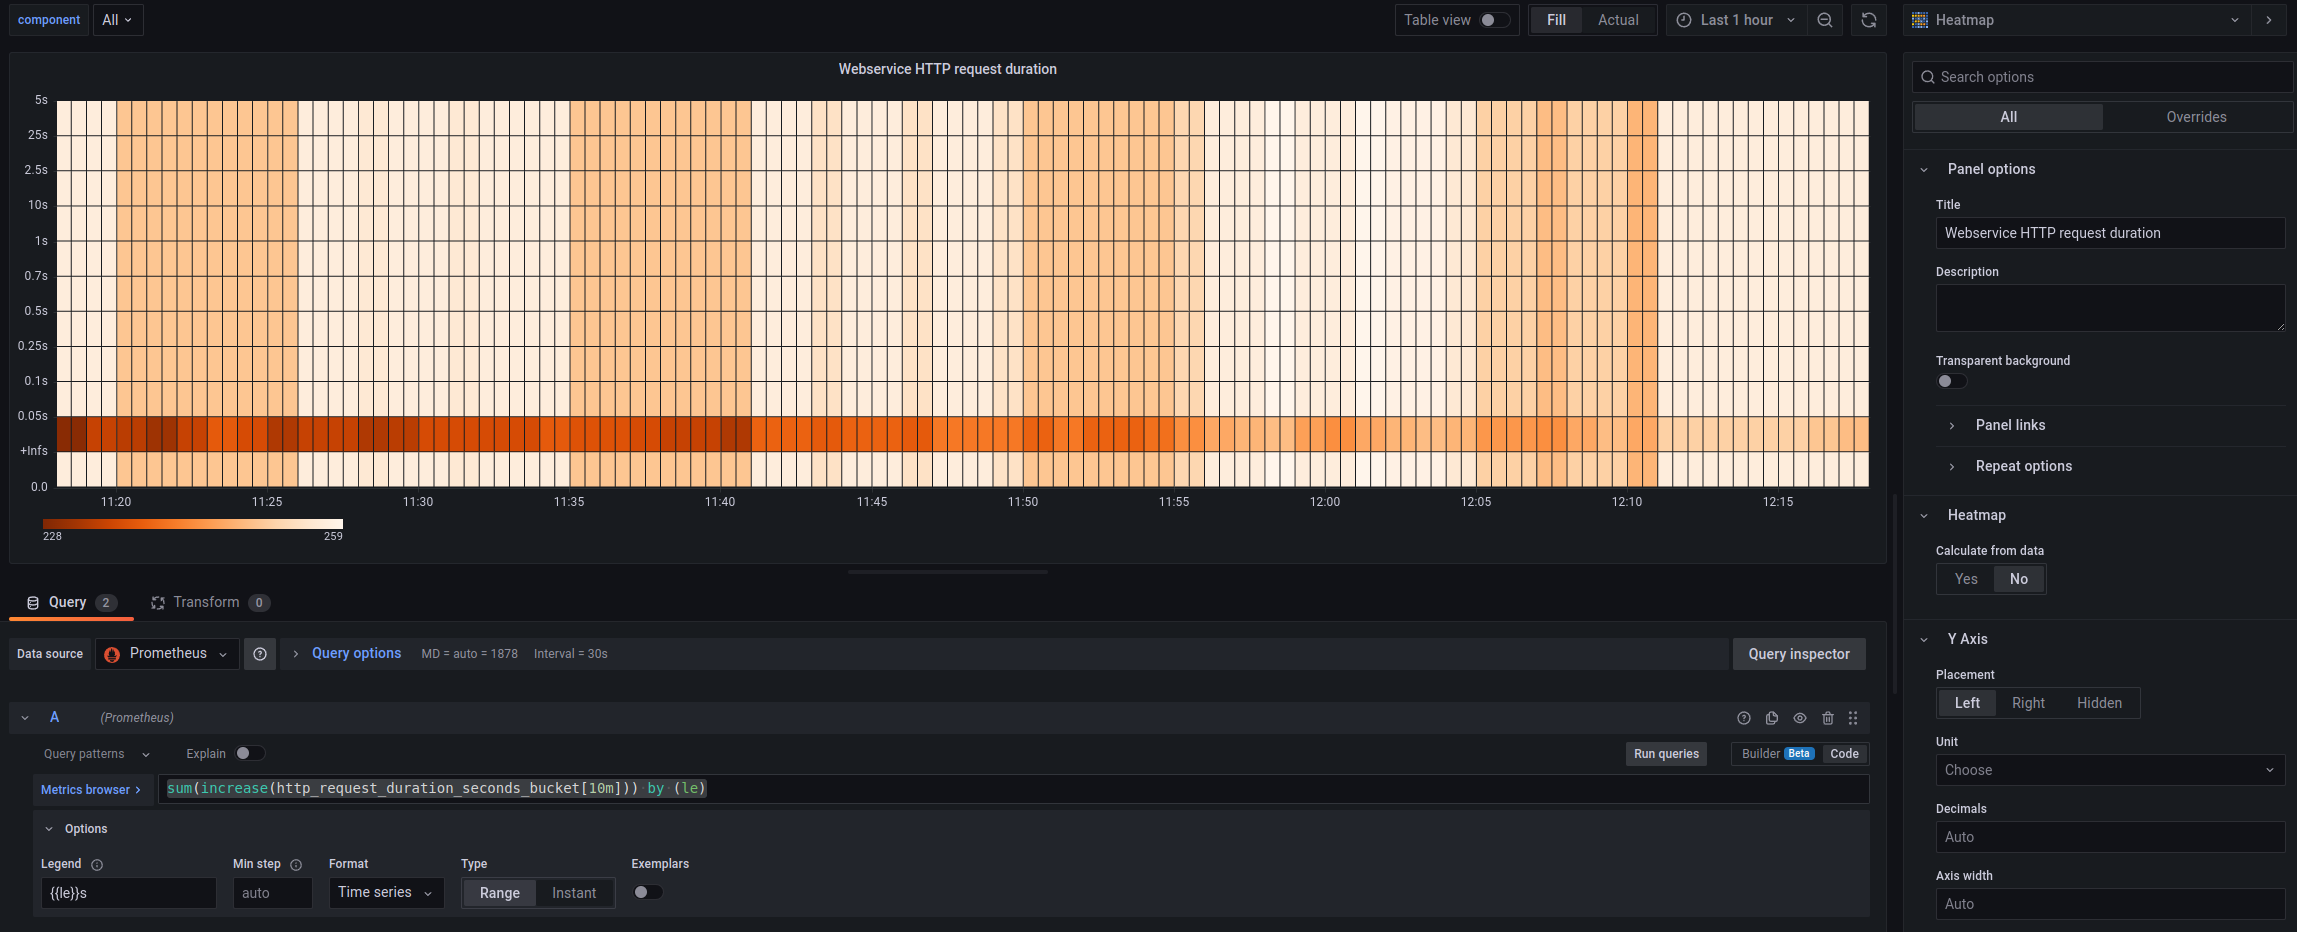
Here it’s possible to build a Heatmap by using the http_request_duration_seconds_bucket, but in my opinion, the usual graph by request types would be better:
sum(increase(http_request_duration_seconds_sum{kubernetes_namespace="gitlab-cluster-prod"}[5m])) by (method)
/
sum(increase(http_request_duration_seconds_count{kubernetes_namespace="gitlab-cluster-prod"}[5m])) by (method)
But you can also create a Heatmap:
sum(increase(http_request_duration_seconds_bucket[10m])) by (le)
In general, you can do quite a lot of interesting things with Histogram-type metrics, although I somehow did not use them.
See:
- Creating Grafana Dashboards for Node.js Apps on Kubernetes
- How to visualize Prometheus histograms in Grafana
- Introduction to histograms and heatmaps
GitLab services statistics
And finally, some information on the components of GitLab itself. In the process of work, I will definitely change something, because until it is used a lot, it is not very clear what exactly deserves attention.
But what comes to mind so far is Sidekiq and its jobs, Redis, PostgreSQL, and GitLab Runner.
Sidekiq Jobs Errors rate
The query:
sum(sidekiq_jobs_failed_total) / sum(sidekiq_jobs_processed_total) * 100
GitLab Runner Errors rate
The query:
sum(gitlab_runner_errors_total) / sum(gitlab_runner_api_request_statuses_total) * 100
GitLab Redis Errors rate
The query:
sum(gitlab_redis_client_exceptions_total) / sum(gitlab_redis_client_requests_total) * 100
Gitaly Supervisor errors rate
The query:
sum(gitaly_supervisor_health_checks_total{status="bad"}) / sum(gitaly_supervisor_health_checks_total{status="ok"}) * 100
Database transactions latency
The query:
sum(rate(gitlab_database_transaction_seconds_sum[5m])) by (kubernetes_pod_name) / sum(rate(gitlab_database_transaction_seconds_count[5m])) by (kubernetes_pod_name)
User Sessions
The query:
sum(user_session_logins_total)
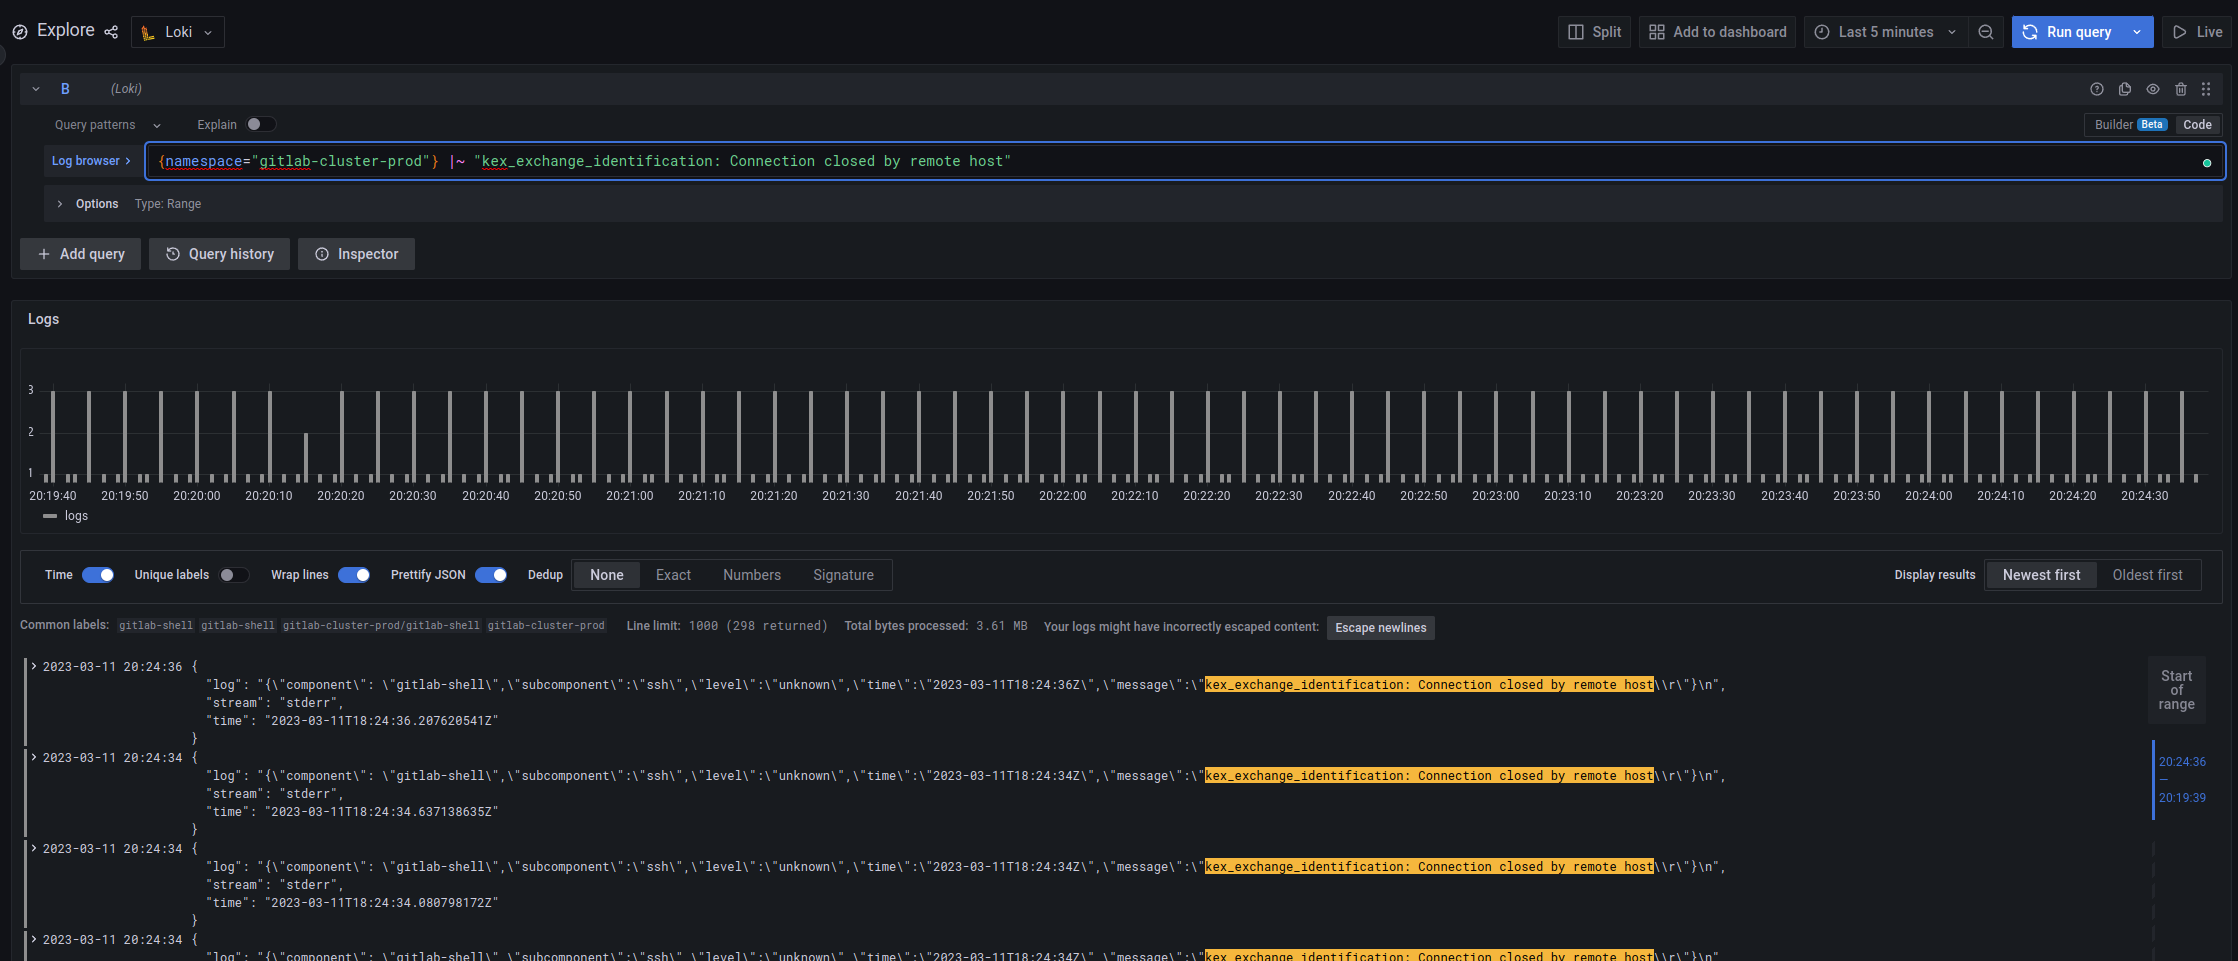
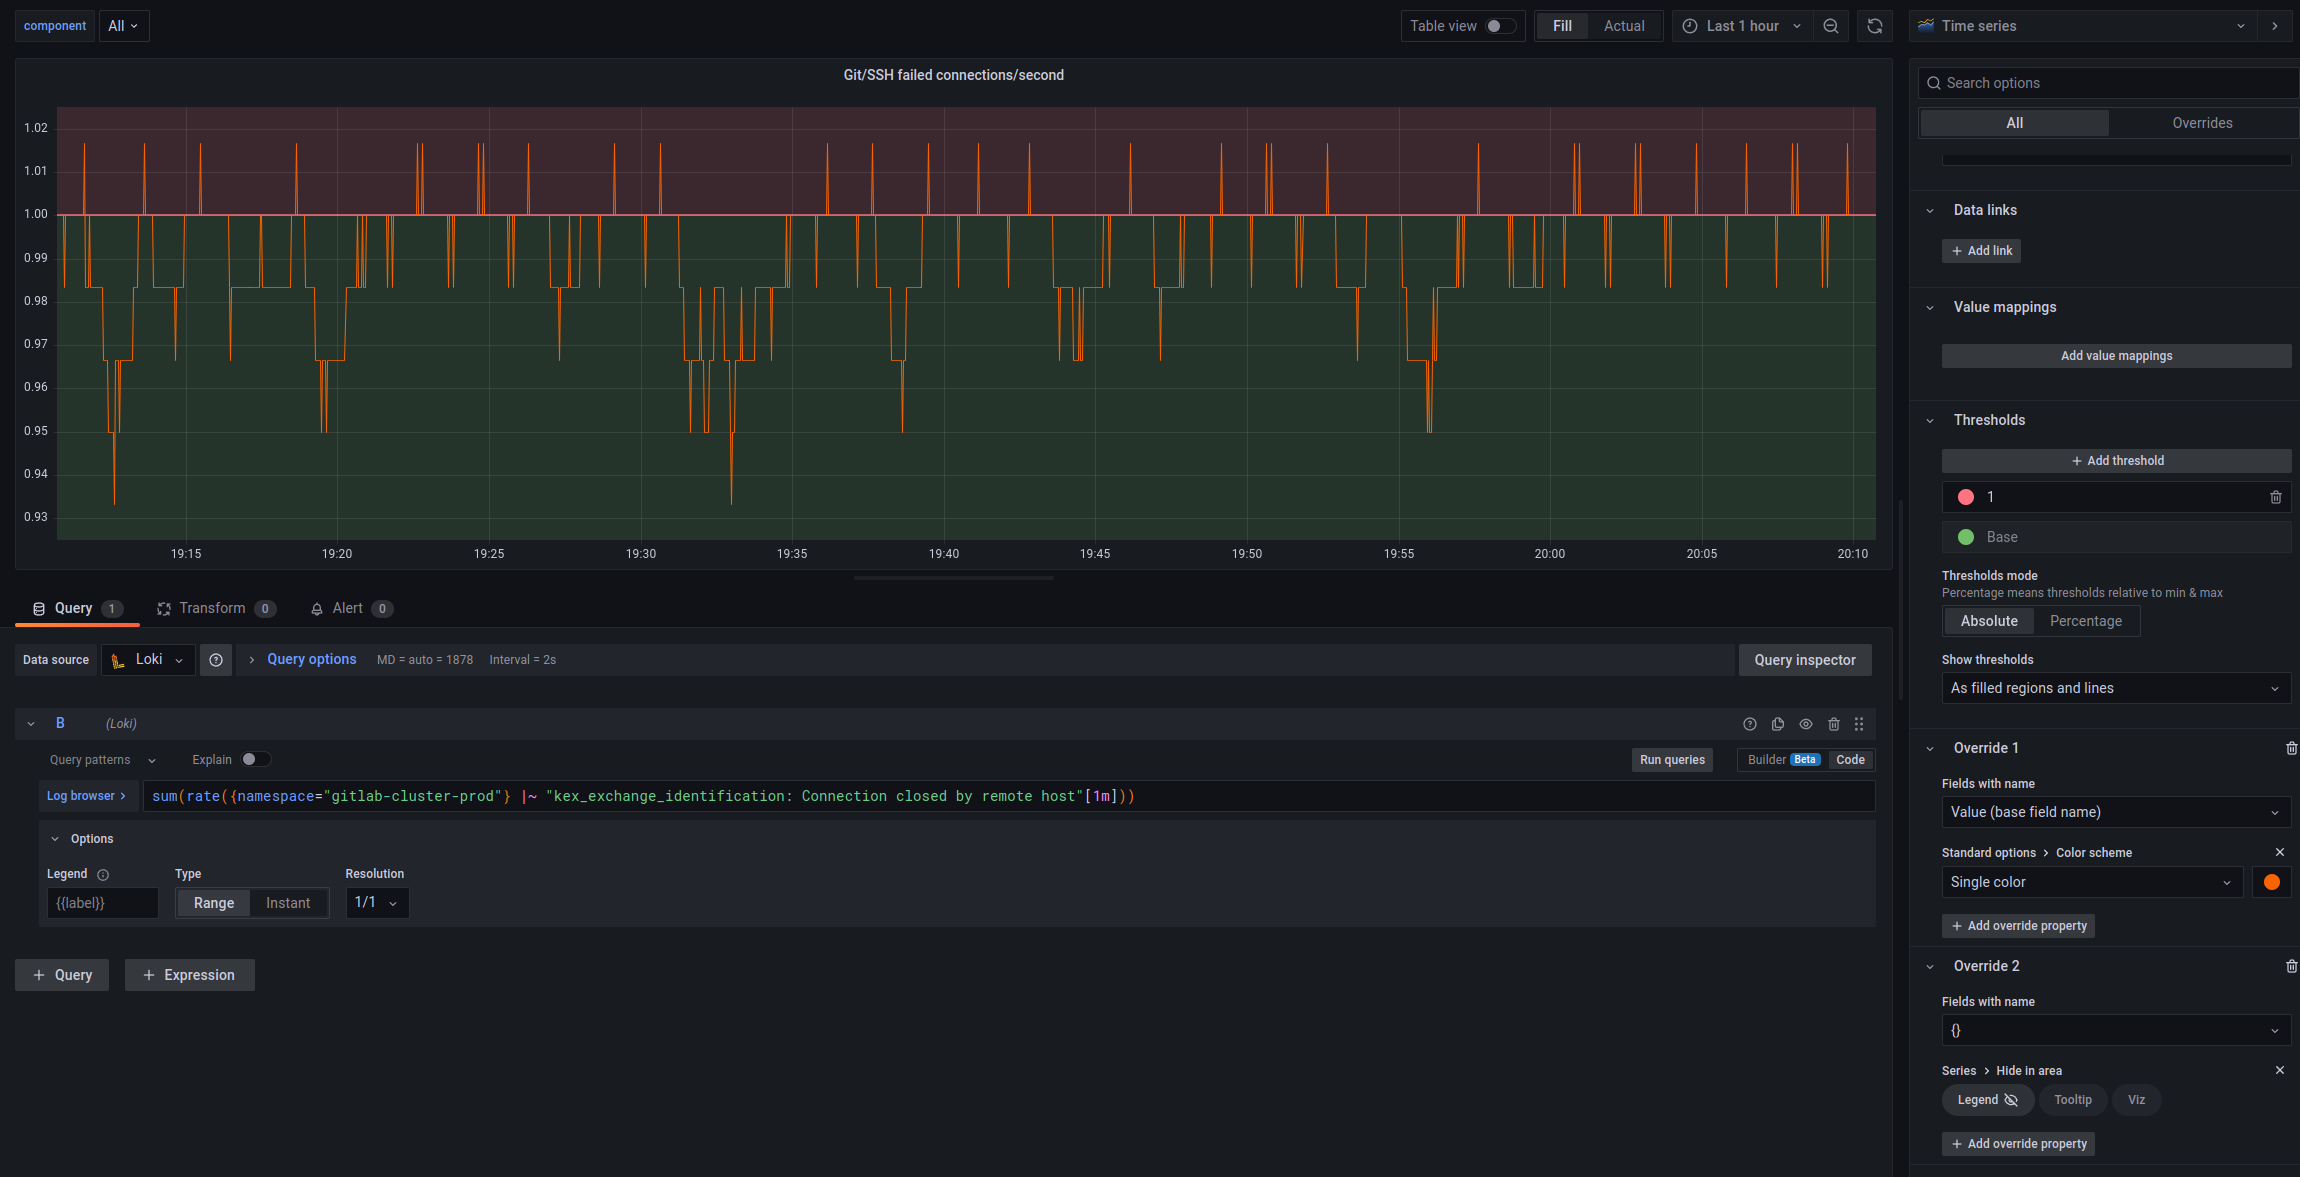
Git/SSH failed connections/second – by Grafana Loki
And here we will use the values obtained from Loki – the error rate of the “kex_exchange_identification: Connection closed by remote host” string from the logs, in Loki it looks like this:
See Grafana Loki: LogQL for logs and creating metrics for alerts.
In the panel, specify the Data source = Loki, and use sum() and rate() to obtain values:
Configure Thresholds and Overrides, and we have the following graph:
And in general, the whole dashboard now looks like this:
Will see how it will be further, what will be useful, and what will be removed, and what can be added.
Well, and add alerts.
![]()
