Good – we learned how to launch Loki – Grafana Loki: architecture and running in Kubernetes with AWS S3 storage and bolted-shipper, we also figured out how to configure alerts – Grafana Loki: alerts from the Loki Ruler and labels from logs.
Now it’s time to figure out what we can do in Loki using its LogQL.
Contents
Preparation
For examples, we will use two pods – one with nginxdemo/hello for normal nginx logs, and the other with thorstenhans/fake-logger, which will write logs in JSON.
For Nginx, add a Kubernetes Service to be able to send requests from curl:
apiVersion: v1
kind: Pod
metadata:
  name: nginxdemo
  labels:
    app: nginxdemo
    logging: test
spec:
  containers:
  - name: nginxdemo
    image: nginxdemos/hello
    ports:
      - containerPort: 80
        name: nginxdemo-svc
---
apiVersion: v1
kind: Service
metadata:
  name: nginxdemo-service
  labels:
    app: nginxdemo
    logging: test
spec:
  selector:
    app: nginxdemo
  ports:
  - name: nginxdemo-svc-port
    protocol: TCP
    port: 80
    targetPort: nginxdemo-svc
---
apiVersion: v1
kind: Pod
metadata:
  name: fake-logger
  labels:
    app: fake-logger
    logging: test
spec:
  containers:
  - name: fake-logger
    image: thorstenhans/fake-logger:0.0.2
Deploy and forward the port:
[simterm]
$ kk port-forward svc/nginxdemo-service 8080:80
[/simterm]
And let’s run curl with a regular GET in a loop:
[simterm]
$ watch -n 1 curl localhost:8080 2&>1 /dev/null &
[/simterm]
And another one, with POST:
[simterm]
$ watch -n 1 curl -X POST localhost:8080 2&>1 /dev/null
[/simterm]
Let’s go.
Grafana Explore: Loki – interface
A few words about the Grafana Explore > Loki interface itself.
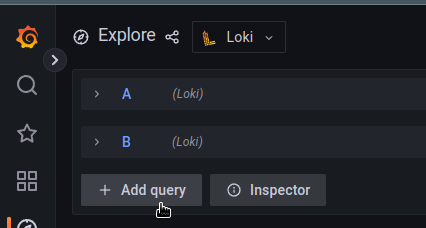
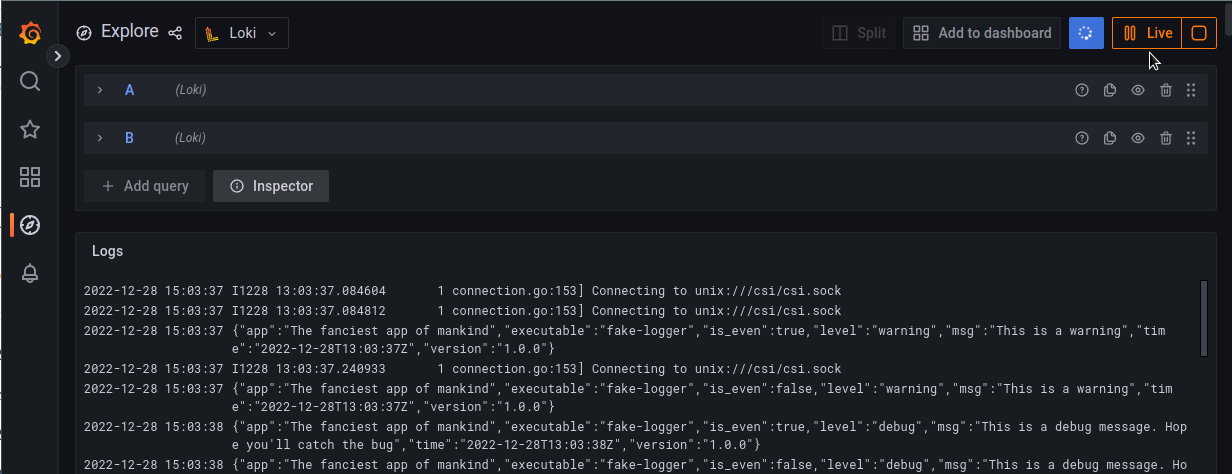
You can use multiple queries at the same time:
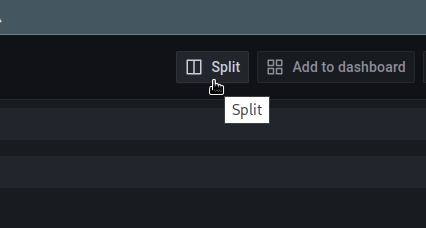
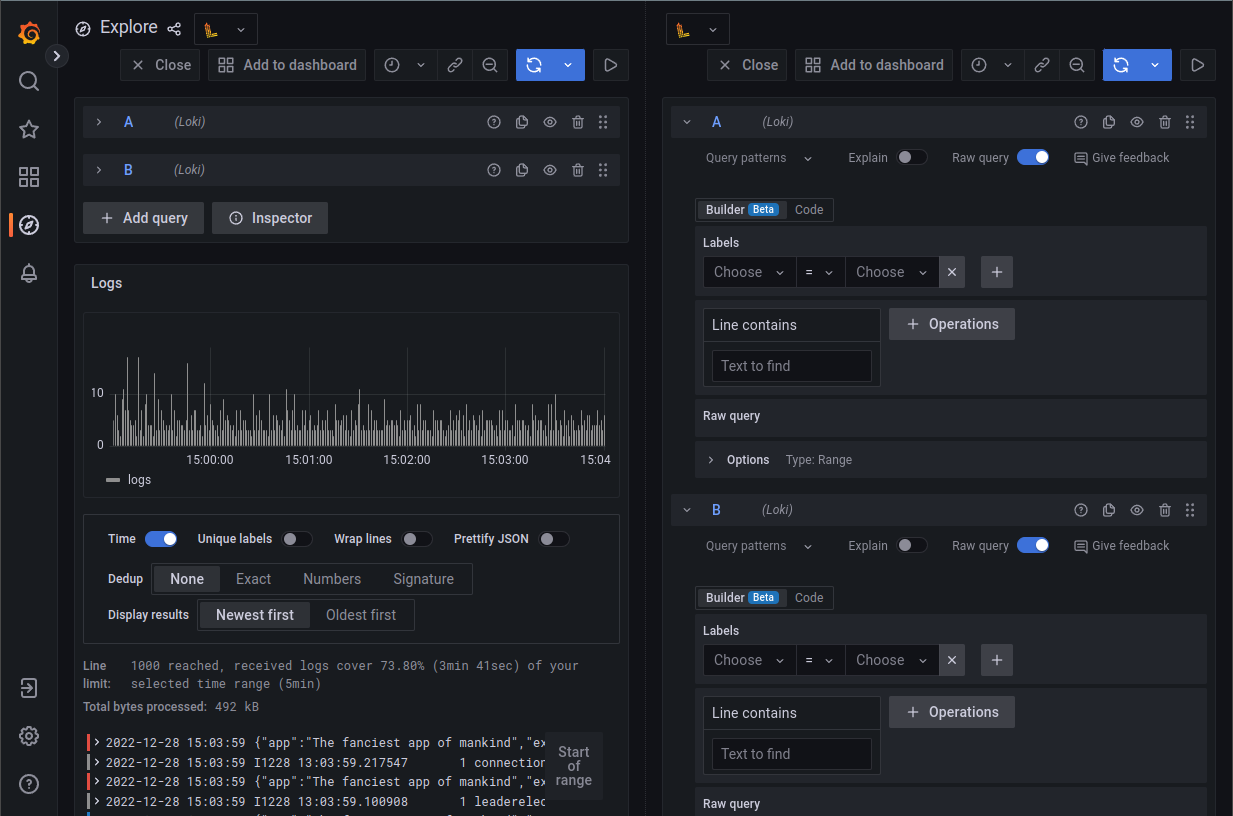
Also, it is possible to divide the interface into two parts, and perform separate queries in each:
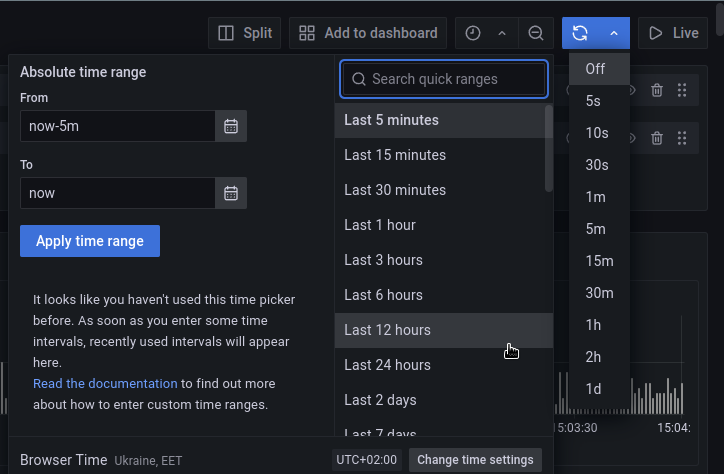
As in the usual Grafana dashboards, it is possible to select the period for which you want to receive data and set the interval for auto-updating:
Or you can turn on the Live mode – then the data will appear as soon as it reaches Loki:
There are two modes for creating requests – Builder and Code.
In the Builder mode, Loki displays a list of available label and filters:
In the Code mode, they will be substituted automatically as you type:
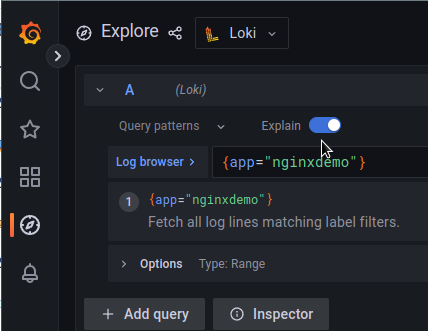
The Explain function will explain exactly what your request does:
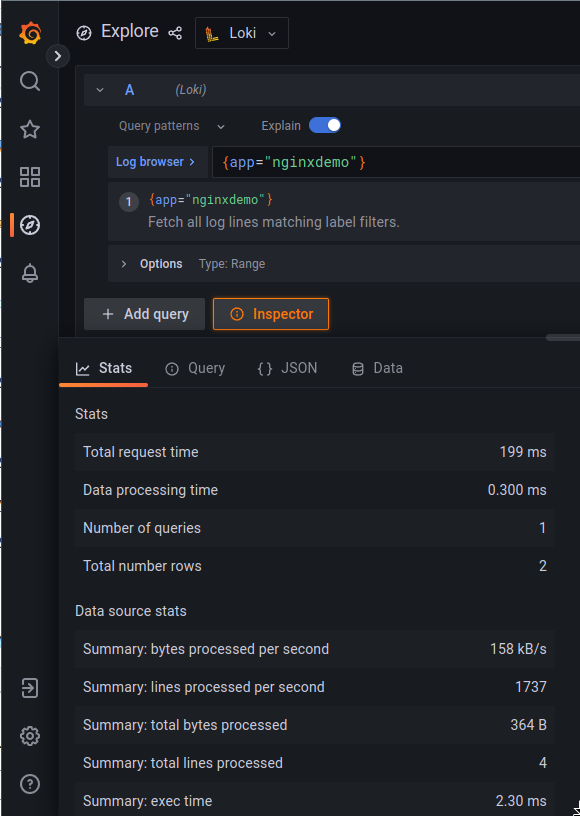
And the Inspector will display details about your request – how much time and resources were used to form the answer, useful for optimizing requests:
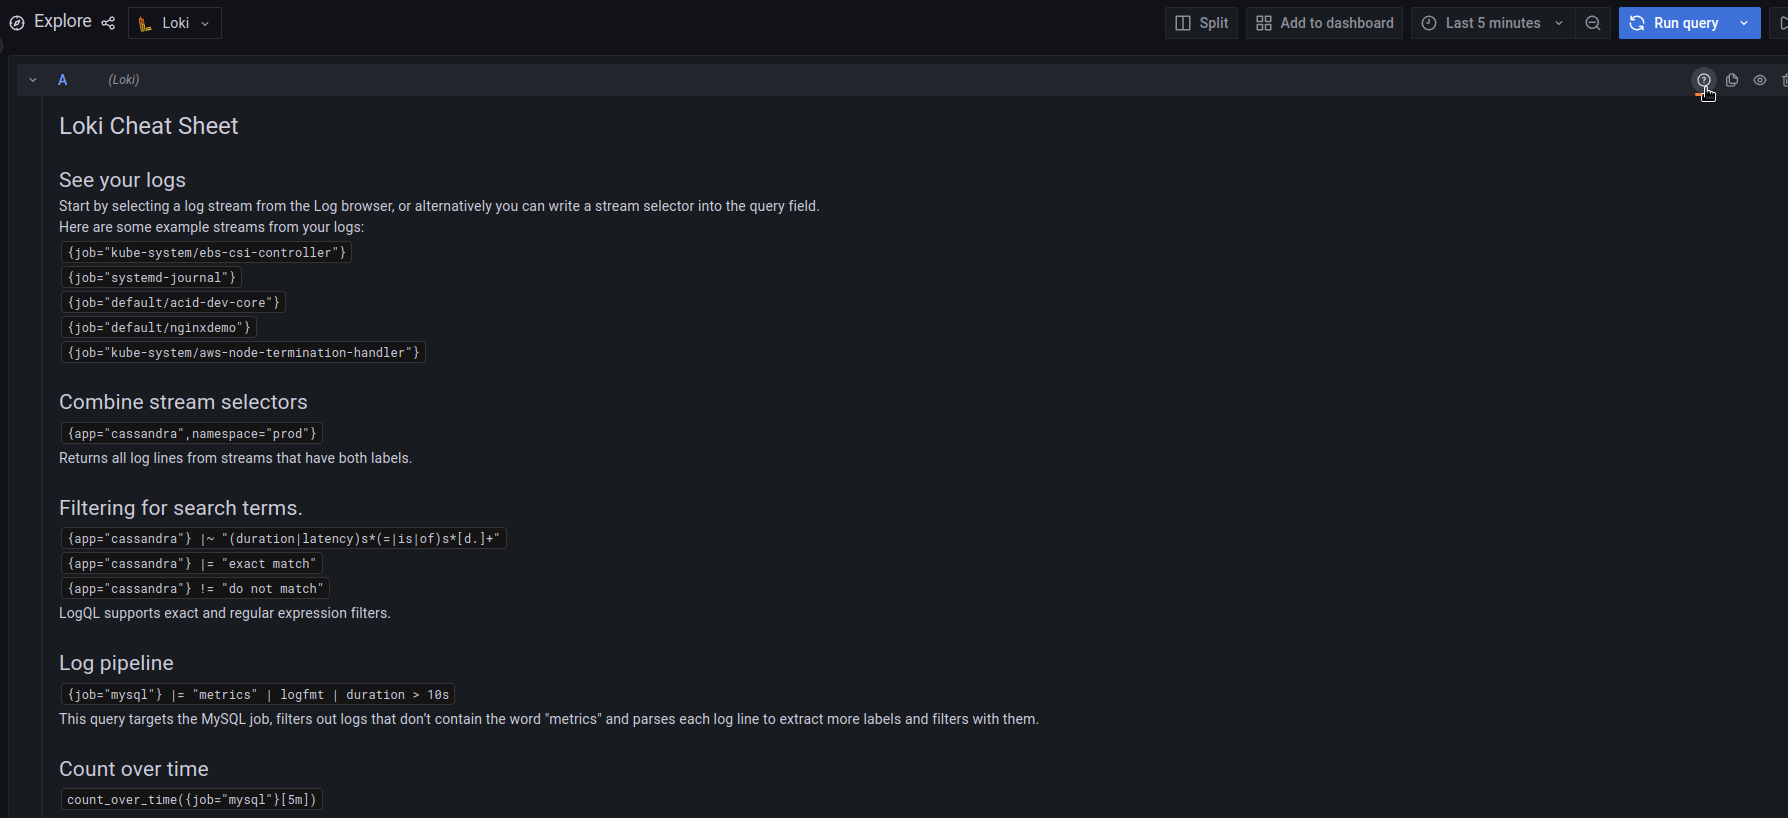
Also, you can open the Loki Cheat Sheet by clicking (?)to the right of the query box:
LogQL: overview
In general, working with Loki and its LogQL is almost similar to working with Prometheus and its PromQL – almost all the same functions and general approach, this is even reflected in the description of Loki: ” Like Prometheus, but for logs”.
So, the main selection is based on indexed labels, with the help of which we make a basic search in the logs – we select a stream.
Types of requests in Loki depend on the final result:
- Log queries: form strings from log files
- Metric queries: includes Log queries, but as a result form numerical values that can be used to generate graphs in Grafana or for alerts in Ruler
In general, any query consists of three main parts:
{Log Stream Selectors} <Log Pipeline "Log filter">
That is, in the query:
{app="nginxdemo"} |= "172.17.0.1"
The {app="nginxdemo"} is the Log Stream Selector, in which we select a specific stream from Loki, the |= is the beginning of the Log Pipeline which includes a Log Filter Expression – "172.17.0.1".
In addition to the Log filter, the pipeline can include a Log or Tag formatting expression that changes the data received in the pipeline.
The Log Stream Selector is required, while the Log Pipeline with its expressions is optional, and is used to refine or format the results.
Log queries
Log Stream Selectors
Labels are used for selectors, which are specified by the agent that collects logs – promtail, fluentd or by others.
The Log Stream Selector determines how many indexes and blocks of data will be loaded to return the result, that is, it directly affects the speed of operation and CPU/RAM resources used to generate the response.
In the example above, in the selector {app="nginxdemo"} we use the operator ” =“, which can be:
=: is equal to!=: is not equal to=~: regex!~: negative regex
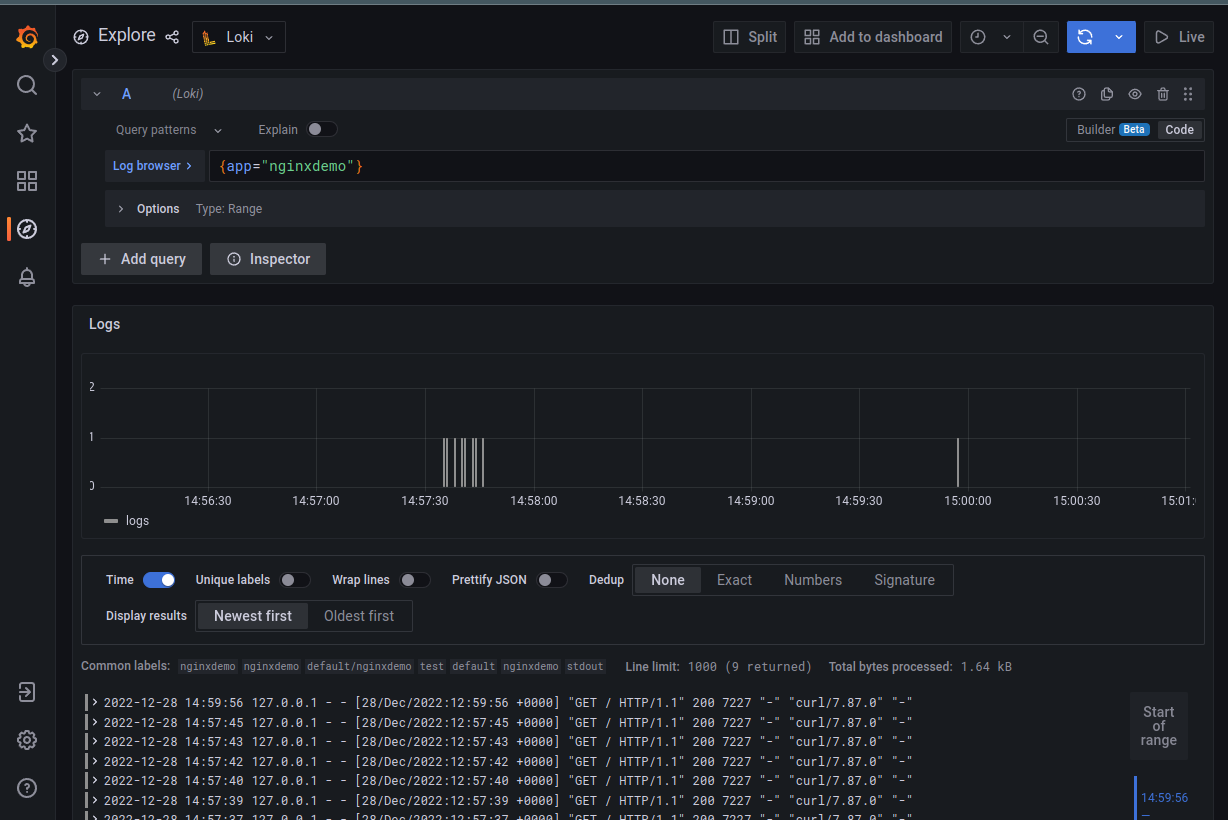
So, with the {app="nginxdemo"} query we will receive the logs of all pods that have a tag app with the value nginxdemo:
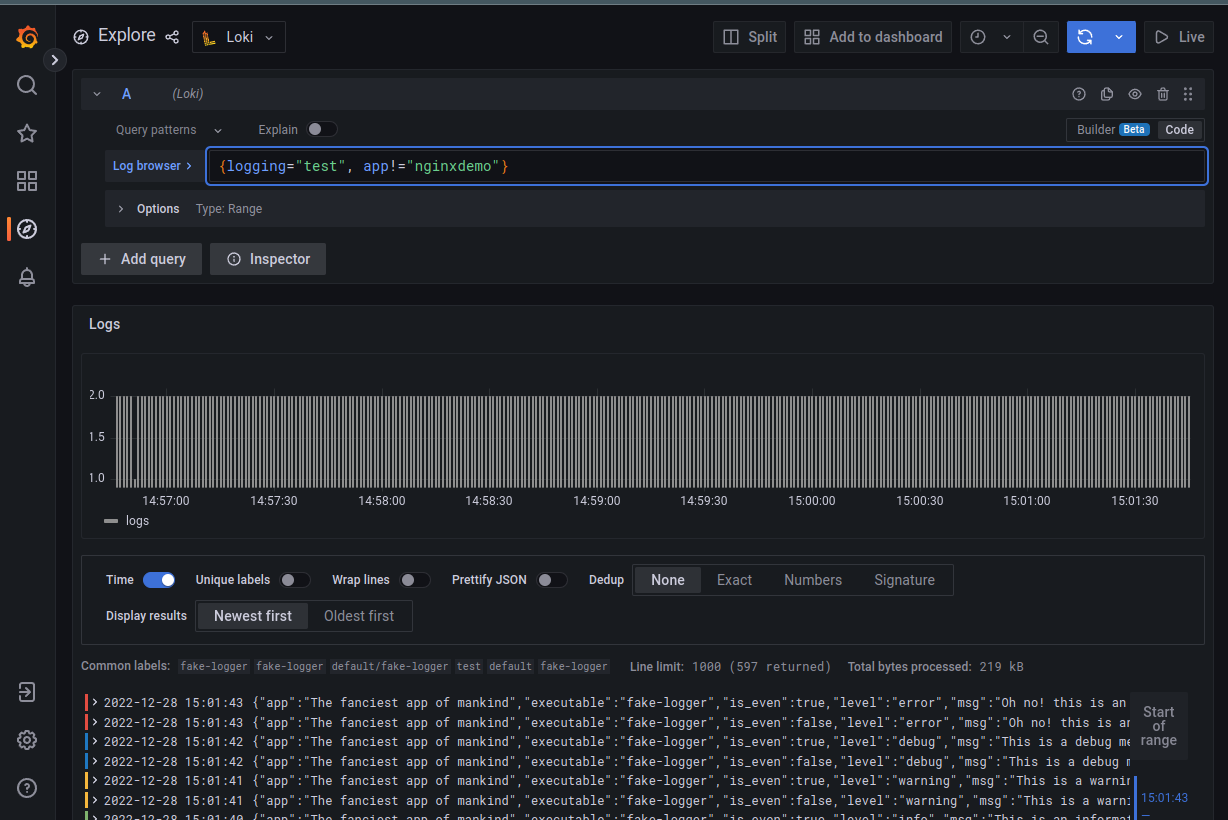
We can combine several selectors, for example, get all logs with the logging=test but without app=nginxdemo:
{logging="test", app!="nginxdemo"}
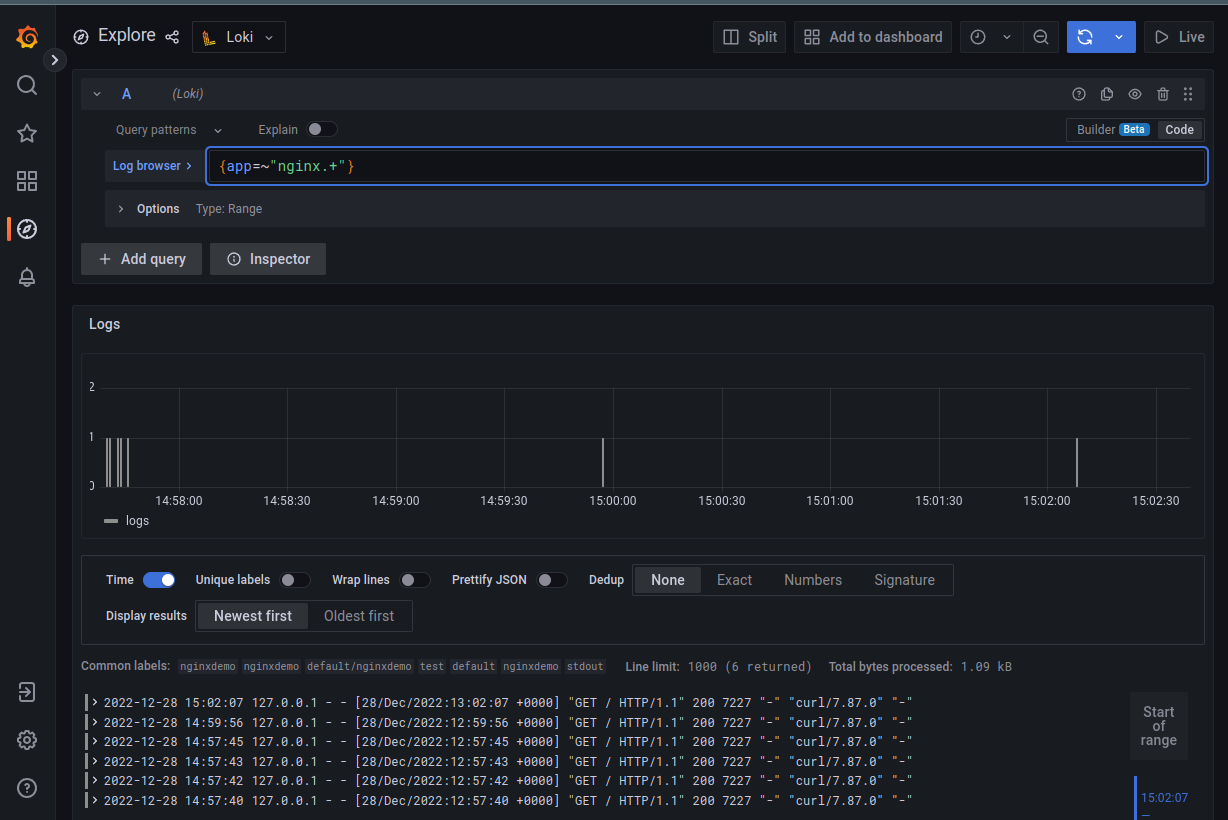
Or use regex:
{app=~"nginx.+"}
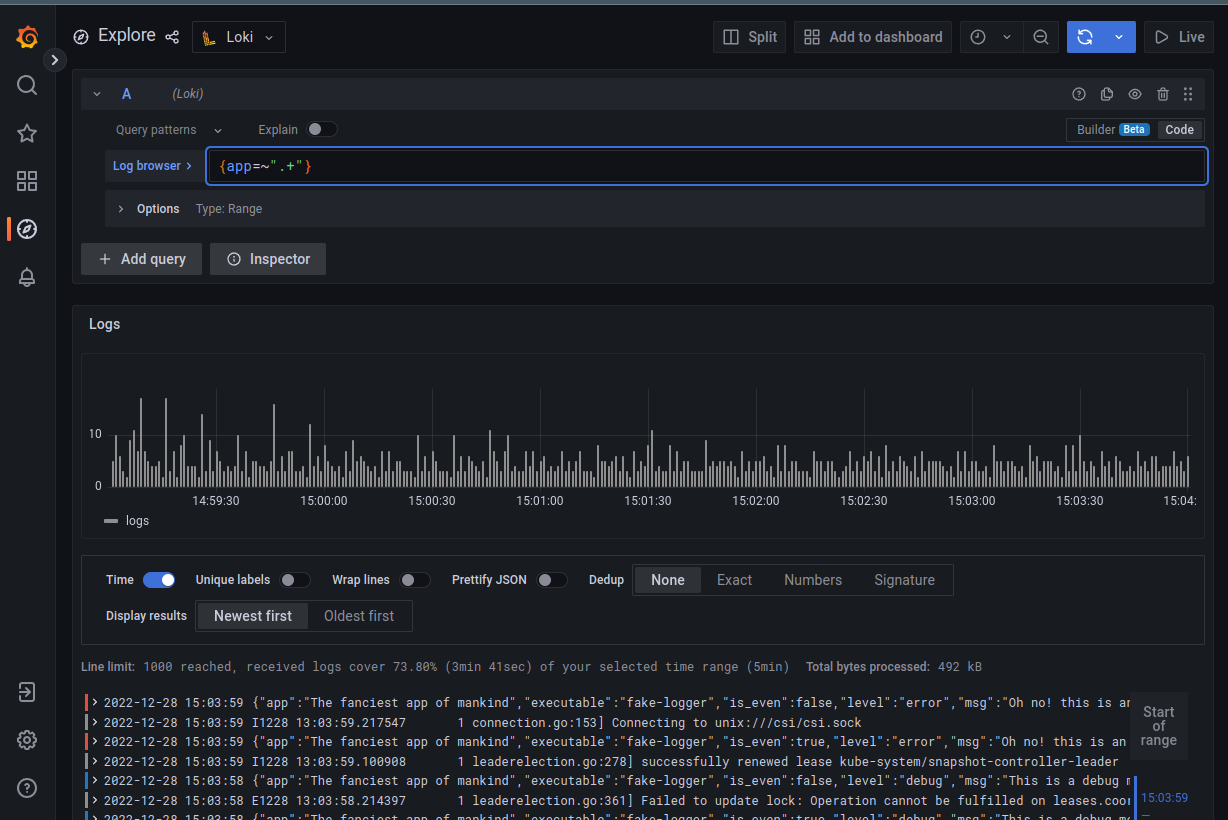
Or simply select all logs (streams) that have the app label:
Log Pipeline
Data received from the stream can be passed to the pipeline for further filtering or formatting. At the same time, the result of one pipeline can be transferred to the next, and so on.
A pipeline can include:
- Log line filtering expressions – for filtering previous results
- Parser expressions – for obtaining tags from logs that can be passed to Tag filtering
- Tag filtering expressions – for filtering data by tags
- Log line formatting expressions – used to edit the received results
- Tag formatting expressions – tag/label editing
Log Line filtering
Filters are used to… filter 🙂
That is, when we received data from the stream and want to select individual dates from it, we use the log filter.
The filter consists of an operator and a term query, which is used to select data.
Operators can be:
|=: the string contains a string query! =: the string does NOT contain a string query|~: string equals a regular expression! ~: string is NOT equal to a regular expression
When using regex, keep in mind that Golang RE2 syntax is used, and it is case-sensitive by default. To switch it to case-independent mode, add (i?).
In addition, it is better to use Log Line filtering at the beginning of the request, because they work quickly, and will save the following pipelines from unnecessary work.
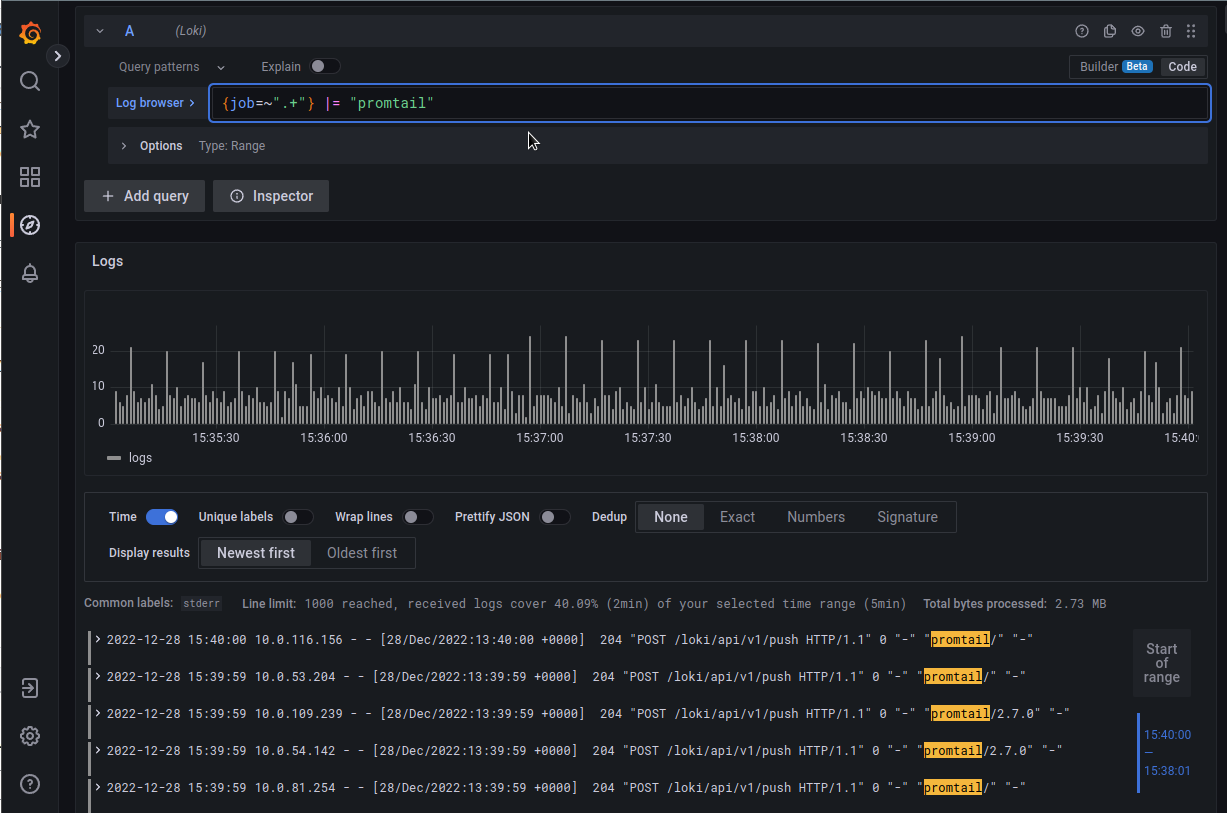
An example of a log filter can be sampling by a string:
{job=~".+"} |= "promtail"
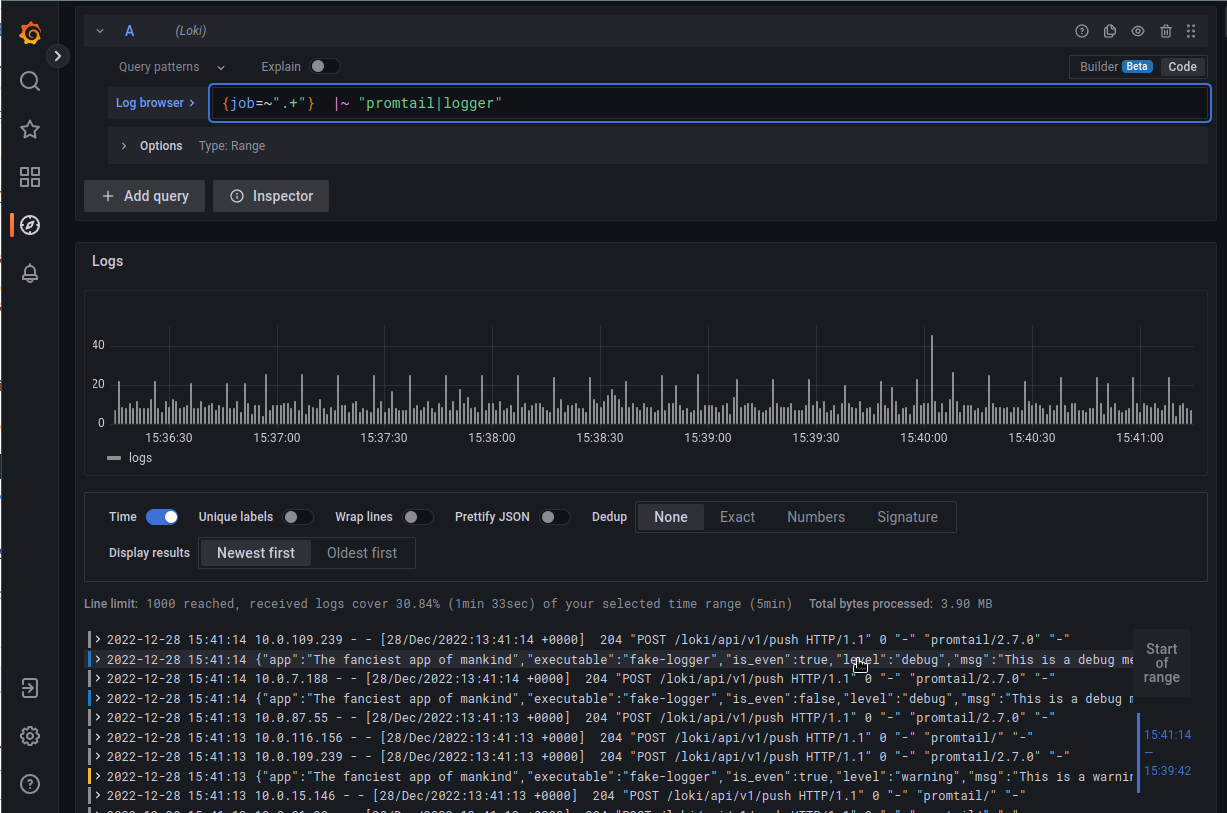
Or multiple expressions using a regular expression:
Parser expressions
Parsers… parse) input data and labels are obtained from them, which can then be used in further filters or to form Metric queries.
Currently, LogQL supports json, logfmt, pattern, regexpand unpackfor working with tags.
json
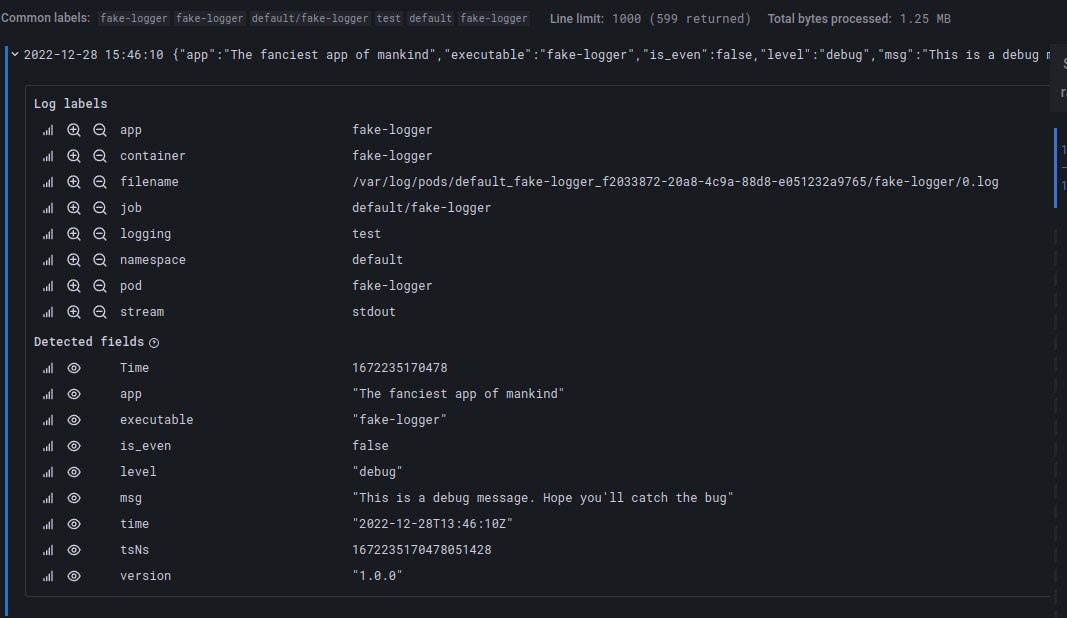
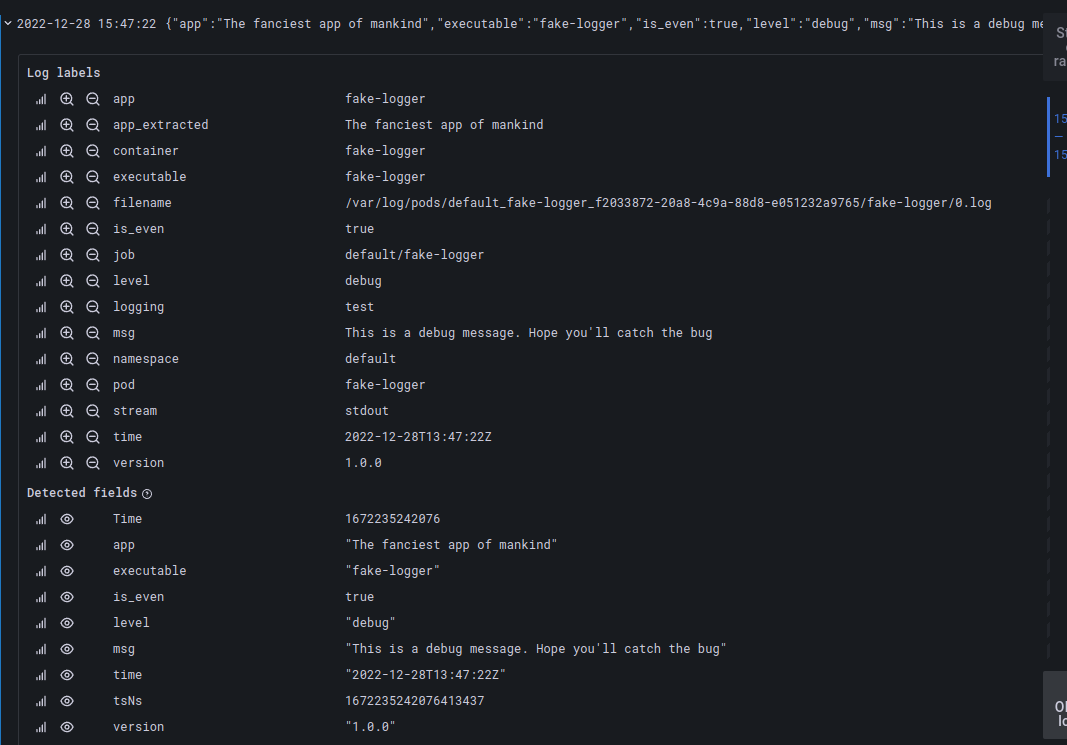
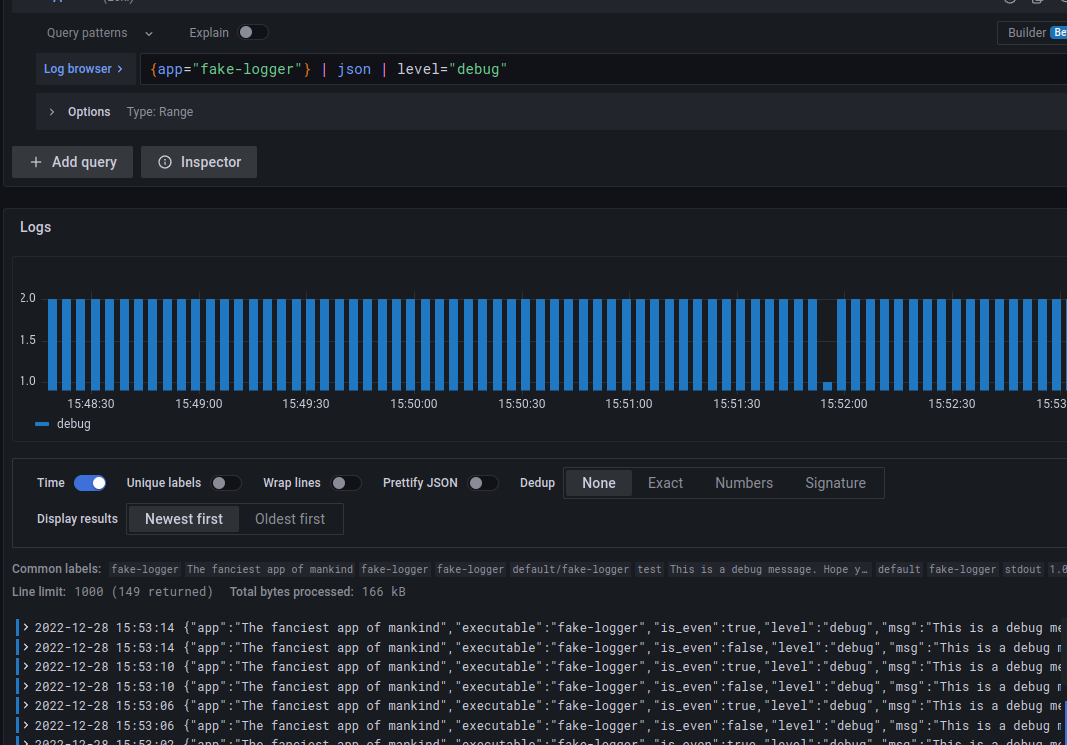
For example, json forms all JSON keys into labels, i.e. request {app="fake-logger"} | json instead of:
Creates a new set of tags:
The received through json tags can be further used for additional filters, for example – select only terms from level=debug:
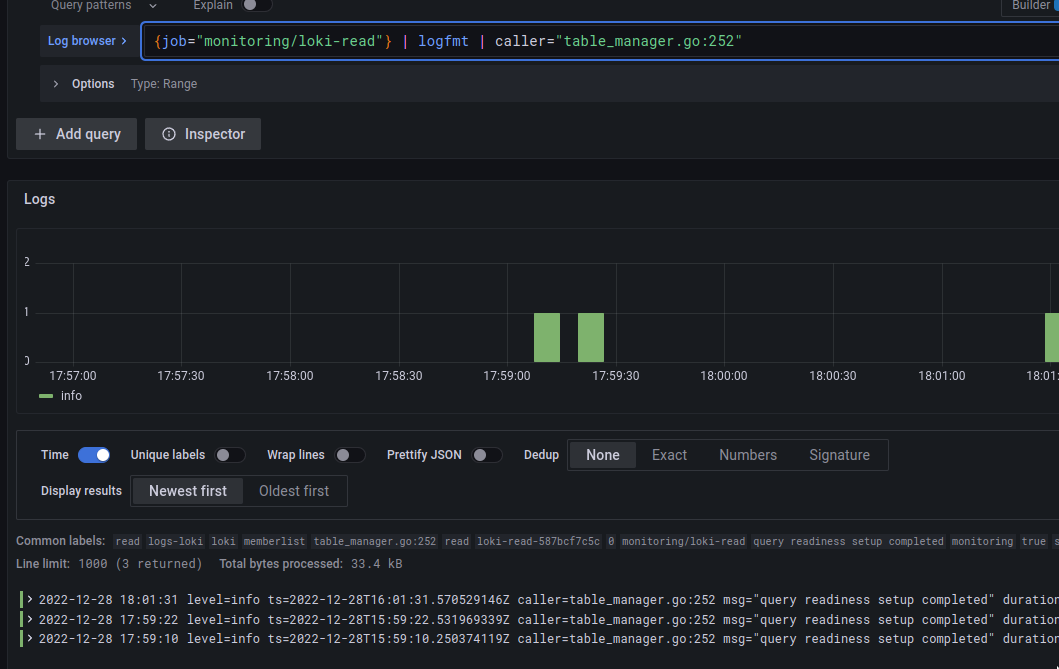
logfmt
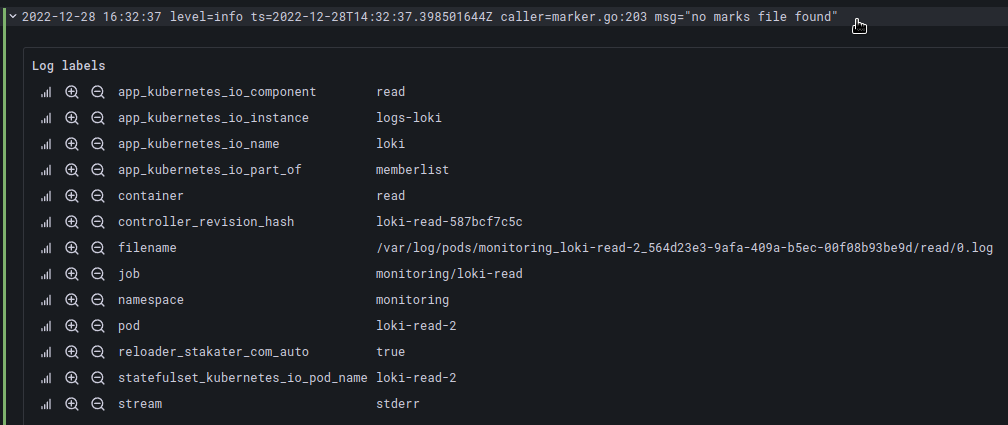
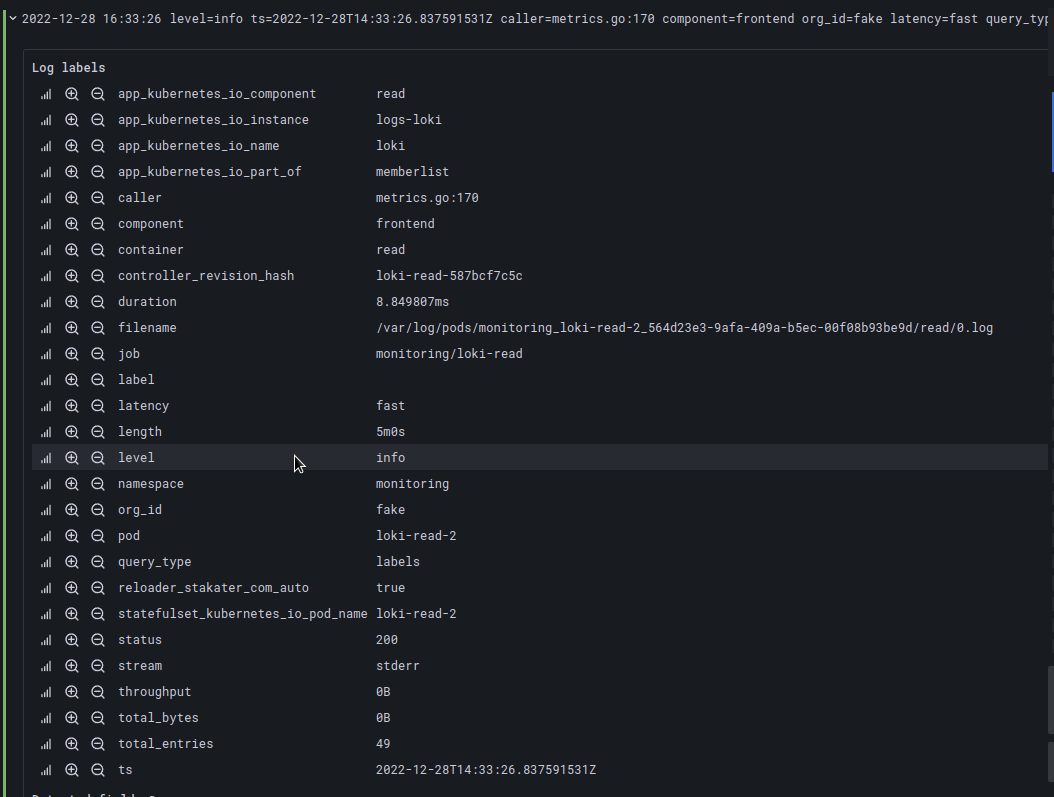
To generate tags from logs not in JSON format, you can use logfmt, which will convert all found fields into labels.
For example, job="monitoring/loki-read" has fields key=value:
level=info ts=2022-12-28T14:31:11.645759285Z caller=metrics.go:170 component=frontend org_id=fake latency=fast
With the help of logfmt will be converted into labels:
regexp
The regex parser takes an argument specifying the regex group that will generate the tag from the query.
For example, from the string:
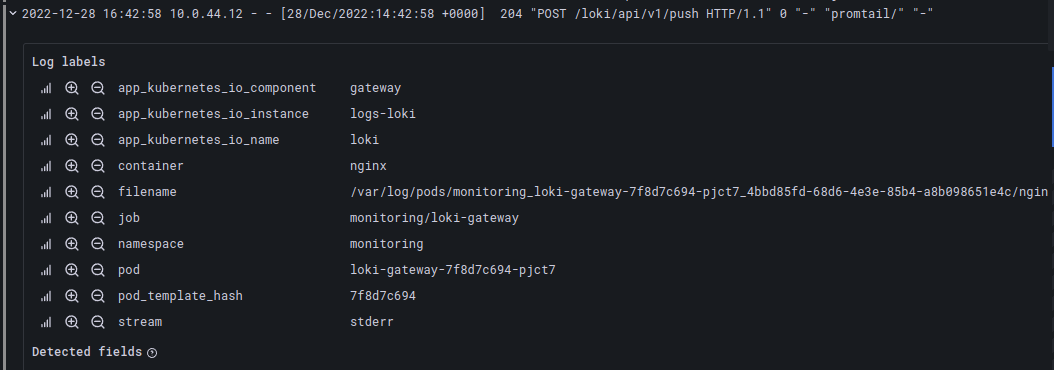
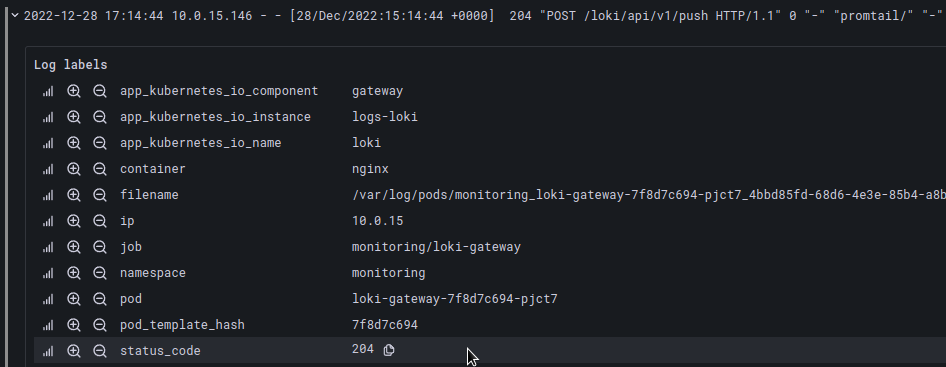
10.0.44.12 – – [28/Dec/2022:14:42:58 +0000] 204 “POST /loki/api/v1/push HTTP/1.1” 0 “-” “promtail/” “-“
We can dynamically generate labels ip and status_code:
{container="nginx"} | regexp "^(?P<ip>[0-9]{1,3}.{3}[0-9]{1,3}).*(?P<status_code>[0-9]{3})"
pattern
The pattern allows you to create labels based on log record templates, i.e. the line:
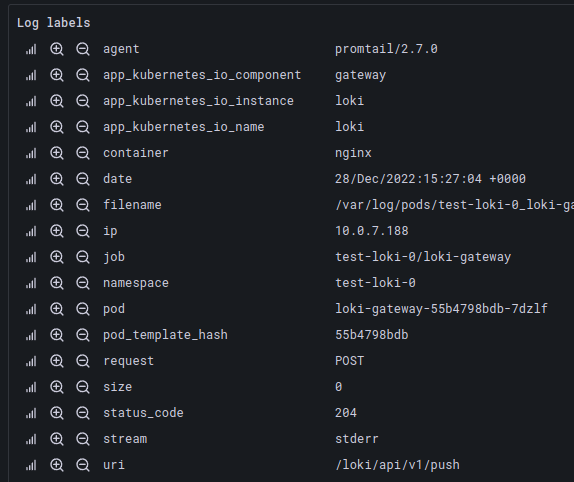
10.0.7.188 – – [28/Dec/2022:15:27:04 +0000] 204 “POST /loki/api/v1/push HTTP/1.1” 0 “-” “promtail/2.7.0” “-“
Can be described as:
{container="nginx"} | pattern `<ip> - - [<date>] <status_code> "<request> <uri> <_>" <size> "<_>" "<agent>" <_>`
where <_> ignores, that is, does not creates a tag.
And as a result, we will get a set of labels according to this template:
See more here – Introducing the pattern parser.
Tag filtering expressions
As can be seen from the name, it allows you to create new filters from tags that are already in the record, or that were created using a previous parser, for example logfmt.
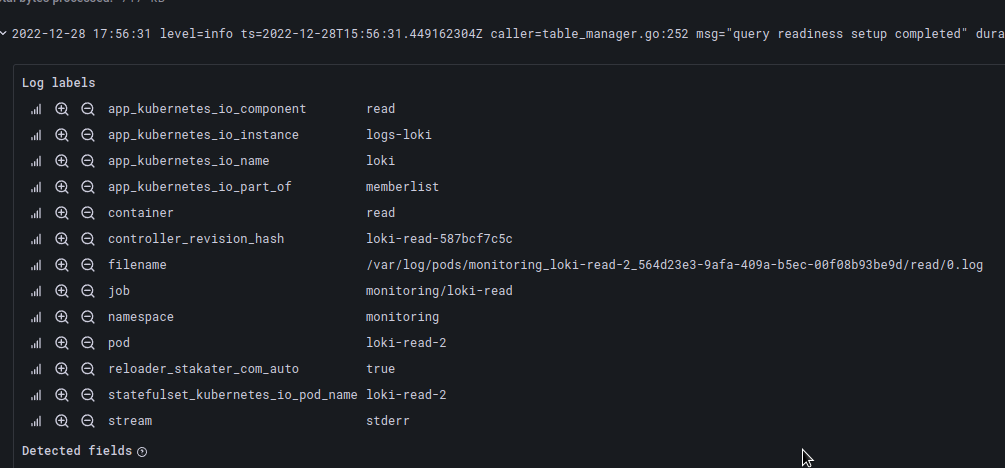
Let’s take the following string:
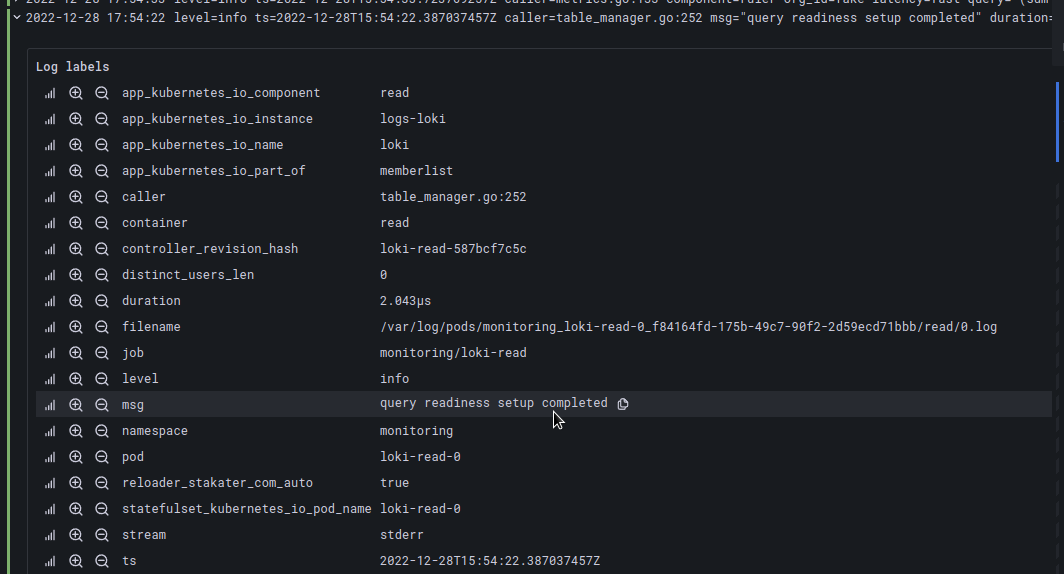
level=info ts=2022-12-28T15:56:31.449162304Z caller=table_manager.go:252 msg=”query readiness setup completed” duration=1.965µs distinct_users_len=0
If we pass it through the parser logrmt, we will get the tags caller, msg, durarion and distinct_users_len:
Next, we can create a filter based on these tags:
Available operators here are ==, =, !=, >, >=, <, <=.
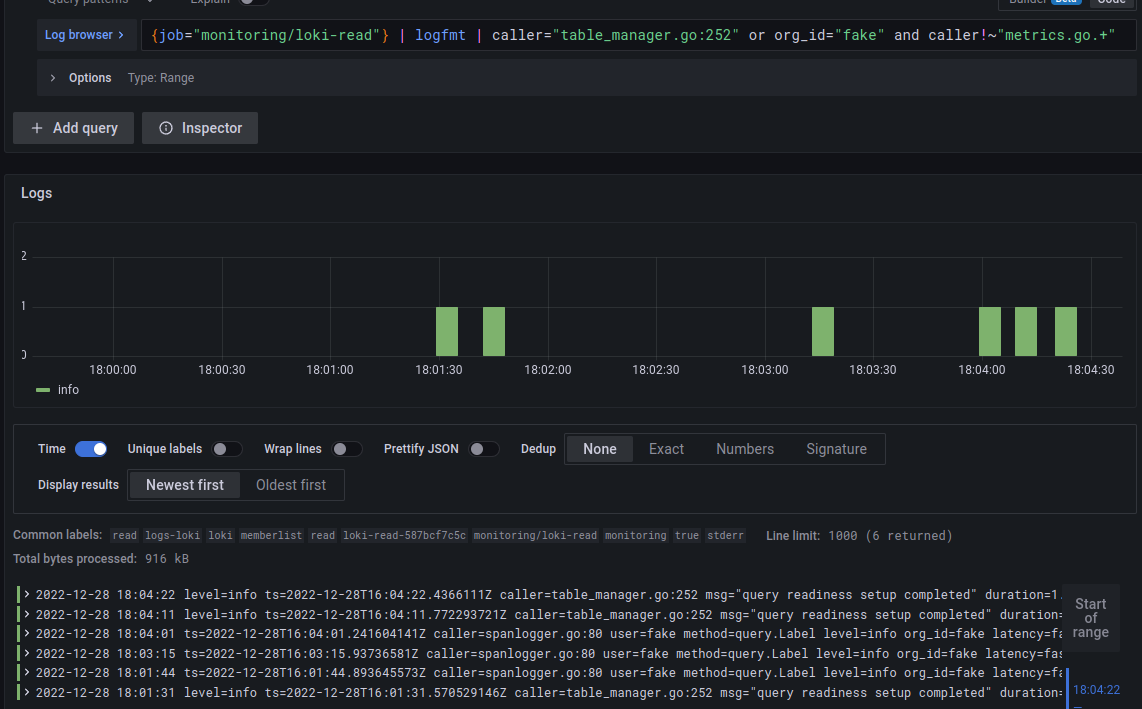
Also, we can use operators and or or:
{job="monitoring/loki-read"} | logfmt | caller="table_manager.go:252" or org_id="fake" and caller!~"metrics.go.+"
Log line formatting expressions
Next, we can form what data will be displayed to us in the record.
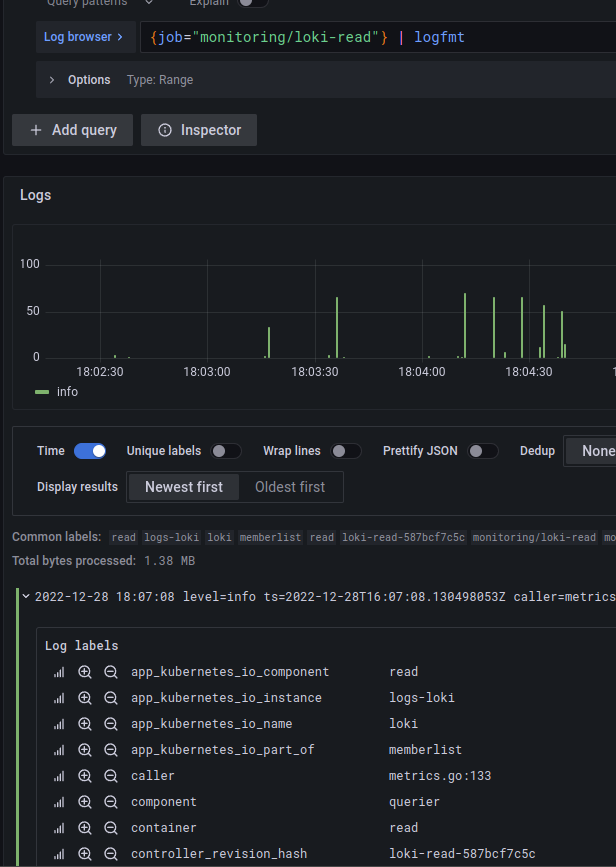
For example, let’s take the same loki-read where we have labels:
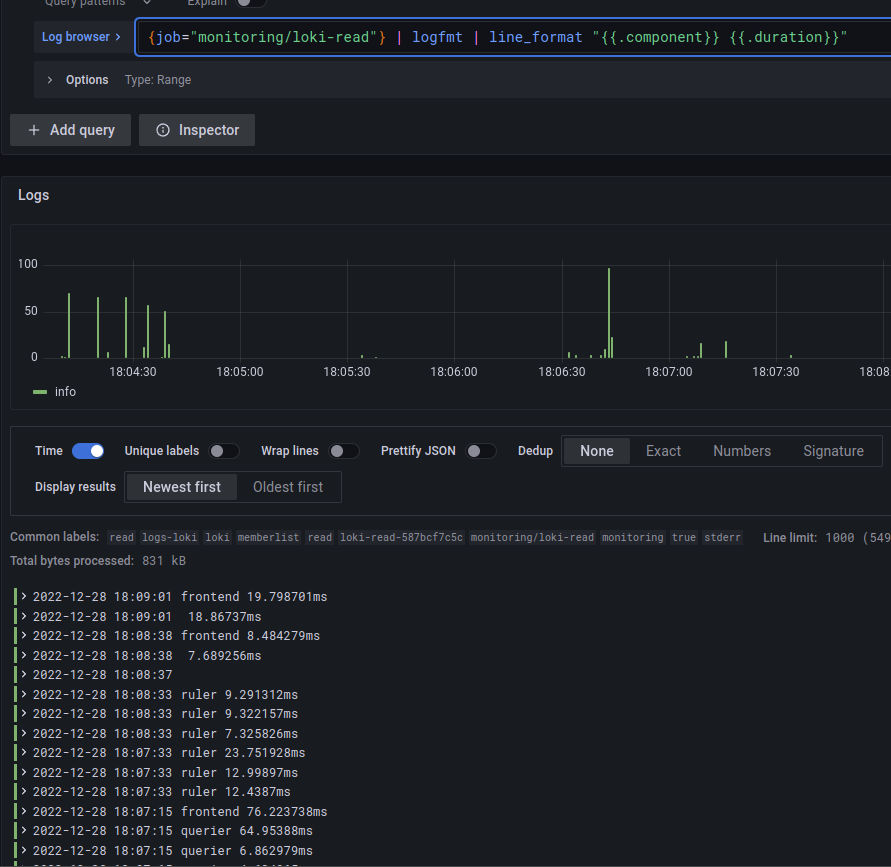
Among them, we are interested in displaying the only component and duration, so we can use the following formatting:
{job="monitoring/loki-read"} | logfmt | line_format "{{.component}} {{.duration}}"
Label format expressions
With its help of the label_format we can rename, change or add new labels.
To do so, we pass the name of the label with the operator = followed by the desired value as an argument.
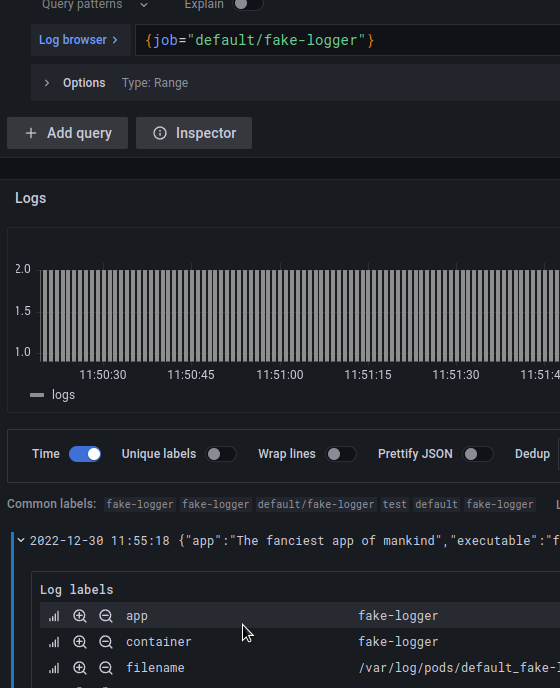
For example, we have a label app:
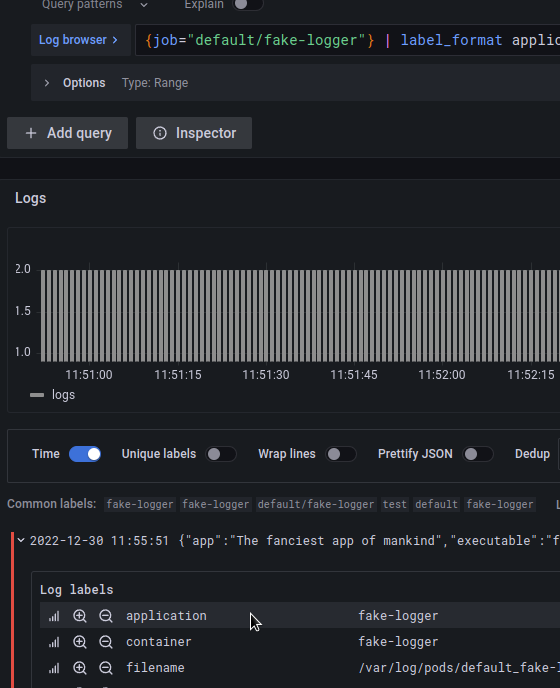
Which we want to rename to application – use label_format application=app:
Or we can use the value of an existing label to create a new one, for this we use a template in the form of {{.field_name}}, where we can combine several fields.
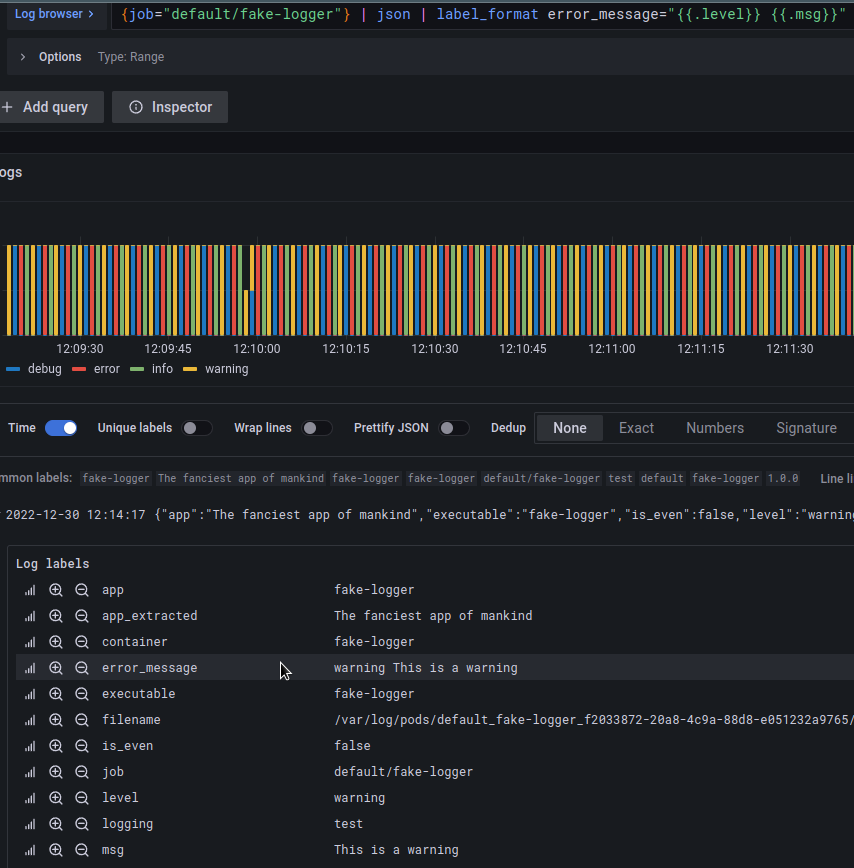
That is if we want to create a label error_message that will contain the values of fields level and msg – we can build the following request:
{job="default/fake-logger"} | json | label_format error_message="{{.level}} {{.msg}}"
Log Metrics
And let’s see how we can create metrics from logs that can be used to generate graphs or alerts (see Grafana Loki: alerts from the Loki Ruler and labels from logs).
Interval vectors
For working with time vectors, there are currently four available functions, already familiar from Prometheus:
rate: number of logs per secondcount_over_time: count the number of stream entries for a given time periodbytes_rate: number of bytes per secondbytes_over_time: count the number of bytes of the stream for a given time interval
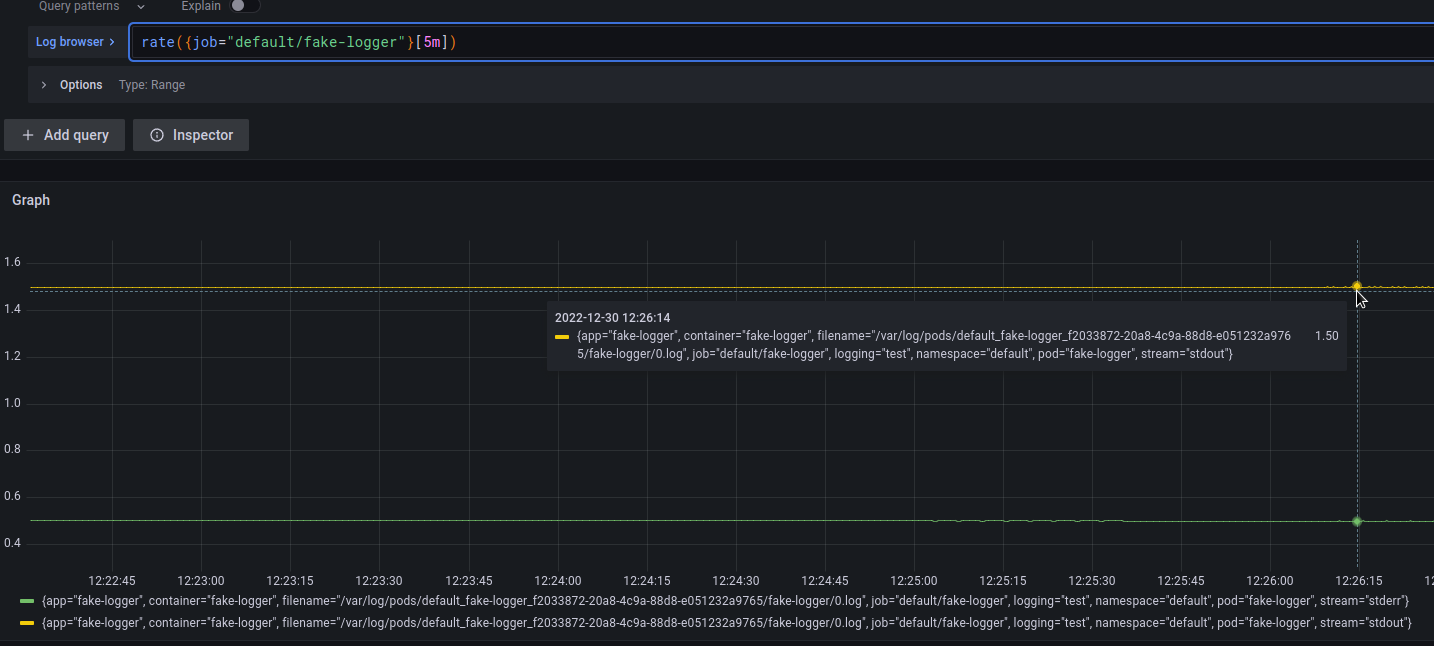
For example, to get queries per second for the fake-logger job:
rate({job="default/fake-logger"}[5m])
It can be useful to create an alert for a case when some service starts writing a lot of logs, which can be a sign that “something went wrong”.
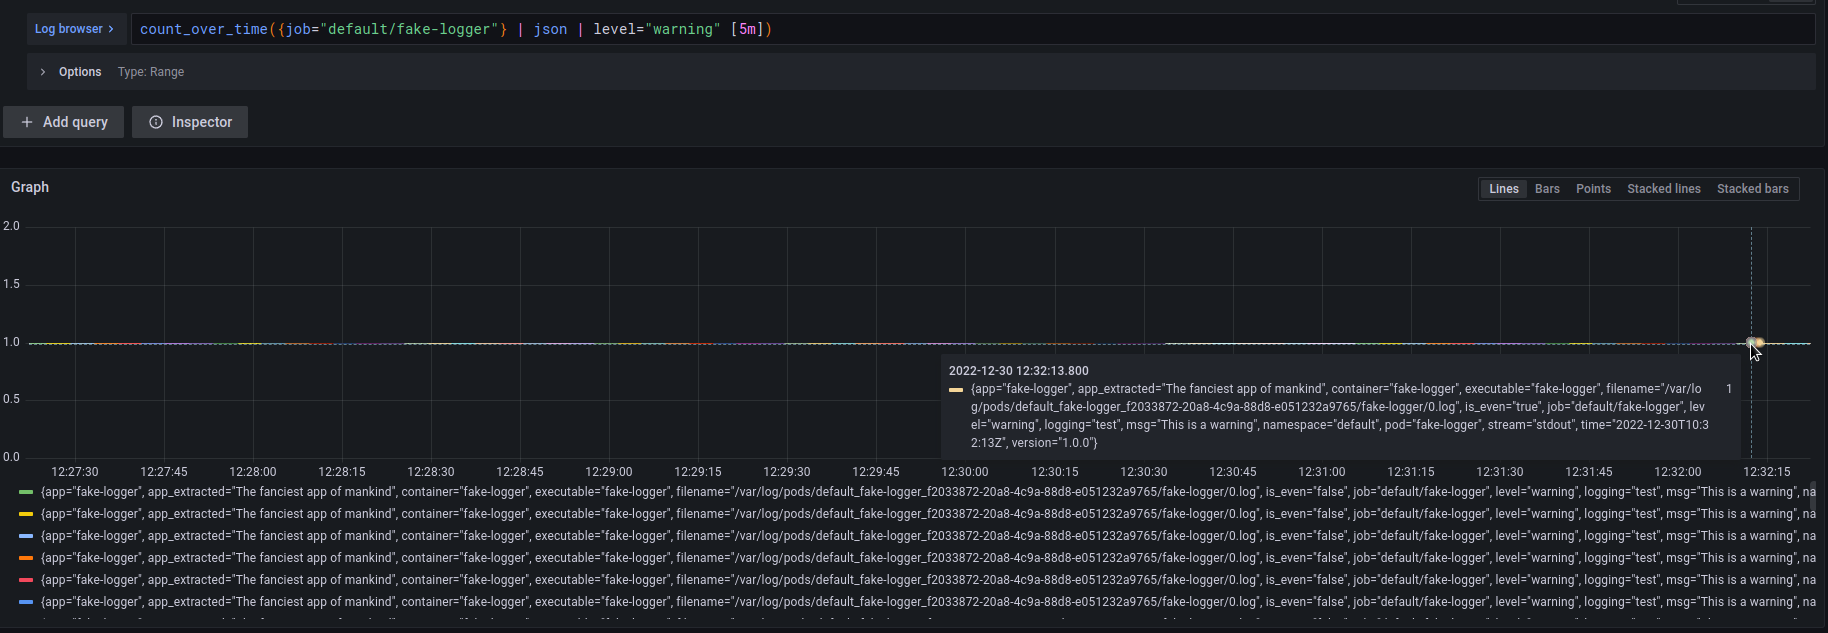
You can get the number of records with a level warningin the last 5 minutes using the following query:
count_over_time({job="default/fake-logger"} | json | level="warning" [5m])
Aggregation Functions
Also, we can use aggregation functions to combine output data, also familiar from PromQL:
sum: an amount by labelmin,maxandavg: minimum, maximum, and average valuestdev,stdvar: standard deviation and variancecount: the number of elements in the vectorbottomkandtopk: minimum and maximum elements
Syntax of aggregation functions:
<aggr-op>([parameter,] <vector expression>) [without|by (<label list>)]
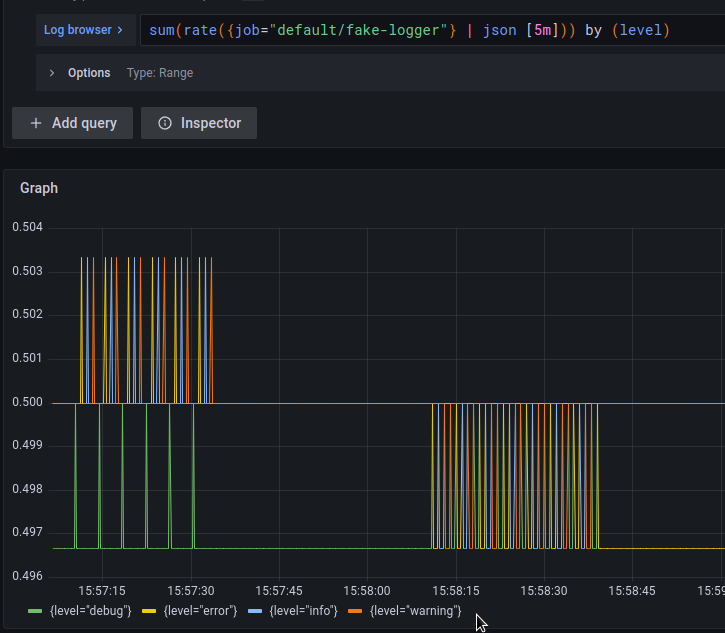
For example, to get the number of records per second from the fake-logger job, and divide them by the label:
sum(rate({job="default/fake-logger"} | json [5m])) by (level)
Or from the examples above:
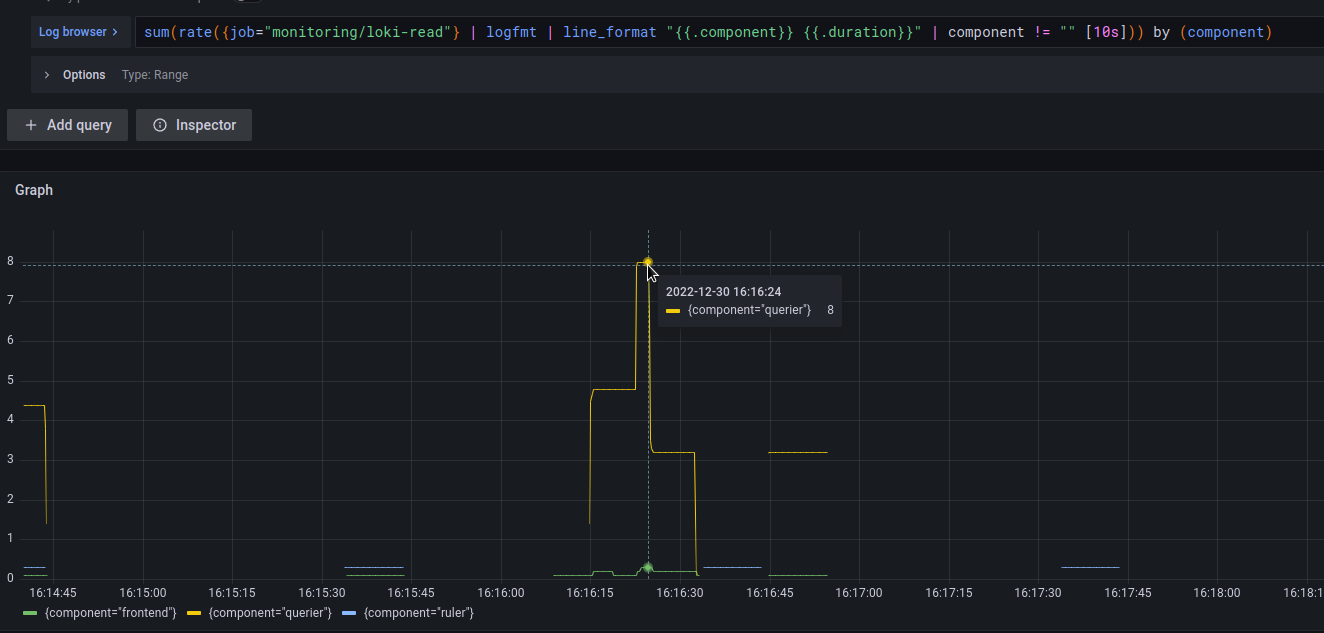
- get records from loki-read pods
- from the result to create two new labels –
componentandduration - get the number of records per second
- remove entries without a component
- and display the sum for each component
sum(rate({job="monitoring/loki-read"} | logfmt | line_format "{{.component}} {{.duration}}" | component != "" [10s])) by (component)
Other operators
And very briefly about other possibilities.
Mathematical operators:
+– addition-– subtraction*– multiplication/– division%is the coefficient^– exponentiation
Logical operators:
and: andor: orunless: except
Comparison operators:
==: is equal to!=: is not equal to>: more than>=: greater than or equal to<: less than<=: less than or equal to
Again from the examples used earlier, create a label request:
{container="nginx"} | pattern `<_> - - [<_>] <_> "<request> <_> <_>" <_> "<_>" "<_>" <_>`
Let’s get the rate of POST requests per second for the last 5 minutes:
sum(rate({container="nginx"} | pattern `<_> - - [<_>] <_> "<request> <_> <_>" <_> "<_>" "<_>" <_>` | request="POST" [5m]))
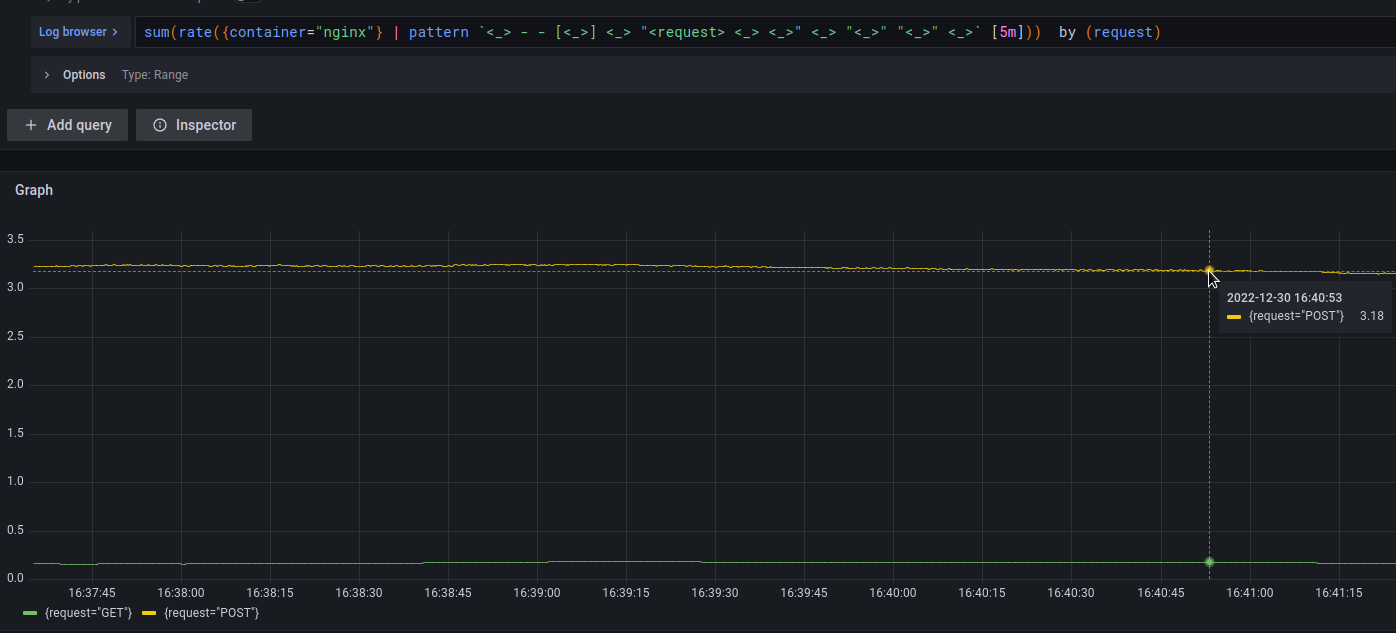
First, let’s check the number of GET and POST requests on the graph:
sum(rate({container="nginx"} | pattern `<_> - - [<_>] <_> "<request> <_> <_>" <_> "<_>" "<_>" <_>` [5m])) by (request)
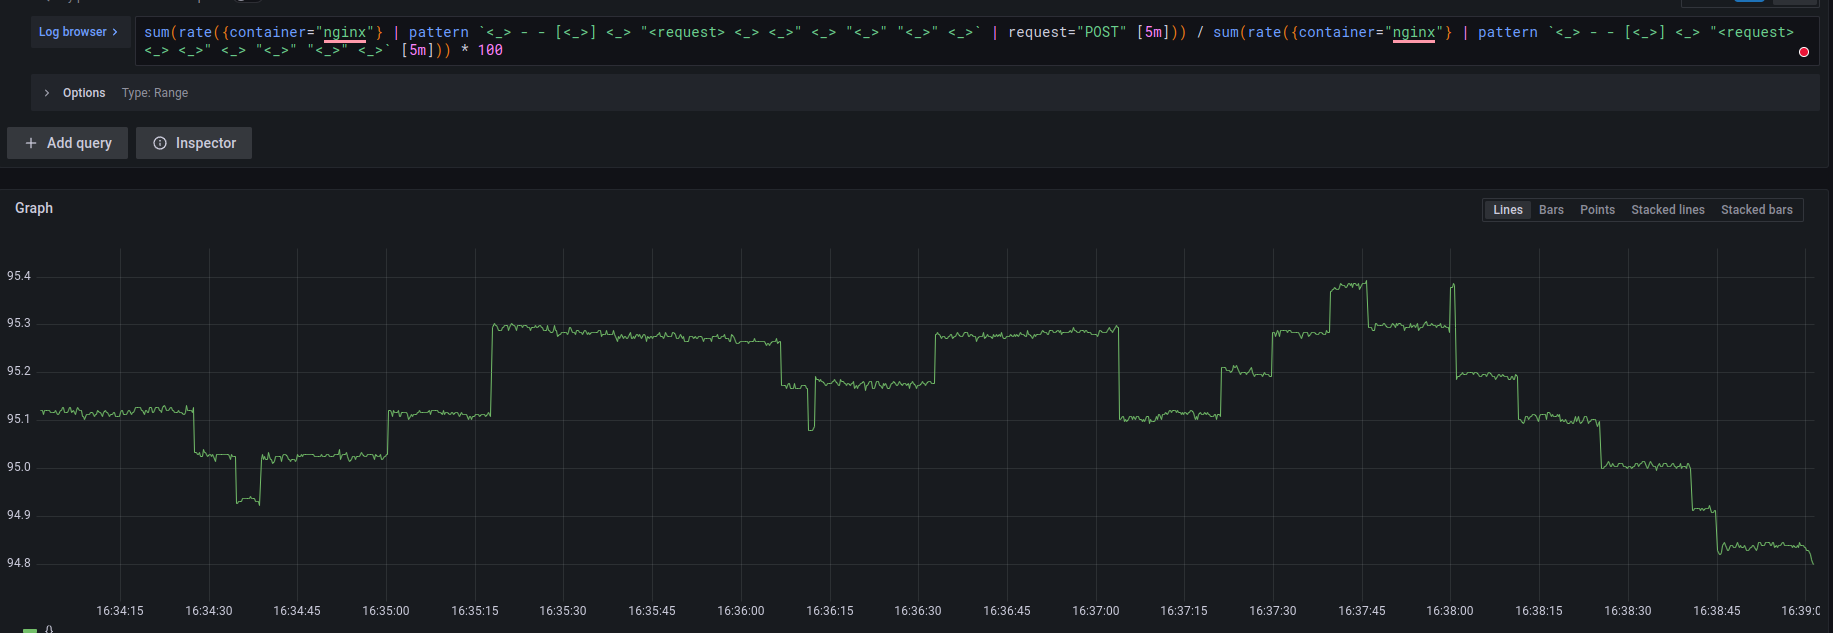
And now we will get a percentage with POST type from the total number of requests:
- divide all POST requests by the total number of requests
- multiply the result by 100
sum(rate({container="nginx"} | pattern `<_> - - [<_>] <_> "<request> <_> <_>" <_> "<_>" "<_>" <_>` | request="POST" [5m])) / sum(rate({container="nginx"} | pattern `<_> - - [<_>] <_> "<request> <_> <_>" <_> "<_>" "<_>" <_>` [5m])) * 100
That’s all.
Useful links
- Log queries
- Metric queries
- LogQL: Log query language
- Usage of Grafana Loki Query Language LogQL
- LogQL
- New in Loki 2.3: LogQL pattern parser makes it easier to extract data from unstructured logs
- Loki 2.0 released: Transform logs as you’re querying them, and set up alerts within Loki
- Logging in Kubernetes with Loki and the PLG stack
- How to create fast queries with Loki’s LogQL to filter terabytes of logs in seconds
- Labels from Logs
- The concise guide to labels in Loki
- How labels in Loki can make log queries faster and easier
- Grafana Loki and what can go wrong with label cardinality
![]()
