The last time I worked with Loki when it was still in Beta, and it looked much simpler then than it does now.
In the new project, there is no logging system at all, and since we all love the Grafana stack, we also decided to use Loki for logging.
Although to be honest, I thought that its setup would be much easier. Well, it wasn’t. A lot has changed, and actually, I had to get to know it essentially from scratch.
What remains, as before, is a kind of documentation. As for me, the description of the architecture and components is still more or less normally described, but when it comes to configuration, you run into a lot of problems, especially related to storage and AWS S3 configuration (although while I was writing this post, the release 2.7 was rolled out, and the documentation was also updated – maybe it is better now). Still, I had to collect it piece by piece, but eventually, everything worked.
So, in this post let’s look at the general architecture and components, then install Loki on Kubernetes on AWS from a Helm chart.
Contents
Grafana Loki architecture
Loki is built on a microservices architecture, with all microservices assembled into a single binary.
To run the components, the --target option is used, where you can define which part of Loki to run.
Input data is divided into streams – that is a stream of data, i.e. logs, that have a common tenant_id (“sender”), and a common set of tags/labels. We’ll talk more about streams in the Storage part of this post.
Loki components
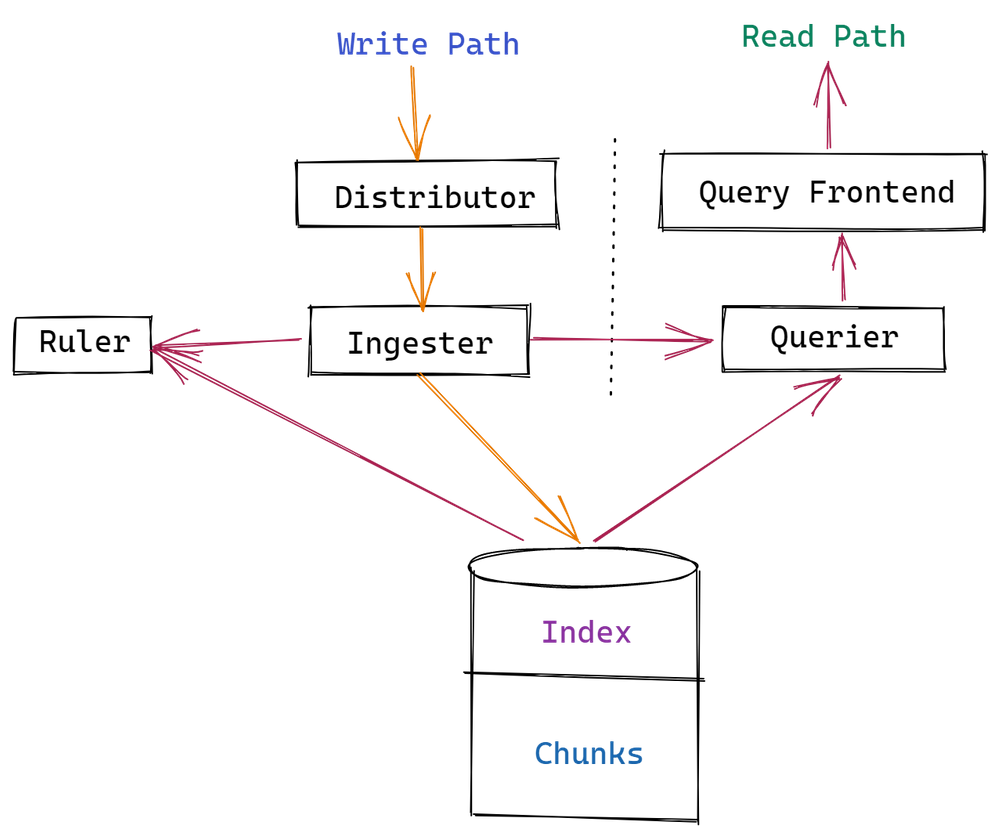
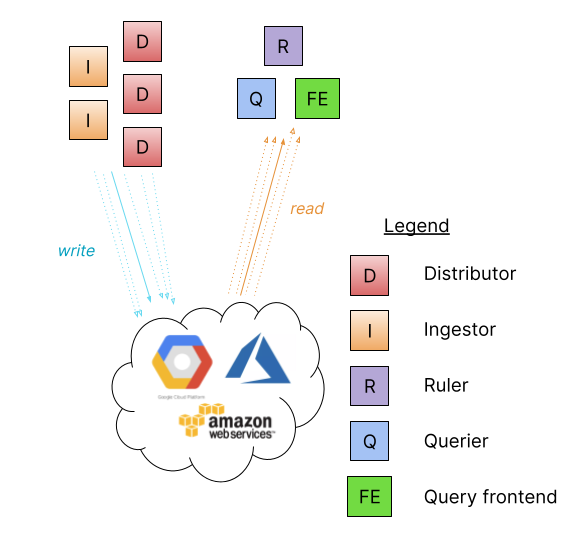
The work of the system is divided into two main flows: Read path – reading (processing requests for data sampling), and Write path – writing this data into storage.
General diagram of all components:
Here:
- distributor (write path): deals with processing input data from clients – receives data from them, validates it, divides the data into blocks (chunks), and sends it to the ingester. It is preferable to have a LoadBalancer in front of the distributors so that the incoming streams are distributed among the instances of the distributors. It is a stateless component – it does not store any data. Also responsible for rate limits and tag preprocessing.
- ingester (write, read path): responsible for writing data to the long-term storage and for transferring data to process requests to read it from clients. To prevent data loss in case of restarting an ingestor instance, they are usually started as several instances (see
replication_factor) - querier (read path): processes LogQL queries, downloading data from ingestors and/or long-term storage for a response – first it queries the ingestor, if there is no data in the ingestor’s memory – then the querier goes to the datastore
- query frontend (read path): an optional service that provides access to the querier API to speed up read operations. When using it, it stores incoming queries and the querier calls it to dequeue a request for processing
Also, Loki has additional components:
- ruler: alerts management
- compactor: reducing the size of indexes and managing the storage time of logs in the data store (retention)
Data flow
Briefly about the data processing process itself – read and write requests.
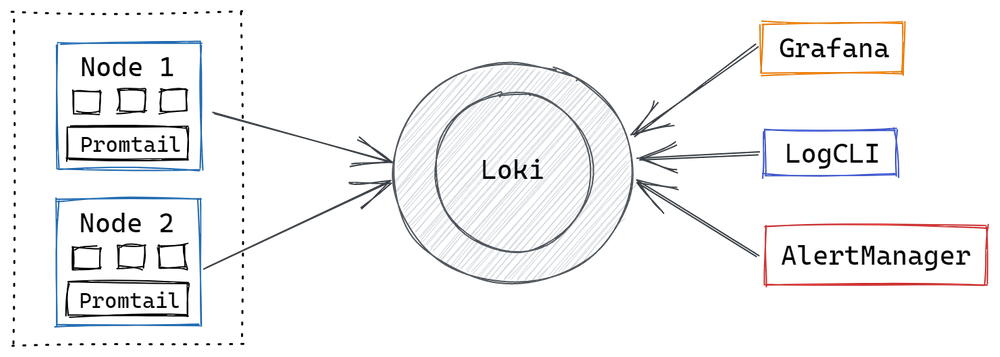
- Loki receives data from
promtail(or other agents such asfluentd) - creates data blocks (chunks), an index, and loads them into a long-term storage
- a user uses LogQL to fetch logs from Grafana
rulerchecks the data and, if necessary, sends an alert to the Prometheus Alertmanager
Read Path
When receiving a data sampling request:
- querier receives an HTTP request
- forwards a request to ingesters to search for data in memory
- if ingesters find the data in themselves, the querier returns them
- if there is no data in the ingesters, the querier goes to the data store and receives them from there
- querier returns a response via an HTTP connection as well
Write Path
When receiving new data:
- distributor receives an HTTP/1 request to add data to a specific stream
- distributor passes each stream to ingester
- ingester creates a new chunk (“block of data”, see Loki Storage ) or supplements an existing one
- distributor responds OK to HTTP/1 request
Launch modes
Loki can be launched in three modes, each of which determines how the components will be launched – in the form of one or more Kubernetes pods.
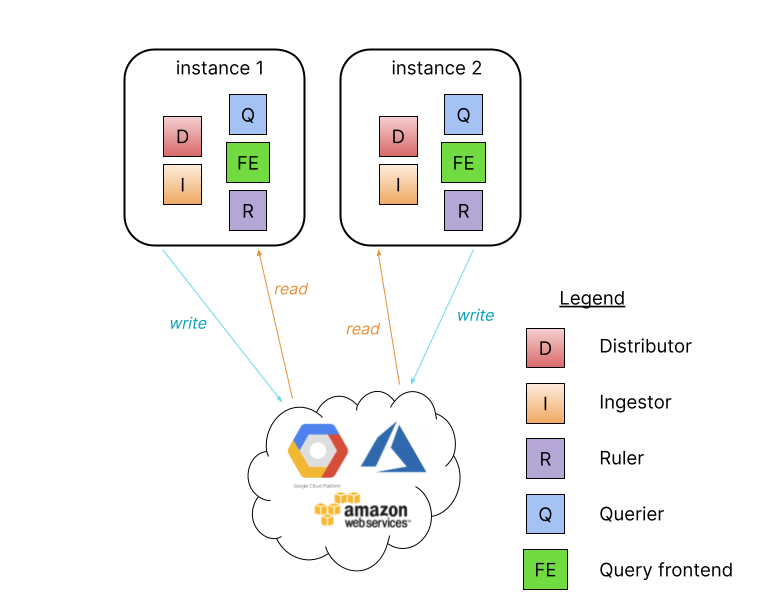
Monolithic mode
The default type when using local filesystem data storage.
Suitable for quick startup and small amounts of data, up to 100GB per day
The balancing of requests is performed on a round-robin basis.
Query parallelization is limited by the number of instances and the configuration of each instance.
The main limitation is that you cannot use object stores such as AWS S3.
Simple scalable deployment mode
The default type when using an object store.
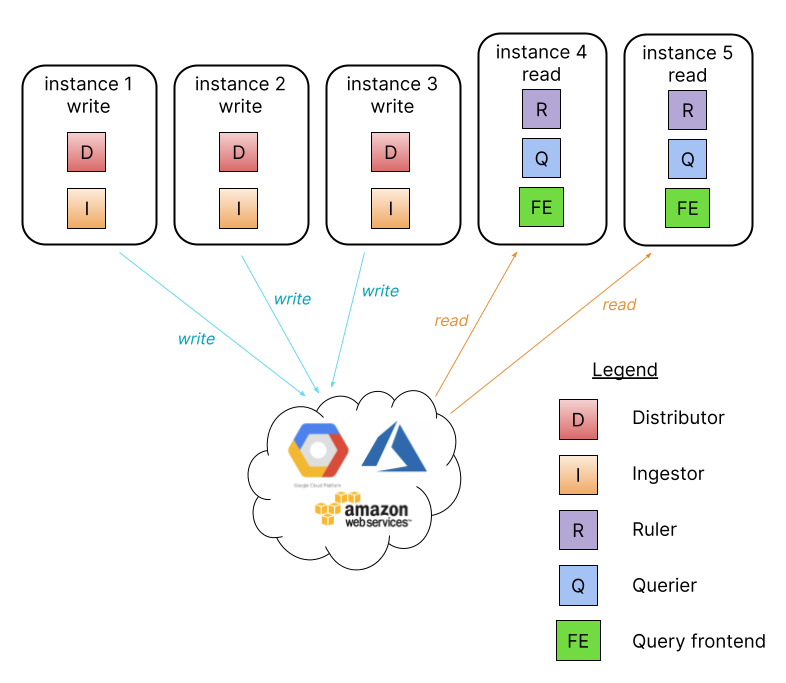
If your logs are more than a few hundred gigabytes, but less than a few terabytes per day, or you want to isolate reading and writing paths, then you can deploy Loki in the simple scalable deployment mode:
In this mode, Loki is launched with two targets – read & write.
Requires a load balancer that will route requests to instances with Loki components.
Microservices mode
And for the most complex cases, when you have terabytes of logs per day, it makes sense to deploy each service separately:
- ingester
- distributor
- query-frontend
- query-scheduler
- querier
- index-gateway
- ruler
- compactor
Allows you to monitor and scale each component independently.
Grafana Loki Storage
See Grafana Loki Storage documentation.
Loki uses two types of data to store logs – chunks and indexes.
Loki receives data from multiple streams, where each stream is a tenant_id and a set of tags. When receiving new records from the stream, they are packed into chunks and sent to long-term storage, which can be AWS S3, a local file system, or databases such as AWS DynamoDB or Apache Cassandra.
The indexes store information about the set of tags of each stream and have links to the chunks associated with this stream.
Previously, Loki used two separate storages – one for indexes (for example, DynamoDB tables), and the second – directly for the data itself (for example, AWS S3).
Somewhere from version 2.0, Loki got the ability to store indexes in the form of BotlDB files and to use the Single Store – single storage for both data blocks and indexes. See Single Store Loki (boltdb-shipper index type).
We will use the boltdb-shipper – it will create indexes locally, and then push them to the shared object-store. The chunks will also be stored there.
Also, in the Loki 2.7 a new way of storing indexes has appeared – in the form of TSDB files, see Grafana Loki 2.7 release: TSDB index, Promtail enhancements, and more.
Loki streams, labels, and data storing
An important point to consider when working with tags in Loki is how indexes and data blocks are formed: each separate set of tags forms a separate stream, and each separate stream has its own indexes and data blocks.
That is, if you dynamically create tags/labels, for example client_ip, then you will have a separate set of files for each client IP, which will lead to the fact that separate GET/POST/DELETE requests will be performed for each such file, so at first, it will affect the cost of storage (as in the case of AWS S3, where each call is paid), and secondly, it may cause problems with the speed of processing requests.
See. Labels and an excellent post – Grafana Loki and what can go wrong with label cardinality.
Loki Helm charts
In addition to documentation issues, Loki also has some difficulties with charts, as they were transferred between repositories, merged, and now some have become deprecated (although there are references to them in the documentation).
Below is not about the setup, but just some details of the Loki Helm charts.
So, there is a Helm repository of Grafana – https://grafana.github.io/helm-charts, add it:
[simterm]
$ helm repo add grafana https://grafana.github.io/helm-charts
[/simterm]
If you open it in a browser, there will be a link to the documentation:
Chart documentation is available in grafana directory.
Follow the link, and you’ll get to the git repository, which contains a list of charts:
loki-canary– relevantloki-distributed– relevantloki-simple-scalable– deprecated, moved to the https://github.com/grafana/loki/tree/main/production/helm/lokiloki-stack– relevantloki– deprecated, moved to the https://github.com/grafana/loki/tree/main/production/helm/loki
Also, they can be found when searching with Helm:
[simterm]
$ helm search repo grafana loki
NAME                            CHART VERSION   APP VERSION     DESCRIPTION
bitnami/grafana-loki            2.5.0           2.7.0           Grafana Loki is a horizontally scalable, highly...
grafana/loki                    3.3.4           2.6.1           Helm chart for Grafana Loki in simple, scalable...
grafana/loki-canary             0.10.0          2.6.1           Helm chart for Grafana Loki Canary
grafana/loki-distributed        0.65.0          2.6.1           Helm chart for Grafana Loki in microservices mode
grafana/loki-simple-scalable    1.8.11          2.6.1           Helm chart for Grafana Loki in simple, scalable...
[/simterm]
Maybe they left it for compatibility, okay, but it adds difficulties with the installation.
You can download and unzip locally to see what’s there:
[simterm]
$ helm pull grafana/loki --untar
[/simterm]
The default values – here>>>.
Helm chart, and Deployment Mode
Another point that was a bit brain-wrenching: ok, we saw that Loki can be run with different Deployment modes – but how to define this in the chart? There is no option in the values like -target.
Below is some digging into the chart, which can be skipped if the default setup is fine with you.
So, if installed with default values, we get the following components:
[simterm]
$ helm install loki grafana/loki
...
Installed components:
* grafana-agent-operator
* gateway
* read
* write
[/simterm]
And Pods:
[simterm]
$ kk get pod
NAME                                           READY   STATUS              RESTARTS   AGE
loki-canary-7vrj2                              0/1     ContainerCreating   0          12s
loki-gateway-5868b68c68-lwtfj                  0/1     ContainerCreating   0          12s
loki-grafana-agent-operator-684b478b77-zmw5t   1/1     Running             0          12s
loki-logs-kwxcx                                0/2     ContainerCreating   0          3s
loki-read-0                                    0/1     ContainerCreating   0          12s
loki-read-1                                    0/1     Pending             0          12s
loki-read-2                                    0/1     Pending             0          12s
loki-write-0                                   0/1     ContainerCreating   0          12s
loki-write-1                                   0/1     Pending             0          12s
loki-write-2                                   0/1     Pending             0          12s
[/simterm]
That is, by default it is set to the simple-scalable mode, while the documentation of the charts itself does not say anything about it, not even a word about how to set the deployment mode in general.
But what if I want the Single Binary?
Remove the installation:
[simterm]
$ helm uninstall loki
release "loki" uninstalled
[/simterm]
Let’s try to believe the documentation, and create our values:
loki:
  commonConfig:
    replication_factor: 1
  storage:
    type: 'filesystem'
Install:
[simterm]
$ helm upgrade --install --values values-local.yaml loki grafana/loki
...
Installed components:
* grafana-agent-operator
* loki
[/simterm]
What?
That is, just by redefining the storage – we’ve changed the deployment mode?!?
…
Okay… How does it work?
Open the templates/_helpers.tpl file, which contains two templates – loki.deployment.isScalable and loki.deployment.isSingleBinary, which contain the same condition, only with different values:
...
{{- eq (include "loki.isUsingObjectStorage" . ) "false" }}
...
If true – then it’s isScalable, if it’s false – then isSingleBinary.
Okay, what is the isUsingObjectStorage?
Find it in the same helper:
...
{{/* Determine if deployment is using object storage */}}
{{- define "loki.isUsingObjectStorage" -}}
{{- or (eq .Values.loki.storage.type "gcs") (eq .Values.loki.storage.type "s3") (eq .Values.loki.storage.type "azure") -}}
{{- end -}}
...
That is if we use .Values.loki.storage.type with a value of gcs, s3or azure – the loki.isUsingObjectStorage will take the value of true, and Loki will be set to Simple Scale mode.
It is far from obvious and not described in the documentation for the chart.
Launching Grafana Loki
Now, finally, let’s move on to running and configuring Loki.
We will use AWS S3 for data storage, for work with indexes – bottledb-shipper, for setting the log storage period – compactor.
For Loki authentication in AWS, we will use a ServiceAccount with AWS IAM Role, but I will also show an example with ordinary ACCESS/SECRET keys.
Creating an AWS S3 bucket
Let’s start by creating a basket. It is possible through AWS CLI and the create-bucket, or through Terraform:
resource "aws_s3_bucket" "loki_object_store" {
  bucket = "${var.client}-${var.environment}-loki-object-store"

  tags = {
    Name        = "Grafana Loki Object Store"
    environment = var.environment
    service     = var.service
  }
}
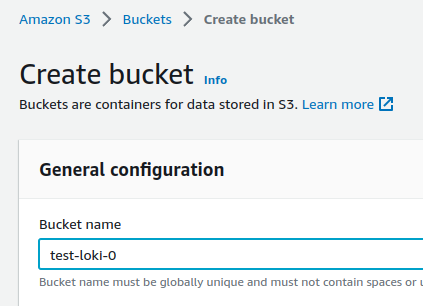
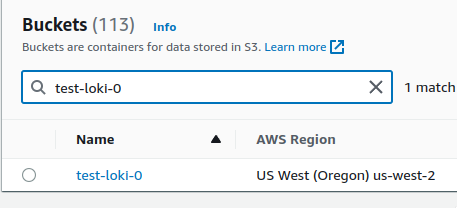
Now, for simplicity, we will create through the AWS Console:
Remember the region, here it is the us-west-2 :
AWS IAM Role && Policy
We will need a policy that allows access to the bucket, and a role, which will be connected to Kubernetes Pods with Loki instances.
Back to the Loki documentation issues – the Grafana Loki Storage page has an example of a policy for AWS S3 that… doesn’t pass validation in AWS IAM :faceplam:
In general, I often had associations with Microsoft Azure – you can’t trust the documentation there either, and everything has to be checked and collected piece by piece.
Using ServiceAccount
I described ServiceAccount and IAM configuration in detail in another post, the Kubernetes: ServiceAccount from AWS IAM Role for Kubernetes Pod, so in this one let’s do it quickly.
Go to the AWS Console > IAM > Policies, create a Policy:
{
    "Version": "2012-10-17",
    "Statement": [
        {
            "Effect": "Allow",
            "Action": [
                "s3:ListBucket",
                "s3:PutObject",
                "s3:GetObject",
                "s3:DeleteObject"
            ],
            "Resource": [
                "arn:aws:s3:::test-loki-0",
                "arn:aws:s3:::test-loki-0/*"
            ]
        }
    ]
}
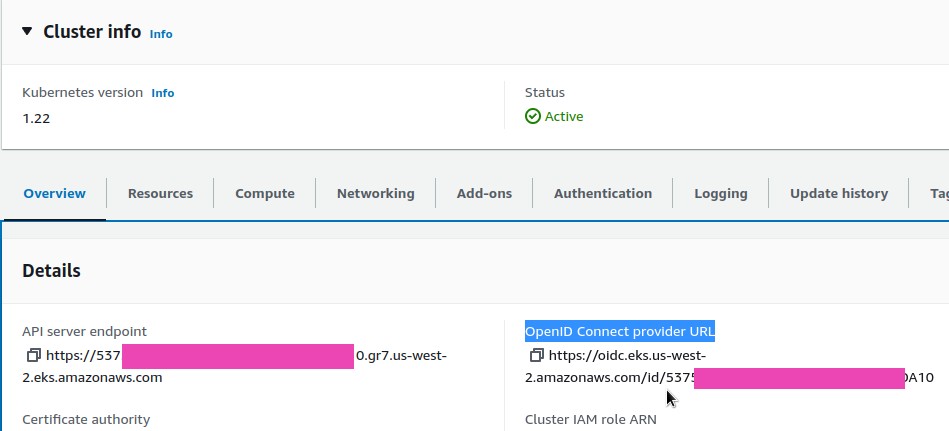
Go to EKS, find the OpenID Connect provider URL:
Go to IAM > Identity providers, find the OIDC ARN by the ID 537***A10:
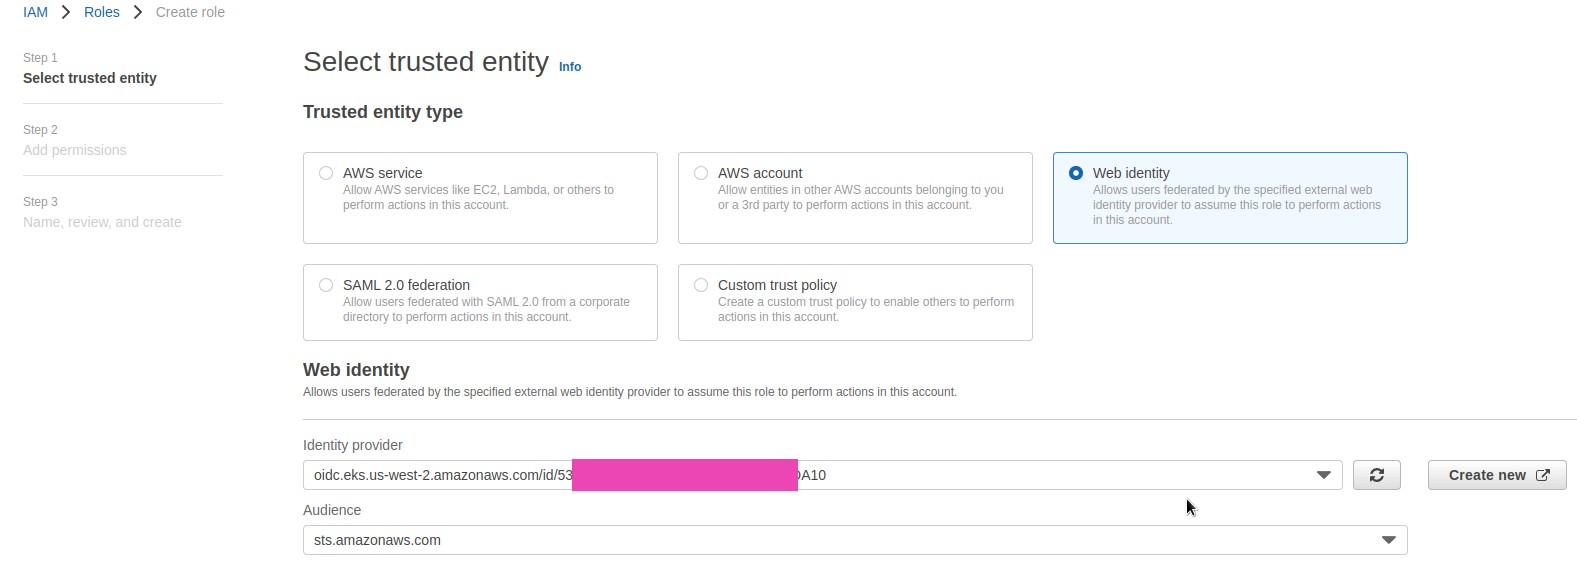
Go to Roles, create a role: select the Web identity type, select our Identity provider from the list, and specify sts.amazon.com in Audience :
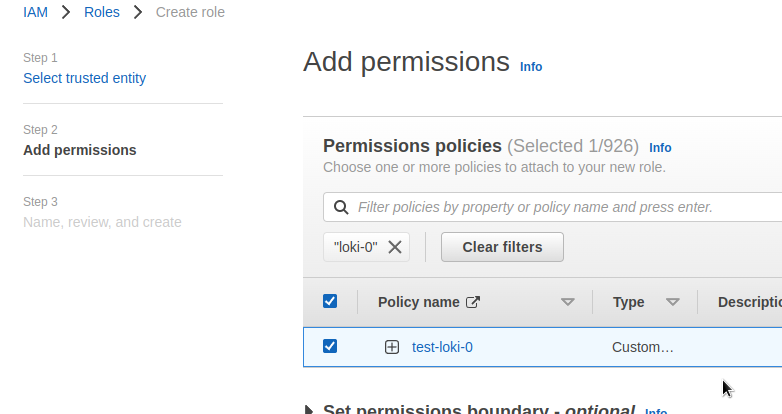
Connect the previously created policy:
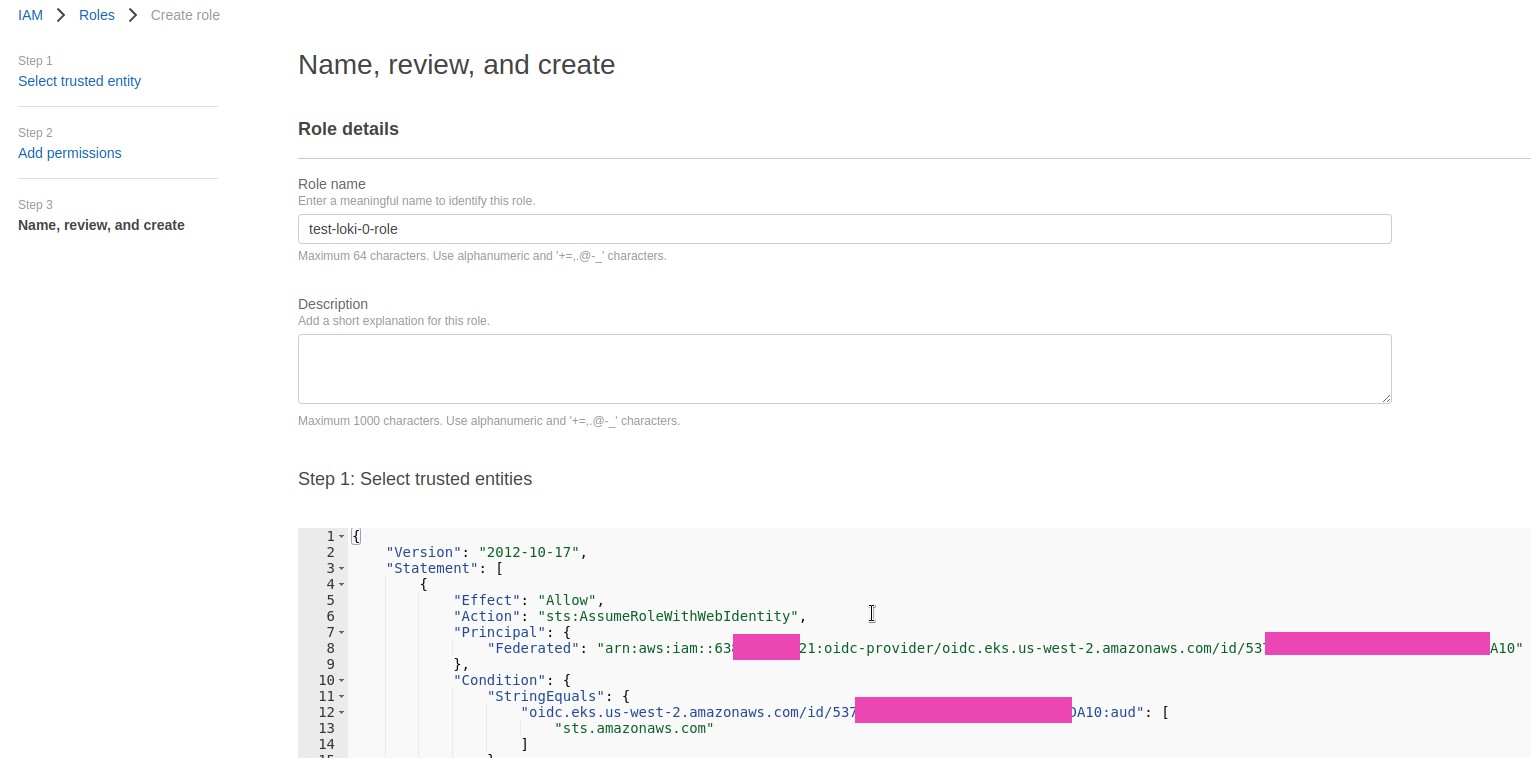
Check the Trusted Policy, and save the new role:
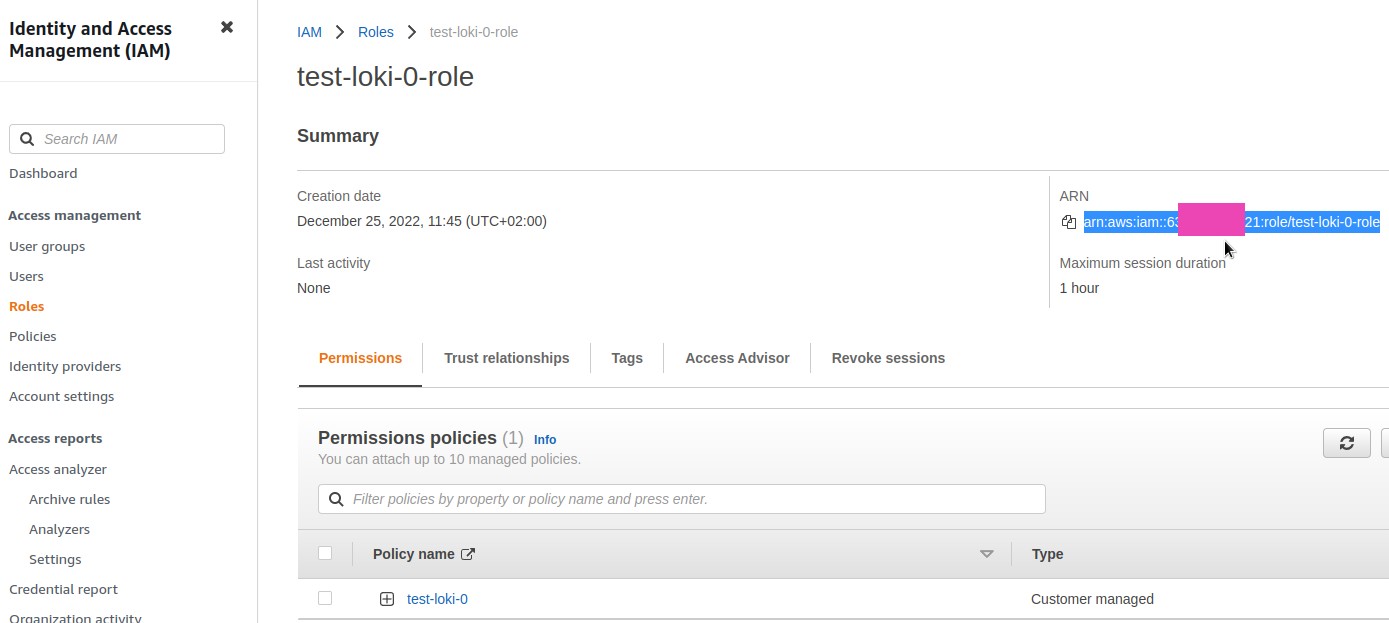
Save the ARN of the role – we will use it later in the Loki parameters:
Using AWS Access and Secret Keys
Another option is to use the access_key_id, secret_access_key options instead of the IAM role and ServiceAccount, see s3-expanded-config.yaml :
...
storage_config:
  aws:
    bucketnames: bucket_name1, bucket_name2
    endpoint: s3.endpoint.com
    region: s3_region
    access_key_id: s3_access_key_id
    secret_access_key: s3_secret_access_key
    insecure: false
...
It’s a bit simpler than ServiceAccount, the only question is how to store and pass secrets with the key.
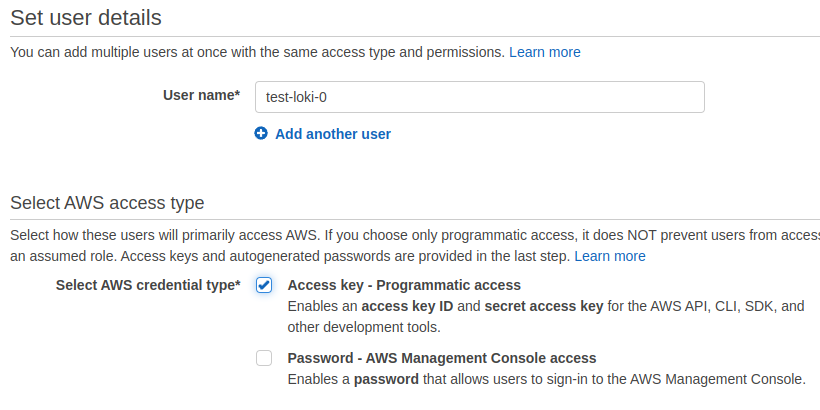
In this example, we will create a regular user through the AWS Console to which we will connect the policy.
Go to IAM > Roles, create a Policy:
{
    "Version": "2012-10-17",
    "Statement": [
        {
            "Effect": "Allow",
            "Action": [
                "s3:ListBucket",
                "s3:PutObject",
                "s3:GetObject",
                "s3:DeleteObject"
            ],
            "Resource": [
                "arn:aws:s3:::test-loki-0",
                "arn:aws:s3:::test-loki-0/*"
            ]
        }
    ]
}
Create a user with the Programmatic access:
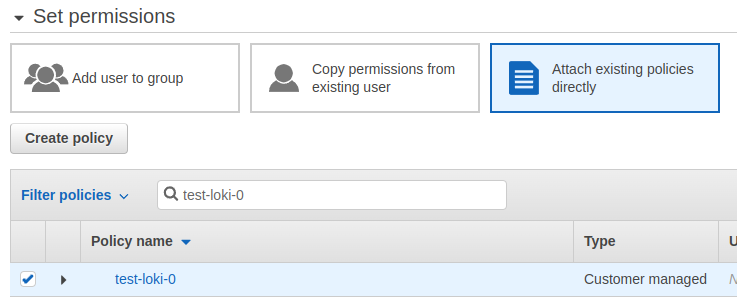
Connect this policy to the user:
Save the keys:
Move on to the Loki config – also got enough pain and suffering with the documentation and the chart.
Running Grafana Loki on Kubernetes
Well, now that it became clear both with the charts, and how to set the Deployment Mode through the Loki Helm chart, and in general which chart to use – let’s try to run it.
Let’s prepare a minimal config, in which we will first disable all its internal monitoring to reduce the number of pods – it will be easier to understand how it works, and for a start, we will use storage of the filesystem type to store data and indexes locally in the Pods:
loki:

  auth_enabled: false
  commonConfig:
    path_prefix: "/var/loki"
    replication_factor: 1

  storage:
    type: "filesystem"

  schema_config:
    configs:
    - from: 2022-12-12
      store: boltdb
      object_store: filesystem
      schema: v12
      index:
        prefix: index_
        period: 168h

storage_config:
  boltdb:
    directory: /var/loki/index

  filesystem:
    directory: /var/loki/chunks

test:
  enabled: false
monitoring:
  dashboards:
    enabled: false
  rules:
    enabled: false
  alerts:
    enabled: false
  serviceMonitor:
    enabled: false
  selfMonitoring:
    enabled: false
    lokiCanary:
      enabled: false
    grafanaAgent:
      installOperator: false
Deploy to the namespace test-loki-0:
[simterm]
$ helm upgrade --install --namespace test-loki-0 --create-namespace --values loki-minimal-values.yaml loki grafana/loki
...
Installed components:
* loki
[/simterm]
Check the Pod
[simterm]
$ kk -n test-loki-0 get pod
NAME     READY   STATUS    RESTARTS   AGE
loki-0   1/1     Running   0          118s
[/simterm]
Okay – there is the only one, nothing unnecessary.
The chart creates a StatefulSet that describes the creation of this Pod and configures various volumes:
[simterm]
$ kk -n test-loki-0 get sts
NAME   READY   AGE
loki   1/1     3m
[/simterm]
And a ConfigMap with the config stored, supplemented by our loki-minimal-values.yaml:
[simterm]
$ kk -n test-loki-0 get cm loki -o yaml
apiVersion: v1
data:
  config.yaml: |
    auth_enabled: false
    common:
      path_prefix: /var/loki
      replication_factor: 1
      storage:
        filesystem:
          chunks_directory: /var/loki/chunks
          rules_directory: /var/loki/rules
...
[/simterm]
Grafana Loki S3 config
I would give a lot to find somewhere a complete config for Grafana Loki with AWS S3 as in the example below, with authorization via ServiceAccount and AWS IAM – I’ve spent a lot of time trying to get it all to work.
Actually, the config itself, then a little about the options and pitfalls I encountered:
loki:

  auth_enabled: false
  commonConfig:
    path_prefix: /var/loki
    replication_factor: 1

  storage:
    bucketNames:
      chunks: test-loki-0
    type: s3

  schema_config:
    configs:
    - from: "2022-01-11"
      index:
        period: 24h
        prefix: loki_index_
      store: boltdb-shipper
      object_store: s3
      schema: v12

  storage_config:
    aws:
      s3: s3://us-west-2/test-loki-0
      insecure: false
      s3forcepathstyle: true
    boltdb_shipper:
      active_index_directory: /var/loki/index
      shared_store: s3
  rulerConfig:
    storage:
      type: local
      local:
        directory: /var/loki/rules

serviceAccount:
  create: true
  annotations:
    eks.amazonaws.com/role-arn: "arn:aws:iam::638***021:role/test-loki-0-role"
write:
  replicas: 2

read:
  replicas: 1

test:
  enabled: false
monitoring:
  dashboards:
    enabled: false
  rules:
    enabled: false
  alerts:
    enabled: false
  serviceMonitor:
    enabled: false
  selfMonitoring:
    enabled: false
    lokiCanary:
      enabled: false
    grafanaAgent:
      installOperator: false
So, here:
auth_enabled: false– disable authorization in Loki itself (as a result, we will receive atenant_idnamed fake in the basket – that’s ok, although developers could come up with something more “beautiful” than the “fake”)storage.bucketNames.chunks– need to specify the name of the basket for the chunks, otherwise, it will try to use local storage; not specified in the documentation;schema_config.configs.store:boltdb-shipper– set the use of theboltdb-shipperfor indexes, since it is capable of Single Store, that is, both data blocks aka chunks and their indexes will be in the same basketobject_store: s3– specify the type of storage that is configured instorage_config.aws.s3(but here we specify exactly asschema_config.configs.store.s3, notschema_config.configs.store.aws.s3)
storage_config– the biggest pain:aws.s3: specify exactly in the form ofs3://<S3_BUCKET_REGION>/<S3_BUCKET_NAME>, otherwise, when connecting a ServiceAccount, Loki starts trying to go to https://sts.dummy.amazonaws.com for authorization – I couldn’t find out why, but when using a ServiceAccount, this format is requiredboltdb_shipper– set the local path where it creates indexes –active_index_directory, andshared_store– where to send them later; will take the config from the samestorage_config.aws.s3
rulerConfig.storage.type: local– for now, specify a local directory for therulercomponent, we will deal with alerts another time; if not specified, it will constantly write an error in the log that it cannot access its basket, which is written somewhere in the defaults, I don’t remember where exactlywrite.replicas: 2– the minimum number of the write Pods so that Promatil can write data
Update the Helm release:
[simterm]
$ helm upgrade --install --namespace test-loki-0 --values loki-values.yaml loki grafana/loki
...
Installed components:
* gateway
* read
* write
[/simterm]
Now we have separate read and write Pods. The Gateway instance simply has an Nginx service to route requests:
[simterm]
$ kk -n test-loki-0 get pod
NAME                            READY   STATUS    RESTARTS   AGE
loki-gateway-55b4798bdb-g9hkl   1/1     Running   0          48s
loki-read-0                     0/1     Pending   0          48s
loki-write-0                    0/1     Running   0          48s
loki-write-1                    0/1     Running   0          47s
[/simterm]
Wait a minute for the pods to go into the Running state, check the logs of the loki-write-0 Pod, and after the message:
msg=”joining memberlist cluster succeeded” reached_nodes=2 elapsed_time=1m39.087106032s
check the bucket:
[simterm]
$ aws --profile development s3 ls test-loki-0
2022-12-25 11:53:13        251 loki_cluster_seed.json
[/simterm]
And in a few more minutes, the fake and index directories should appear :
[simterm]
$ aws --profile development s3 ls test-loki-0
                           PRE fake/
                           PRE index/
2022-12-25 11:53:13        251 loki_cluster_seed.json
[/simterm]
In the fake – the chunks, in the index – indexes.
Okay, looks like it works.
Now after adding a promatil, which will write data – the ingester component will write blocks of data, and the bottledb-shipper will start creating indexes, and push them to the bucket.
Running Promtail
Find the Service of the Loki Gateway:
[simterm]
$ kk -n test-loki-0 get svc
NAME                  TYPE        CLUSTER-IP       EXTERNAL-IP   PORT(S)             AGE
loki-gateway          ClusterIP   10.109.225.168   <none>        80/TCP              22m
...
[/simterm]
Deploy the Promtail chart, with the --set configure the loki.serviceName value:
[simterm]
$ helm upgrade --install --namespace test-loki-0 --set loki.serviceName=loki-gateway promtail grafana/promtail
[/simterm]
Check the Pods:
[simterm]
$ kk -n test-loki-0 get pod
NAME                            READY   STATUS    RESTARTS   AGE
loki-gateway-55b4798bdb-7dzlf   1/1     Running   0          5m32s
loki-read-0                     1/1     Running   0          5m32s
loki-write-0                    1/1     Running   0          5m32s
loki-write-1                    1/1     Running   0          5m32s
promtail-6pw59                  0/1     Running   0          17s
promtail-8h78j                  0/1     Running   0          17s
promtail-jb6bz                  0/1     Pending   0          17s
...
[/simterm]
promtail are running, nice.
Check the Gateway logs – it should show data from the promtail:
[simterm]
$ kk -n test-loki-0 logs -f loki-gateway-55b4798bdb-7dzlf
...
10.0.87.55 - - [25/Dec/2022:09:58:19 +0000]  204 "POST /loki/api/v1/push HTTP/1.1" 0 "-" "promtail/2.7.0" "-"
10.0.109.239 - - [25/Dec/2022:09:58:19 +0000]  204 "POST /loki/api/v1/push HTTP/1.1" 0 "-" "promtail/2.7.0" "-"
[/simterm]
Now let’s install Grafana and connect Loki to it.
Running Grafana
Install from the same repository:
[simterm]
$ helm upgrade --install --namespace test-loki-0 grafana grafana/grafana
[/simterm]
Get the admin user password:
[simterm]
$ kubectl get secret --namespace test-loki-0 grafana -o jsonpath="{.data.admin-password}" | base64 --decode ; echo
ahUAdmUdpemotqICa6jGzvi9wiU01an5qZJx3WSb
[/simterm]
Open Grafana’s port locally:
[simterm]
$ kk -n test-loki-0 port-forward svc/grafana 8080:80
[/simterm]
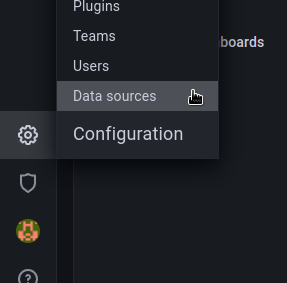
Open http://localhost:8080 in a browser, log in, and go to Configuration – Data Sources :
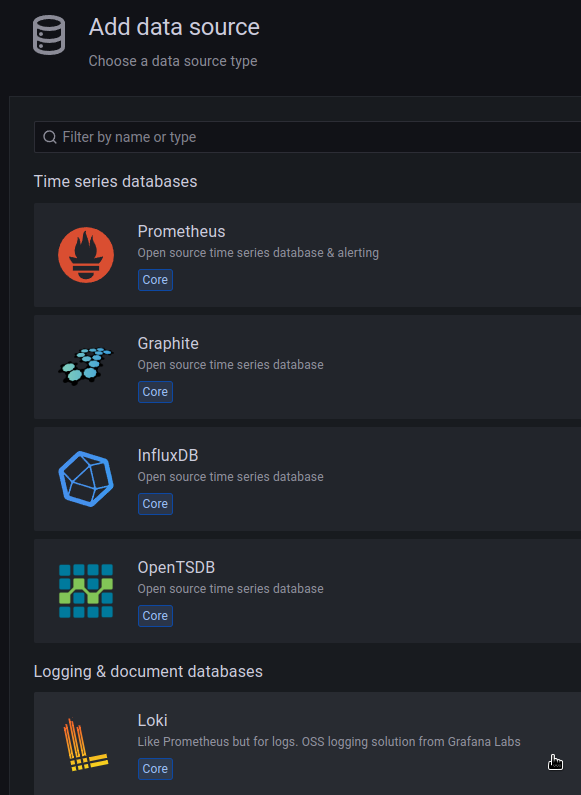
Click Add data source, choose the Loki :
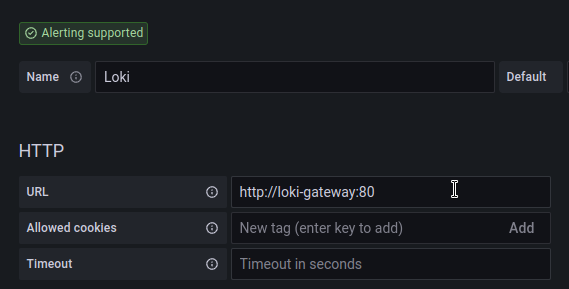
Add Loki, specify http://loki-gateway:80 in the URL :
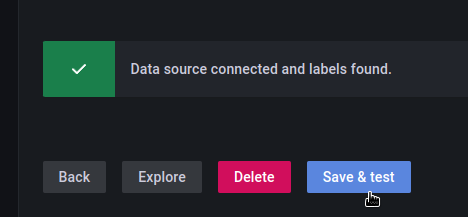
Save, test:
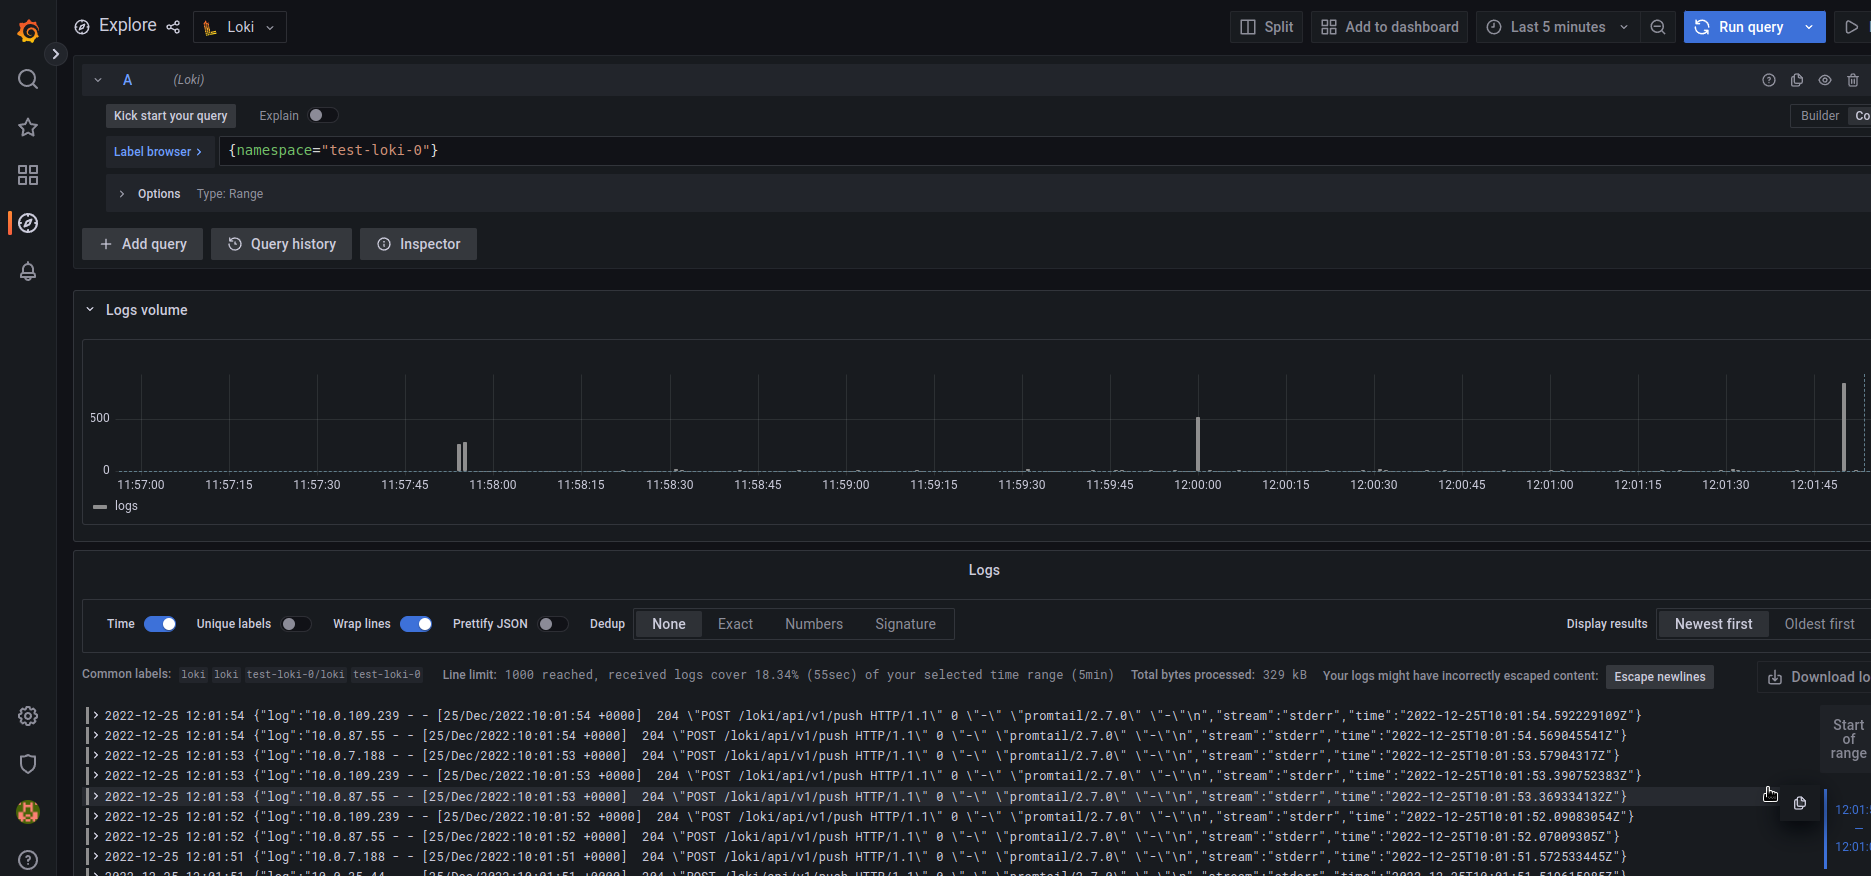
Go to Explore, select Loki from the top, and check the logs:
Done.
![]()
