For general information about Grafana Loki, see the Grafana Loki: architecture and running in Kubernetes with AWS S3 storage and boltdb-shipper post.
Among other components of the Loki, there is a separate service called ruler that is responsible for working with alerts that can be generated directly from logs.
The idea is very simple:
- create a file with alerts in a Prometheus-like format
- connect it to the pod
ruler(the loki-read in the case of simple-scalable deployment) rulerparses the logs according to the rules specified in the configuration file, and if some expression works, then the Ruler sends an alert via the Alertmanager’s API
Alerts will be described in ConfigMap, which will then be connected to pods with Ruler.
Documentation – Rules and the Ruler.
Contents
Test Pod for OOM-Killed
I want to test whether OOM Killed works, so let’s create a Pod with clearly understated limits that will be killed “on the fly”:
---
apiVersion: v1
kind: Pod
metadata:
  name: oom-test
  labels:
    test: "true"
spec:
  containers:
    - name: oom-test
      image: openjdk
      command: [ "/bin/bash", "-c", "--" ]
      args: [ "while true; do sleep 30; done;" ]
      resources:
        limits:
          memory: "1Mi"
  nodeSelector:
    kubernetes.io/hostname: eks-node-dev_data_services-i-081719890438d467f
Specify a node name in the nodeSelector to make it easier to search in Loki.
When this Pod will be started, Kubernetes will kill it due to exceeding the limits, and journald on the WorkerNode will write an event to the system log, which is collected by the promtail:
[simterm]
$ kk -n monitoring get cm logs-promtail -o yaml
...
    - job_name: journal
       journal:
        labels:
          job: systemd-journal
        max_age: 12h
        path: /var/log/journal
      relabel_configs:
      - source_labels:
        - __journal__systemd_unit
        target_label: unit
      - source_labels:
        - __journal__hostname
        target_label: hostname
[/simterm]
Create the Pod:
[simterm]
$ kk apply -f test-oom.yaml
pod/oom-test created
[/simterm]
Check its Events:
[simterm]
$ kk describe pod oom-test
...
Events:
  Type     Reason                  Age                 From               Message
  ----     ------                  ----                ----               -------
  Normal   Scheduled               91s                 default-scheduler  Successfully assigned default/oom-test to ip-10-0-0-27.us-west-2.compute.internal
  Normal   SandboxChanged          79s (x12 over 90s)  kubelet            Pod sandbox changed, it will be killed and re-created.
  Warning  FailedCreatePodSandBox  78s (x13 over 90s)  kubelet            Failed to create pod sandbox: rpc error: code = Unknown desc = failed to start sandbox container for pod "oom-test": Error response from daemon: failed to create shim task: OCI runtime create failed: runc create failed: unable to start container process: container init was OOM-killed (memory limit too low?): unknown
[/simterm]
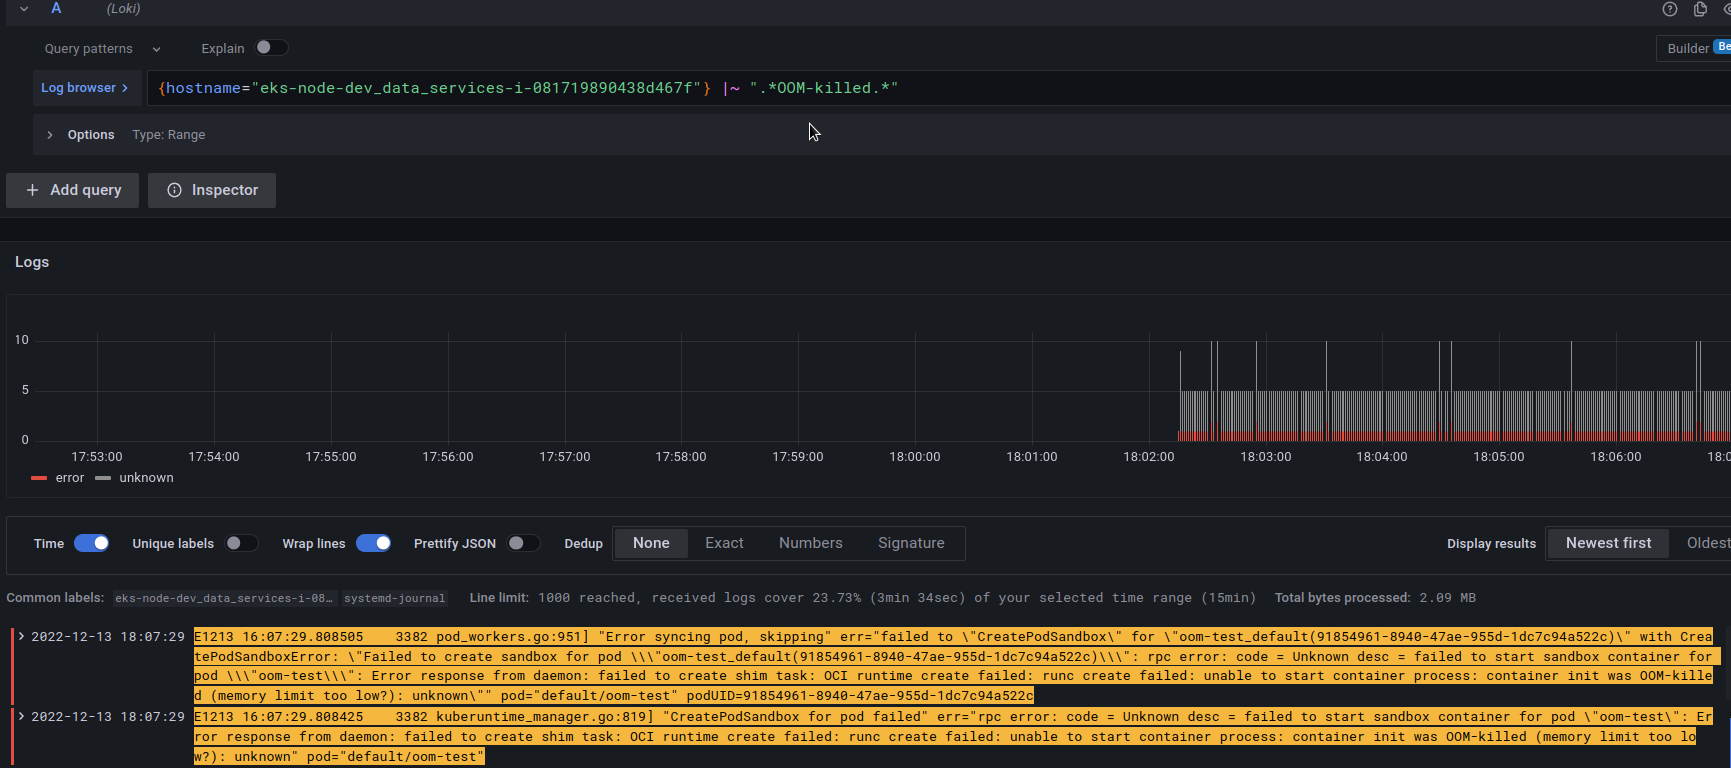
And Loki logs:
Okay, now we have an oom-killed Pod for tests – let’s build a query for a future alert.
Forming a query in Loki
In the logs, we used the {hostname="eks-node-dev_data_services-i-081719890438d467f"} |~ ".*OOM-killed.*" request – let’s use it for a test alert.
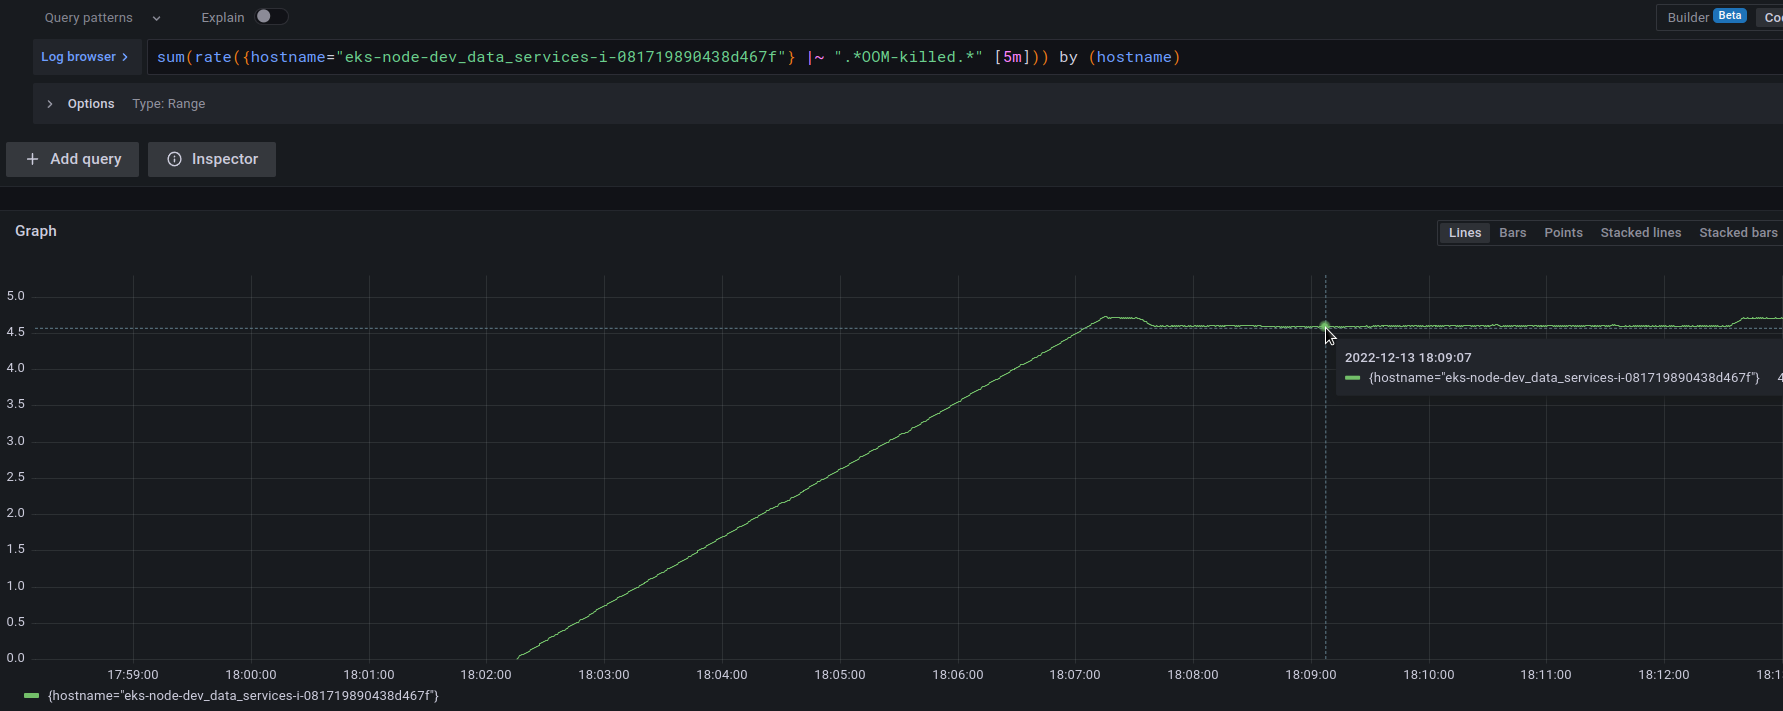
First, let’s check what Loki itself draws for us – use the rate() and sum(), see Log range aggregations :
sum(rate({hostname="eks-node-dev_data_services-i-081719890438d467f"} |~ ".*OOM-killed.*" [5m])) by (hostname)
Good!
Now, we can work with this – create a test alert.
Creating an alert for Loki Ruler
Create a file with a ConfigMap:
kind: ConfigMap
apiVersion: v1
metadata:
  name: rules-alerts
  namespace: monitoring
data:
  rules.yaml: |-
    groups:
      - name: systemd-alerts
        rules:
          - alert: TESTLokiRuler Systemd journal
            expr: |
              sum(rate({hostname="eks-node-dev_data_services-i-081719890438d467f"} |~ ".*OOM-killed.*" [5m])) by (hostname) > 1
            for: 1s
            labels:
                severity: info
            annotations:
                summary: Test Loki OOM Killer Alert
Deploy it:
[simterm]
$ kk apply -f rule-cm.yaml
configmap/rules-alerts created
[/simterm]
Ruler, and a ConfigMap volume
Next, we need to connect this ConfigMap to ruler‘s directory specified in the Loki’s config for the ruler component:
...
    ruler:
      storage:
        local:
          directory: /var/loki/rules
...
Our Ruler works in the loki-read pods – open their StatefulSet:
[simterm]
$ kk -n monitoring edit sts loki-read
[/simterm]
Describe a new volume:
...
      volumes:
      - configMap:
          defaultMode: 420
          name: rules-alerts
        name: rules
...
And its mapping to the Pod as /var/loki/rules/fake/rules.yaml, where the fake is a tenant_id, if used:
...
        volumeMounts:
        - mountPath: /etc/loki/config
          name: config
        - mountPath: /tmp
          name: tmp
        - mountPath: /var/loki
          name: data
        - mountPath: /var/loki/rules/fake/rules.yaml
          name: rules
          subPath: rules.yaml
...
In the subPath specify the key from the ConfigMap to mount ConfigMap’s content as a file.
Ruler alerting settings
Find the Alertmanager URL:
[simterm]
$ kk -n monitoring get svc
NAME                                             TYPE        CLUSTER-IP       EXTERNAL-IP   PORT(S)                      AGE
...
prometheus-kube-prometheus-alertmanager          ClusterIP   172.20.240.159   <none>        9093/TCP                     110d
...
[/simterm]
In the Loki’s ConfigMap for the ruler specify its address:
...
    ruler:
      storage:
        local:
          directory: /var/loki/rules
        type: local
      alertmanager_url: http://prometheus-kube-prometheus-alertmanager:9093
...
All options for ruler here>>> .
Open access to the Alertmanager to check alerts:
[simterm]
$ kk -n monitoring port-forward svc/prometheus-kube-prometheus-alertmanager 9093:9093
[/simterm]
Restart the loki-read Pods, which can be simply done through kubectl delete pod, and check their logs:
[simterm]
$ kk -n monitoring  logs -f loki-read-0
...
level=info ts=2022-12-13T16:37:33.837173256Z caller=metrics.go:133 component=ruler org_id=fake latency=fast query="(sum by(hostname)(rate({hostname=\"eks-node-dev_data_services-i-081719890438d467f\"} |~ \".*OOM-killed.*\"[5m])) > 1)" query_type=metric range_type=instant length=0s step=0s duration=120.505858ms status=200 limit=0 returned_lines=0 throughput=48MB total_bytes=5.8MB total_entries=1 queue_time=0s subqueries=1
...
[/simterm]
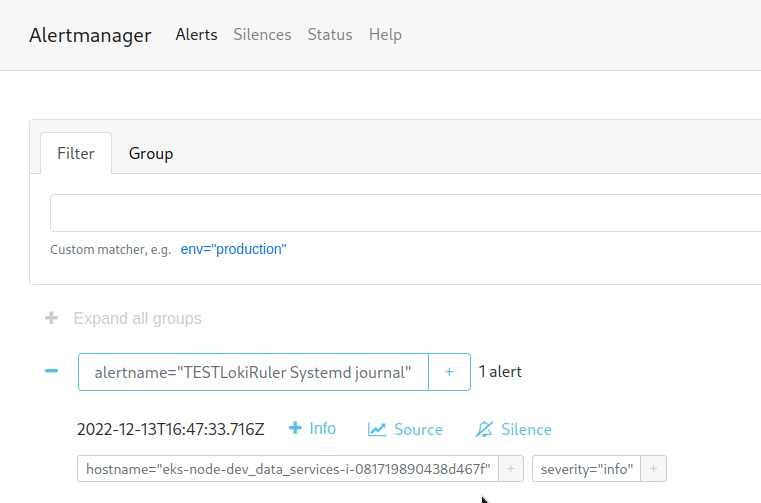
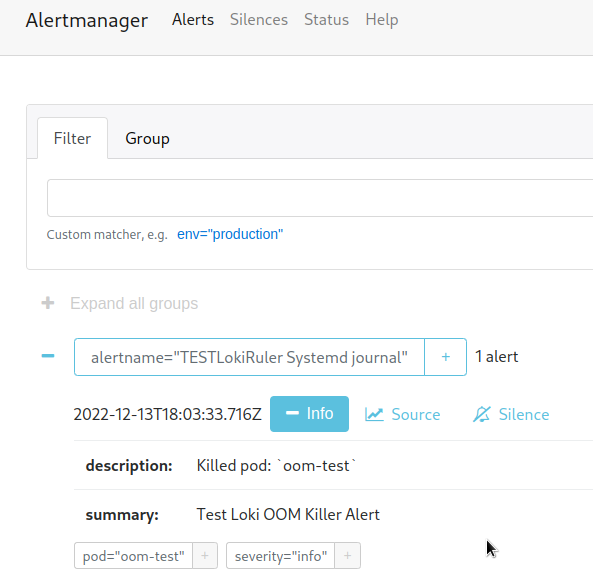
Check Alerts in the Alertmanager – http://localhost:9093:
Loki, and additional labels
In the alerts, I would like to display a little more information than just the message “Test Loki OOM Killer Alert”, for example, to display a name of the Pod that was killed.
Adding labels by Promtail
The first option is to create new labels at the stage of log collection, in the Promtail itself through the pipeline_stages, see Grafana: Loki – Prometheus-like counters and aggregation functions in LogQL and graphs of DNS requests to dnsmasq, for example:
- job_name: journal
  pipeline_stages:
  - match:
      selector: '{job="systemd-journal"}'
      stages:
      - regex:
          expression: '.*level=(?P<level>[a-zA-Z]+).*'
      - labels:
          level:
      - regex:
          expression: '.*source="(?P<source>[a-zA-Z]+)".*'
      - labels:
          source:
  journal:
    labels:
      job: systemd-journal
    max_age: 12h
    path: /var/log/journal
  relabel_configs:
  - source_labels:
    - __journal__systemd_unit
    target_label: unit
  - source_labels:
    - __journal__hostname
    target_label: hostname
Here for tests, I’ve created new labels that were connected to the logs – source and level.
Another option with Promtail is using static_labels.
But there is a big problem here: since Loki creates a separate log stream for each set of labels, for which separate indexes and data chunks are created, then as a result we will get, firstly, problems with performance, and secondly, with costs, because for each index and data block read-write requests will be performed in the shared store, in our case it is AWS S3, where you have to pay money for each request.
See a great post on this topic here – Grafana Loki and what can go wrong with label cardinality .
Adding labels from queries in Loki
Instead, we can create new labels directly from the request using Loki’s LogQL.
Let’s take an entry from the log, which tells about the OOM Killer:
E1213 16:52:25.879626 3382 pod_workers.go:951] “Error syncing pod, skipping” err=”failed to \”CreatePodSandbox\” for \”oom-test_default(f02523a9-43a7-4370-85dd-1da7554496e6)\” with CreatePodSandboxError: \”Failed to create sandbox for pod \\\”oom-test_default(f02523a9-43a7-4370-85dd-1da7554496e6)\\\”: rpc error: code = Unknown desc = failed to start sandbox container for pod \\\”oom-test\\\”: Error response from daemon: failed to create shim task: OCI runtime create failed: runc create failed: unable to start container process: container init was OOM-killed (memory limit too low?): unknown\”” pod=”default/oom-test” podUID=f02523a9-43a7-4370-85dd-1da7554496e6
Here we have a field pod with the name of the Pod that was killed – pod="default/oom-test".
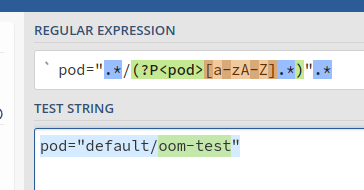
We can use a regex in the form pod=".*/(?P<pod>[a-zA-Z].*)".* to create a Named Capturing Group, check for example on the https://regex101.com website:
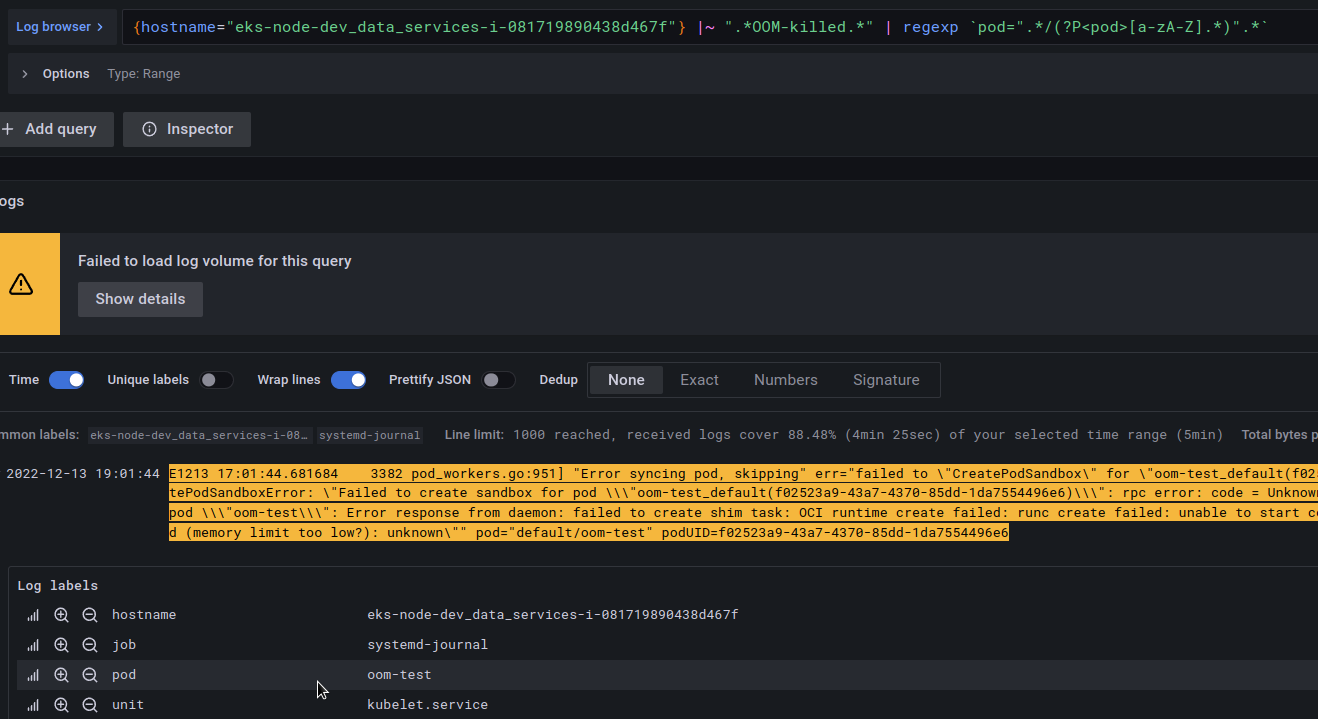
Update the query in Loki:
{hostname="eks-node-dev_data_services-i-081719890438d467f"} |~ ".*OOM-killed.*" | regexp `pod=".*/(?P<pod>[a-zA-Z].*)".*`
And as a result, we get a label named pod with the value “oom-test“:
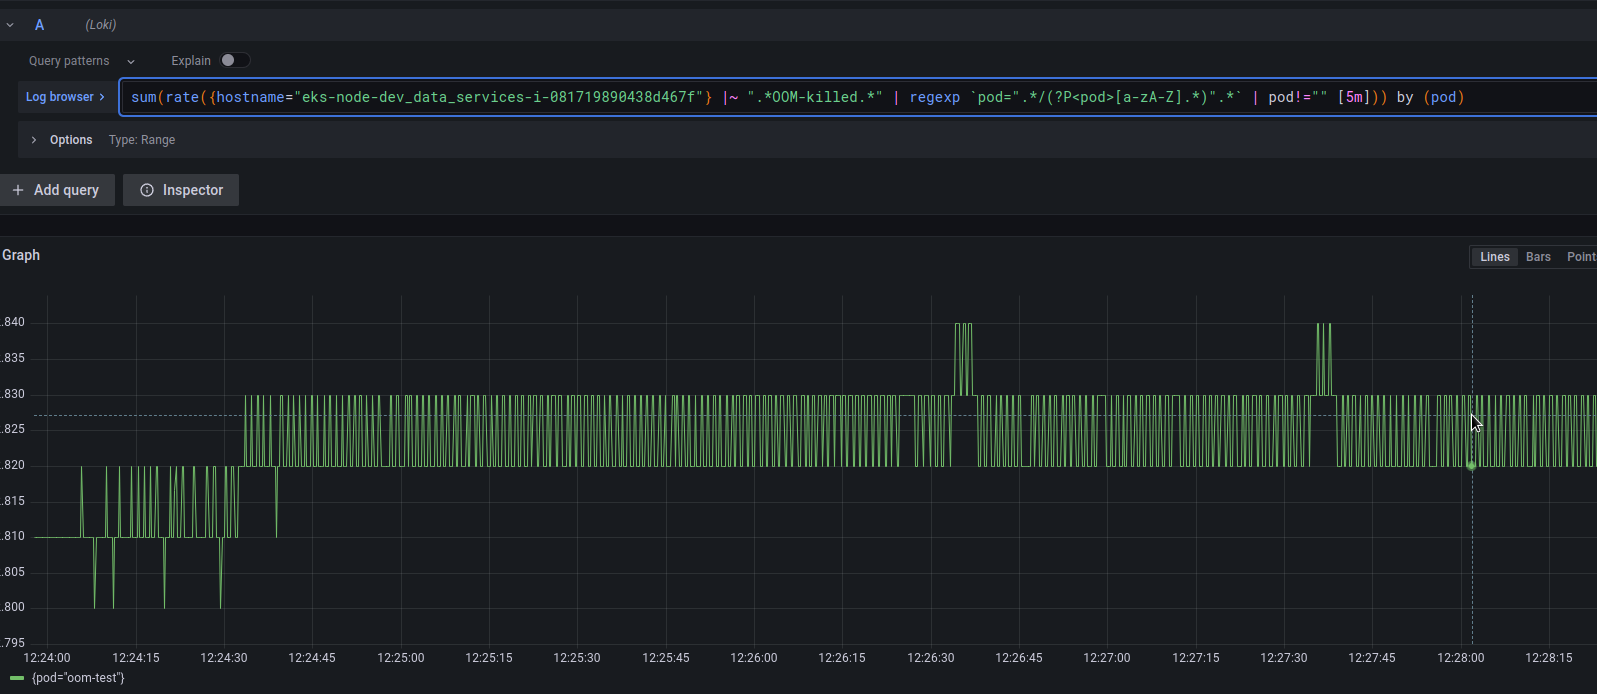
Check the alert request with the sum() and rate():
sum(rate({hostname="eks-node-dev_data_services-i-081719890438d467f"} |~ ".*OOM-killed.*" | regexp `pod=".*/(?P<pod>[a-zA-Z].*)".*` | pod!="" [5m])) by (pod)
And the result is:
Update the alert – add description with the use of the {{ $labels.pod }} format:
- alert: TESTLokiRuler Systemd journal
  expr: |
    sum(rate({hostname="eks-node-dev_data_services-i-081719890438d467f"} |~ ".*OOM-killed.*" | regexp `.*pod=".*/(?P<pod>[a-zA-Z].*)".*` | pod!="" [15m])) by (pod) > 1
  for: 1s
  labels:
      severity: info
  annotations:
      summary: Test Loki OOM Killer Alert
      description: "Killed pod: `{{ $labels.pod }}`"
Wait for it to fire:
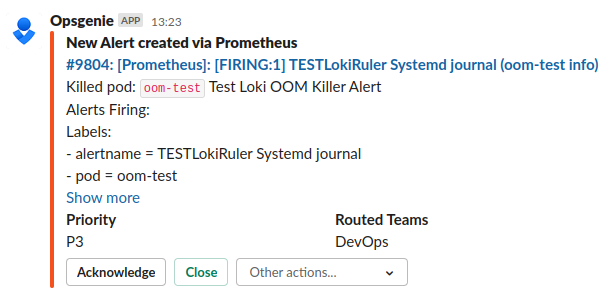
And in a Slack:
Grafana Loki, and 502/504 errors
Can’t reproduce it now, but sometimes Grafana can’t wait for a response from Loki to execute a request and crashes with 502 or 504 errors.
There is a thread in Girthub, for me increasing HTTP timeouts in Loki ConfigMap helped:
...
server:
  http_server_read_timeout: 600s
  http_server_write_timeout: 600s
...
Done.
Useful links
- How to Setup Alerting With Loki
- Loki 2.0 released: Transform logs as you’re querying them, and set up alerts within Loki
- Labels from Logs
- The concise guide to labels in Loki
- How labels in Loki can make log queries faster and easier
- Grafana Loki and what can go wrong with label cardinality
- How to use LogQL range aggregations in Loki
![]()
