Traffic in AWS is generally quite an interesting and sometimes complicated thing, I once wrote about it in the AWS: Cost optimization – services expenses overview and traffic costs in AWS. Now, it’s time to return to this topic again.
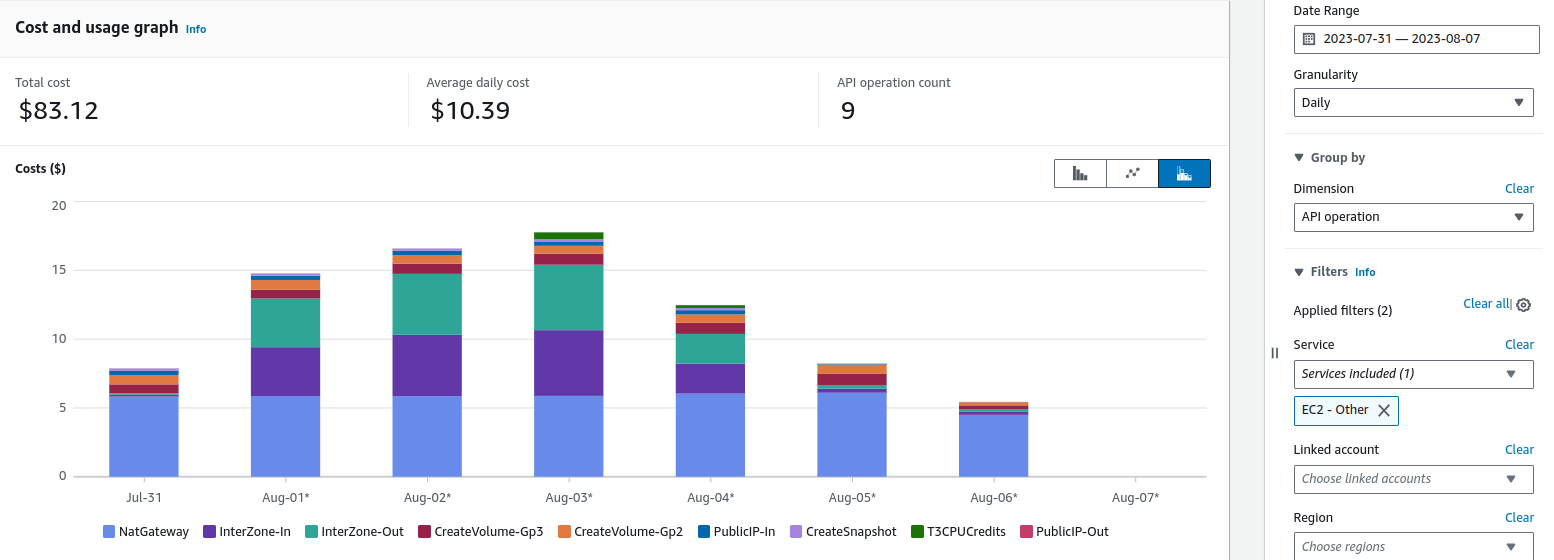
So, what’s the problem: in AWS Cost Explorer, I’ve noticed that we have an increase in EC2-Other costs for several days in a row:
And what is included in our EC2-Other? All Load Balancers, IP, EBS, and traffic, see Tips and Tricks for Exploring your Data in AWS Cost Explorer.
To check what exactly the expenses have increased – switch Dimension to the Usage Type and select EC2-Other in the Service:
Here, we can see that the expenses have grown on the DataTransfer-Regional-Bytes, that is “This is Amazon EC2 traffic that moves between AZs but stays within the same region“, as said in the Understand AWS Data transfer details in depth from cost and usage report using Athena query and QuickSight, and Understanding data transfer charges.
We can switch to the API Operation, and check exactly what kind of traffic was used:
InterZone-In and InterZone-Out.
In the past week, I started monitoring with VictoriaMetrics: deploying a Kubernetes monitoring stack , configured logs collection from CloudWatch Logs using promtail-lambda, and added alerts with Loki Ruler – apparently it affected the traffic. Let’s figure it out.
Contents
VPC Flow Logs
What we need is to add Flow Logs for the VPC of our Kubernetes cluster. Then we will see which Kubernetes Pods or Lambda functions in AWS began to actively “eat” traffic. For more details, see the AWS: VPC Flow Logs – an overview and example with CloudWatch Logs Insights post.
So, we can create a CloudWatch Log Group with custom fields to have pkt_srcaddr and pkt_dstaddr fields, which contain IPs of Kubernetes Pods, see Using VPC Flow Logs to capture and query EKS network communications.
In the Log Group, configure the following fields:
region vpc-id az-id subnet-id instance-id interface-id flow-direction srcaddr dstaddr srcport dstport pkt-srcaddr pkt-dstaddr pkt-src-aws-service pkt-dst-aws-service traffic-path packets bytes action
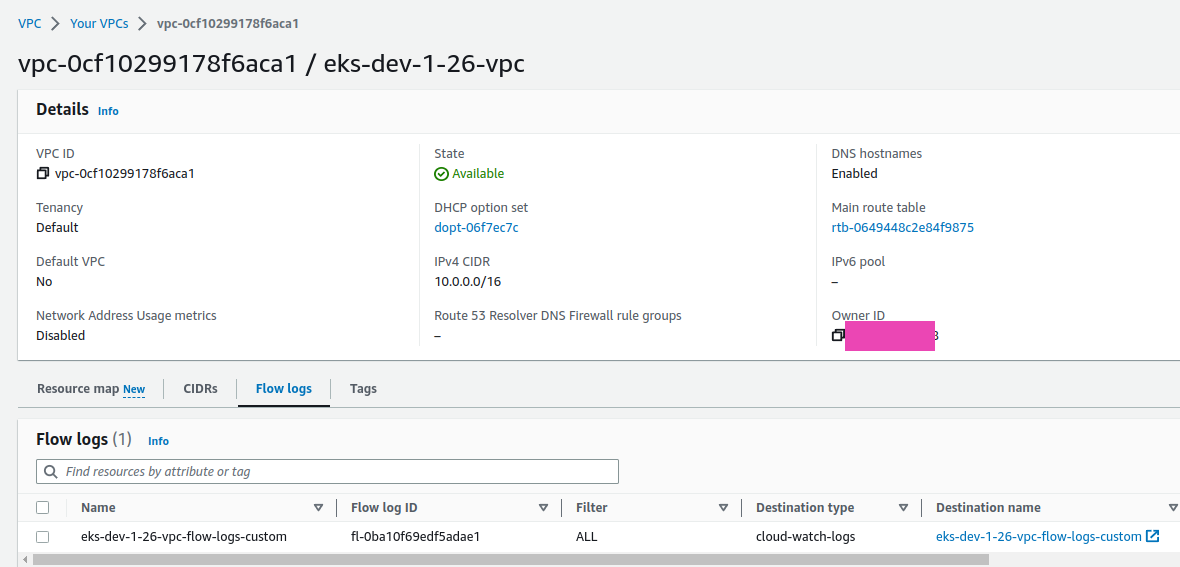
Next, configure Flow Logs for the VPC of our cluster:
And let’s go check the logs.
CloudWatch Logs Insigts
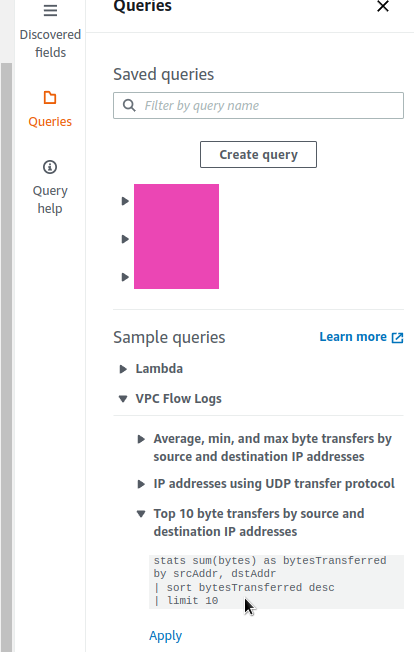
Let’s take a request from examples:
And rewrite it according to our format:
parse @message "* * * * * * * * * * * * * * * * * * *"
| as region, vpc_id, az_id, subnet_id, instance_id, interface_id,
| flow_direction, srcaddr, dstaddr, srcport, dstport,
| pkt_srcaddr, pkt_dstaddr, pkt_src_aws_service, pkt_dst_aws_service,
| traffic_path, packets, bytes, action
| stats sum(bytes) as bytesTransferred by pkt_srcaddr, pkt_dstaddr
| sort bytesTransferred desc
| limit 10
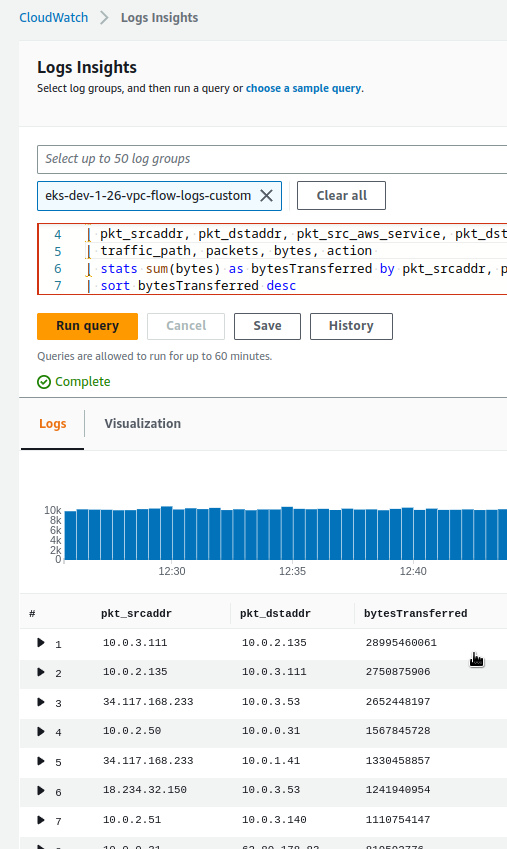
With that, we are getting an interesting picture:
Where in the top with a large margin we see two addresses – 10.0.3.111 and 10.0.2.135, which caught up to 28995460061 bytes of traffic.
Loki components and traffic
Check what kind of Pods these are in our Kubernetes, and find their corresponding WorkerNodes/EC2.
First 10.0.3.111:
[simterm]
$ kk -n dev-monitoring-ns get pod -o wide | grep 10.0.3.111
loki-backend-0                                                    1/1     Running   0          22h   10.0.3.111   ip-10-0-3-53.ec2.internal    <none>           <none>
[/simterm]
And 10.0.2.135:
[simterm]
$ kk -n dev-monitoring-ns get pod -o wide | grep 10.0.2.135
loki-read-748fdb976d-grflm                                        1/1     Running   0          22h   10.0.2.135   ip-10-0-2-173.ec2.internal   <none>           <none>
[/simterm]
And here I recalled, that on July 31 I turned on alerts in Loki, which are processed in Loki’s backend Pod, where the Ruler component is running (earlier, it leaving in the read Pods).
That is, the biggest part of the traffic occurs precisely between the Read and Backend pods.
It is a good question what is transmitted there in such a quantity, but for now, we need to solve the problem of traffic costs.
Let’s check in which AvailabilityZones the Kubernetes WorkerNodes are located.
The ip-10-0-3-53.ec2.internal instance, where the Backend pod is running:
[simterm]
$ kk get node ip-10-0-3-53.ec2.internal -o json | jq -r '.metadata.labels["topology.kubernetes.io/zone"]'
us-east-1b
[/simterm]
And ip-10-0-2-173.ec2.internal, where the Read Pod is located:
[simterm]
$ kk get node ip-10-0-2-173.ec2.internal -o json | jq -r '.metadata.labels["topology.kubernetes.io/zone"]'
us-east-1a
[/simterm]
us-east-1b and us-east-1a – here we have our cross-AvailabilityZones traffic from the Cost Explorer.
Kubernetes podAffinity and nodeAffinity
What we can try is to add Affinity for the pods to run in the same AvailabilityZone. See Assigning Pods to Nodes and Kubernetes Multi-AZ deployments Using Pod Anti-Affinity.
For Pods in the Helm chart, we already have affinity:
...
  affinity: |
    podAntiAffinity:
      requiredDuringSchedulingIgnoredDuringExecution:
        - labelSelector:
            matchLabels:
              {{- include "loki.readSelectorLabels" . | nindent 10 }}
          topologyKey: kubernetes.io/hostname
...
The first option is to tell the Kubernetes Scheduler that we want the Read Pods to be located on the same WorkerNode where the Backend Pods are. For this, we can use the podAffinity.
[simterm]
$ kk -n dev-monitoring-ns get pod loki-backend-0 --show-labels
NAME             READY   STATUS    RESTARTS   AGE   LABELS
loki-backend-0   1/1     Running   0          23h   app.kubernetes.io/component=backend,app.kubernetes.io/instance=atlas-victoriametrics,app.kubernetes.io/name=loki,app.kubernetes.io/part-of=memberlist,controller-revision-hash=loki-backend-8554f5f9f4,statefulset.kubernetes.io/pod-name=loki-backend-0
[/simterm]
So for the Reader, we can specify podAntiAffinity with labelSelector=app.kubernetes.io/component=backend – then the Reader will “reach” for the same AvailabilityZone where the Backend is running.
Another option is to specify a label with the desired AvailabilityZone through nodeAffinity, and in Expressions for both Read and Backend.
Let’s try with preferredDuringSchedulingIgnoredDuringExecution, i.e. the “soft limit”:
...
  read:
    replicas: 2
    affinity: |
      nodeAffinity:
        preferredDuringSchedulingIgnoredDuringExecution:
        - weight: 1
          preference:
            matchExpressions:
            - key: topology.kubernetes.io/zone
              operator: In
              values:
              - us-east-1a
  ...
  backend:
    replicas: 1
    affinity: |
      nodeAffinity:
        preferredDuringSchedulingIgnoredDuringExecution:
        - weight: 1
          preference:
            matchExpressions:
            - key: topology.kubernetes.io/zone
              operator: In
              values:
              - us-east-1a
...
Deploy, check Read Pods:
[simterm]
$ kk -n dev-monitoring-ns get pod -l app.kubernetes.io/component=read -o wide
NAME                        READY   STATUS    RESTARTS   AGE   IP           NODE                         NOMINATED NODE   READINESS GATES
loki-read-d699d885c-cztj7   1/1     Running   0          50s   10.0.2.181   ip-10-0-2-220.ec2.internal   <none>           <none>
loki-read-d699d885c-h9hpq   0/1     Running   0          20s   10.0.2.212   ip-10-0-2-173.ec2.internal   <none>           <none>
[/simterm]
And instances zone:
[simterm]
$ kk get node ip-10-0-2-220.ec2.internal -o json | jq -r '.metadata.labels["topology.kubernetes.io/zone"]'
us-east-1a

$ kk get node ip-10-0-2-173.ec2.internal -o json | jq -r '.metadata.labels["topology.kubernetes.io/zone"]'
us-east-1a
[/simterm]
Okay, everything is good here, but what about the Backend?
[simterm]
$ kk get nod-n dev-monitoring-ns get pod -l app.kubernetes.io/component=backend -o wide
NAME             READY   STATUS    RESTARTS   AGE   IP           NODE                        NOMINATED NODE   READINESS GATES
loki-backend-0   1/1     Running   0          75s   10.0.3.254   ip-10-0-3-53.ec2.internal   <none>           <none>
[/simterm]
And its Node:
[simterm]
$ kk -n dev-get node ip-10-0-3-53.ec2.internal -o json | jq -r '.metadata.labels["topology.ebs.csi.aws.com/zone"]'
us-east-1b
[/simterm]
But why in the 1b, when we set 1a? Let’s check its StatefulSet if our affinity has been added:
[simterm]
$ kk -n dev-monitoring-ns get sts loki-backend -o yaml
apiVersion: apps/v1
kind: StatefulSet
...
    spec:
      affinity:
        nodeAffinity:
          preferredDuringSchedulingIgnoredDuringExecution:
          - preference:
              matchExpressions:
              - key: topology.kubernetes.io/zone
                operator: In
                values:
                - us-east-1a
            weight: 1
...
[/simterm]
Everything is there.
OK – let’s use the “hard limit”, that is the requiredDuringSchedulingIgnoredDuringExecution:
...
  backend:
    replicas: 1
    affinity: |
      nodeAffinity:
        requiredDuringSchedulingIgnoredDuringExecution:
          nodeSelectorTerms:
          - matchExpressions:
            - key: topology.kubernetes.io/zone
              operator: In
              values:
              - us-east-1a
...
Deploy again, and now the Pod with the Backend is stuck in Pending status:
[simterm]
$ kk -n dev-monitoring-ns get pod -l app.kubernetes.io/component=backend -o wide
NAME             READY   STATUS    RESTARTS   AGE     IP       NODE     NOMINATED NODE   READINESS GATES
loki-backend-0   0/1     Pending   0          3m39s   <none>   <none>   <none>           <none>
[/simterm]
Why? Let’s check its Events:
[simterm]
$ kk -n dev-monitoring-ns describe pod loki-backend-0
...
Events:
  Type     Reason            Age   From               Message
  ----     ------            ----  ----               -------
  Warning  FailedScheduling  34s   default-scheduler  0/3 nodes are available: 1 node(s) didn't match Pod's node affinity/selector, 2 node(s) had volume node affinity conflict. preemption: 0/3 nodes are available: 3 Preemption is not helpful for scheduling..
[/simterm]
At first, I thought that there is already a maximum of Pods on WorkerNode – 17 on the t3.medium AWS EC2 instances.
Let’s check:
[simterm]
$ kubectl -n dev-monitoring-ns get pods -A -o jsonpath='{range .items[?(@.spec.nodeName)]}{.spec.nodeName}{"\n"}{end}' | sort | uniq -c | sort -rn
     16 ip-10-0-2-220.ec2.internal
     14 ip-10-0-2-173.ec2.internal
     13 ip-10-0-3-53.ec2.internal
[/simterm]
But no, there are still places.
So what? Maybe EBS? A common problem is when EBS is in one AvailabilityZone, and a Pod is running in another.
Find the Volume of the Backend – it is connected for alert rulers for the Ruler:
[simterm]
...
Volumes:
  ...
  data:
    Type:       PersistentVolumeClaim (a reference to a PersistentVolumeClaim in the same namespace)
    ClaimName:  data-loki-backend-0
    ReadOnly:   false
...
[/simterm]
Find the corresponding Persistent Volume:
[simterm]
$ kubectl k -n dev-monitoring-ns get pvc data-loki-backend-0
NAME                  STATUS   VOLUME                                     CAPACITY   ACCESS MODES   STORAGECLASS   AGE
data-loki-backend-0   Bound    pvc-b62bee0b-995e-486b-9f97-f2508f07a591   10Gi       RWO            gp2            15d
[/simterm]
And the AvailabilityZone of this EBS:
[simterm]
$ kk -n dev-monitoring-ns get pv pvc-b62bee0b-995e-486b-9f97-f2508f07a591 -o json | jq -r '.metadata.labels["topology.kubernetes.io/zone"]'
us-east-1b
[/simterm]
And indeed, we have a disk in the us-east-1b zone, while we are trying to launch the Pod in the us-east-1a.
What we can do here, is either run Readers in zone 1b, or delete the PVC for the Backend, and then during deployment it will create a new PV and EBS in zone 1a.
Since there is no data in the volume and rules for Ruler are created from a ConfigMap, it is easier to just delete the PVC:
[simterm]
$ kubectl k -n dev-monitoring-ns delete pvc data-loki-backend-0
persistentvolumeclaim "data-loki-backend-0" deleted
[/simterm]
Delete the pod so that it is recreated:
[simterm]
$ kk -n dev-monitoring-ns delete pod loki-backend-0
pod "loki-backend-0" deleted
[/simterm]
Check that the PVC is created:
[simterm]
$ kk -n dev-monitoring-ns get pvc data-loki-backend-0
NAME                  STATUS   VOLUME                                     CAPACITY   ACCESS MODES   STORAGECLASS   AGE
data-loki-backend-0   Bound    pvc-5b690c18-ba63-44fd-9626-8221e1750c98   10Gi       RWO            gp2            14s
[/simterm]
And its location now:
[simterm]
$ kk -n dek -n dev-monitoring-ns get pv pvc-5b690c18-ba63-44fd-9626-8221e1750c98 -o json | jq -r '.metadata.labels["topology.kubernetes.io/zone"]'
us-east-1a
[/simterm]
And the Pod also started:
[simterm]
$ kk -n dev-monitoring-ns get pod loki-backend-0
NAME             READY   STATUS    RESTARTS   AGE
loki-backend-0   1/1     Running   0          2m11s
[/simterm]
Traffic optimization results
I did it on Friday, and for Monday we have the following result:
Everything turned out as planned: the Cross AvailabilityZone traffic is now almost zero.
![]()
