Collecting logs in Grafana Loki with Kubernetes is very simple – we just launch Promtail in DaemonSet, configure it to read all data from /var/logs – and that’s it (in fact, we don’t specify anything at all – everything works out of the box from the Helm chart).
But what about CloudWatch Logs? On my new project, we have a bunch of AWS Lambdas, API Gateways, etc., and they all write logs to CloudWatch.
As for Lambda, it would be possible to use the Lambda Telemetry API and write logs from a function directly to Loki, see Building an AWS Lambda Telemetry API extension for direct logging to Grafana Loki, and maybe later we will also use this approach, but now we already have a bunch of logs from other services in CloudWatch, and we still need to read them.
There is still an option to install CloudWatch as a data source in Grafana, and simply use the logs from the Grafana interface, and probably even have Grafana alerts from these logs, but sooner or later Kubernetes or simply EC2 instances will appear, and it will be necessary to collect logs from them, so I’d like immediately do everything with Loki, especially since it has excellent LogQL, and is much more flexibility in creating labels and alerts.
In this case, we can use Lambda Promtail from Grafana itself, and it will work as follows:
- some Lambda function (for example) writes a log to the CloudWatch Log Group
- in the Log Group, we will have a Subscription filter, which will send logs to another Lambda function – Lambda Promtail itself
- and Lambda Promtail will forward them to the Loki instance
So, today we will create a test Lambda function that will write logs, and we will start a Lambda Promtail that will send logs to Grafana Loki, which is already present.
What you need to pay attention to is the amount of data that will be written, because as always with AWS, it is quite easy to run into money, so it is good to have AWS Budgets configured to receive an alert in case of unexpected expenses.
Also, keep in mind that Loki will need to be exposed on port 3100, so it’s best to have Lambda Promtail in the same VPC running Grafana itself and/or have some sort of NGINX with HTTP authentication.
Contents
Testing Lambda for creating logs
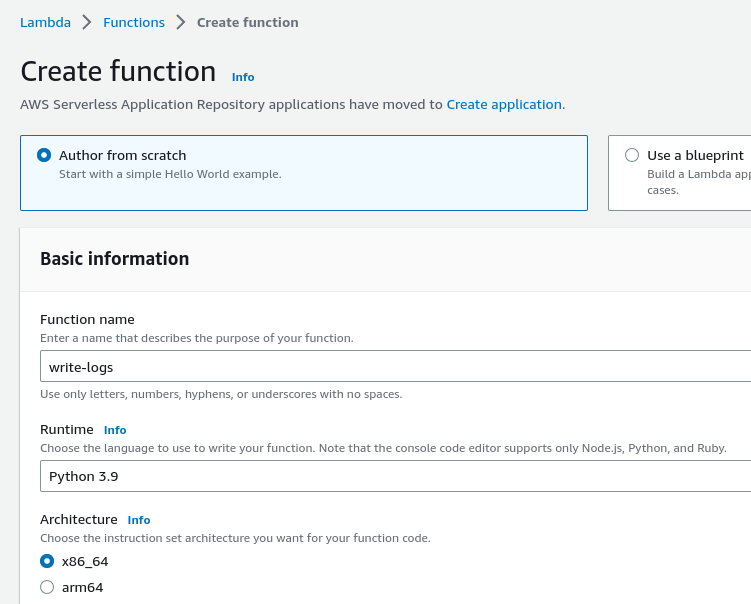
Let’s create a function, let it be in Python:
In the code of the function, we will add several print() to create records in its log:
import json
import os

def lambda_handler(event, context):
    return {
        'statusCode': 200,
        'body': json.dumps('Hello from Lambda!')
    }
    print('## ENVIRONMENT VARIABLES')
    print(os.environ['AWS_LAMBDA_LOG_GROUP_NAME'])
    print(os.environ['AWS_LAMBDA_LOG_STREAM_NAME'])
    print('## EVENT')
    print(event)
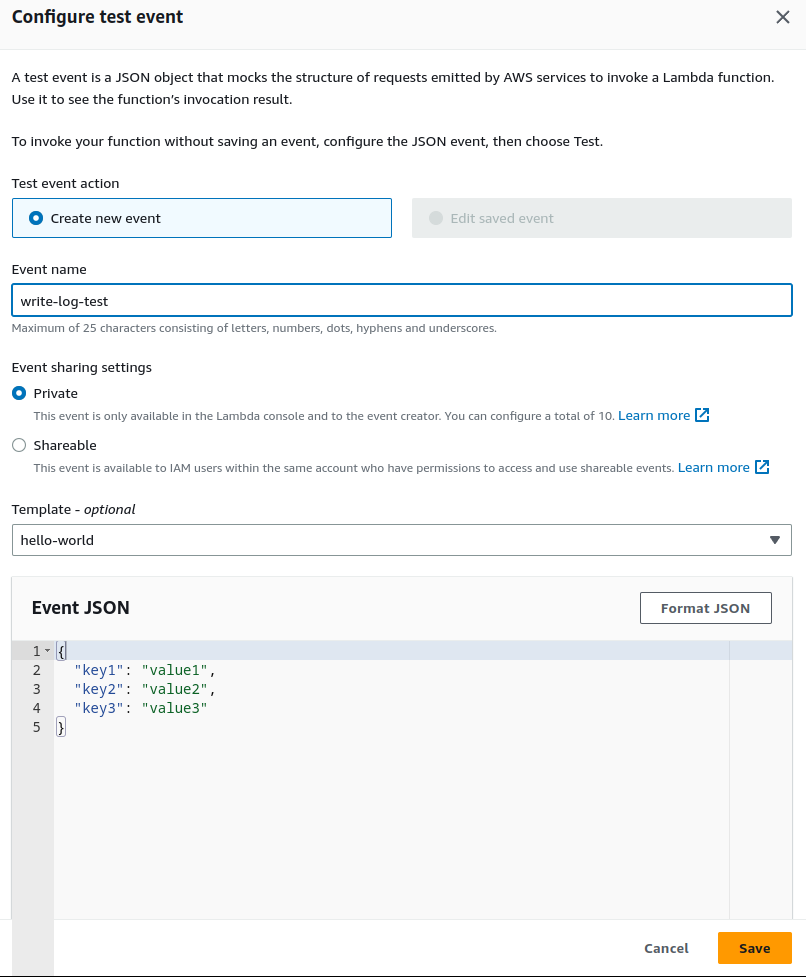
Press Test to create a test event, the data in the Event JSON field is not important now, we just specify the name of the event and save it:
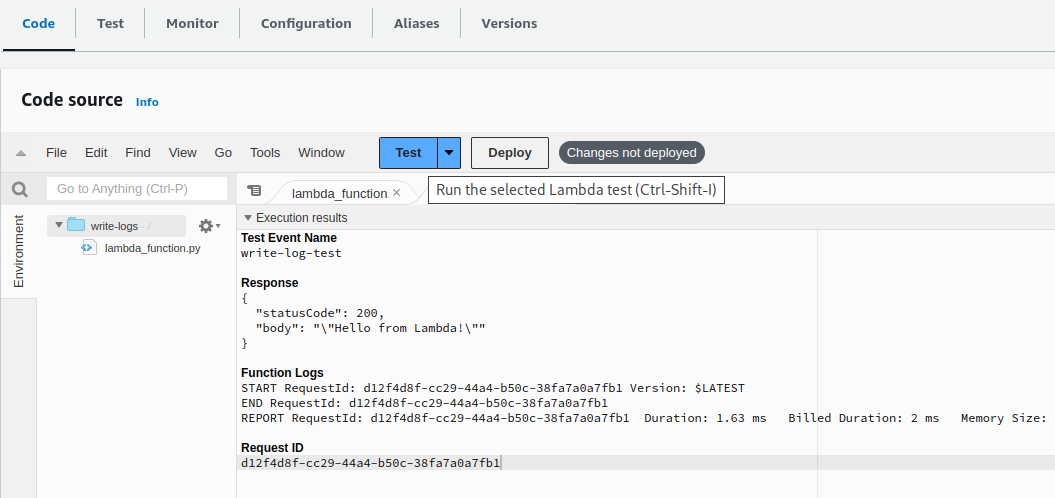
Press Test again – the function has been executed, and the Function Logs have appeared:
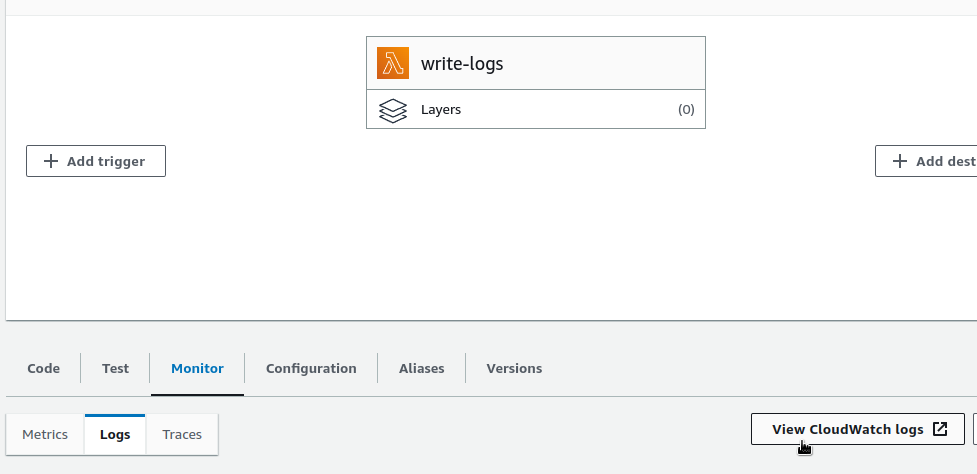
Go to Monitor > Logs, and from there to the CloudWatch Logs:
And check that there are Log events:
That’s all here, now we can move on to Lambda Promtail.
Running Lambda Promtail
There is a ready-to-use Terraform project and even a Cloudformation template, so you can use them. The only thing is that in Terraform it is necessary to fix the creation resource "aws_iam_role_policy_attachment" "lambda_sqs_execution" in the file sqs.tf, because the role is called there role = aws_iam_role.iam_for_lambda.name, but in the main.tf it is called resource "aws_iam_role" "this".
In everything else, Terraform works – we just set values for the variables in variabels.tf – the write_address, log_group_names, and lambda_promtail_image, and you can create resources.
However, I still prefer to create everything manually for the first time in order to understand better what and how it will work.
Docker image and Elastic Container Service
First, we will prepare a Docker image, because for some reason it is impossible to run AWS Lambda from the public Grafana ECR, although I did not find such a limitation anywhere in the documentation.
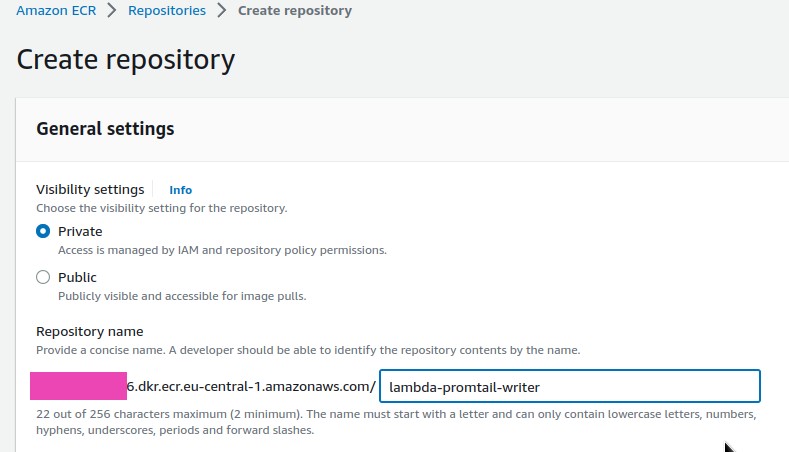
Go to ECR, and create a repository:
Download the public image from Grafana:
[simterm]
$ docker pull public.ecr.aws/grafana/lambda-promtail:main
[/simterm]
Re-tag it with your repository:
[simterm]
$ docker tag public.ecr.aws/grafana/lambda-promtail:main 264***286.dkr.ecr.eu-central-1.amazonaws.com/lambda-promtail-writer:latest
[/simterm]
Log in to ECR – specify --profile, if it’s not a default and an AWS Region:
[simterm]
$ aws --profile setevoy ecr get-login-password --region eu-central-1 | docker login --username AWS --password-stdin 264***286.dkr.ecr.eu-central-1.amazonaws.com
...
Login Succeeded
[/simterm]
Push your image there:
[simterm]
$ docker push 264***286.dkr.ecr.eu-central-1.amazonaws.com/lambda-promtail-writer:latest
[/simterm]
Let’s move on to Lambda.
Creating Lambda Promtail function
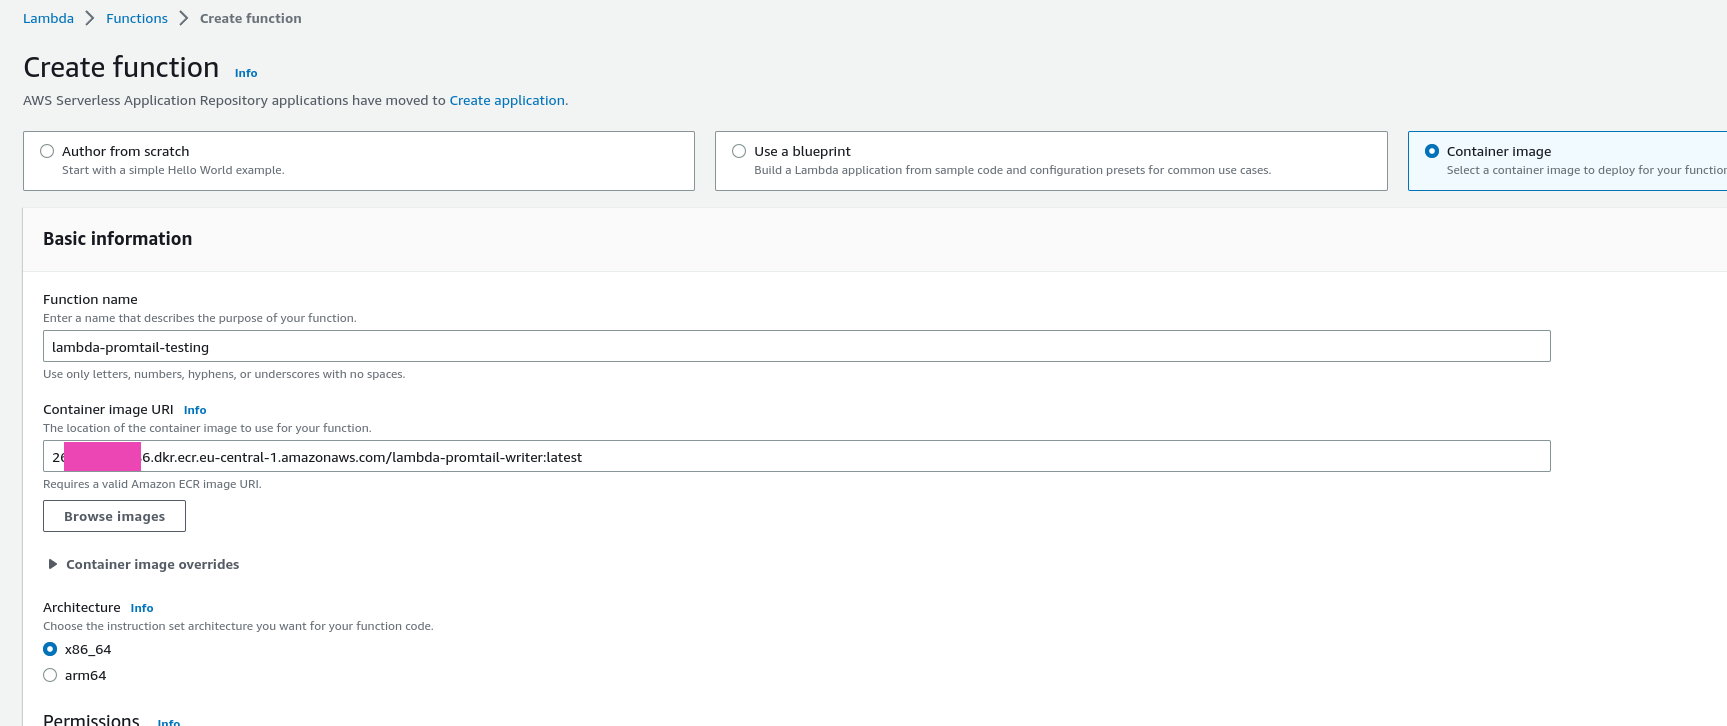
Create a new function, select Container image, and specify the URI of the image that was pushed above:
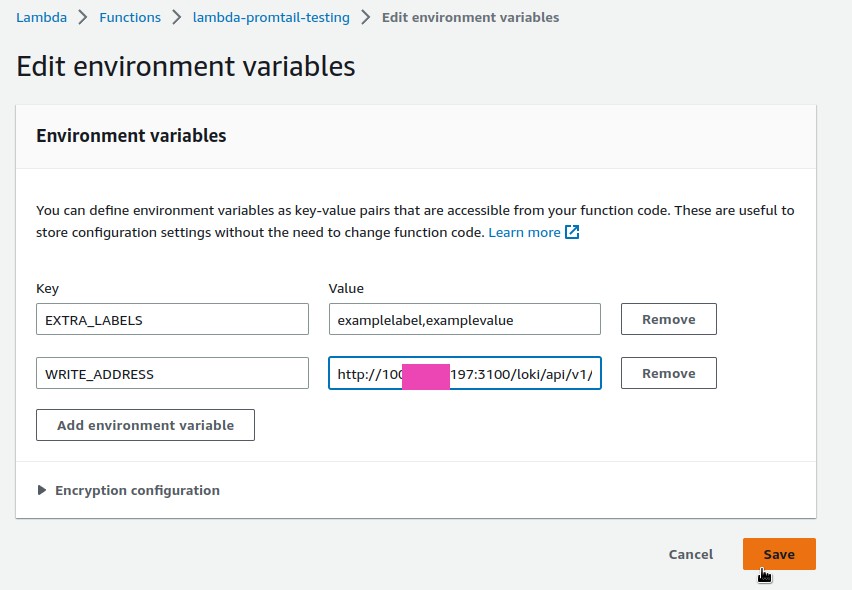
Go to Configuration > Environment variables, and set the minimum required variables:
EXTRA_LABELS: the tags/labels that will be added to Loki, are specified here in the format of labelname,labelvalueWRITE_ADDRESS: the Loki address withhttps://and URI/loki/api/v1/push
CloudWatch Log Group Subscription filters configuration
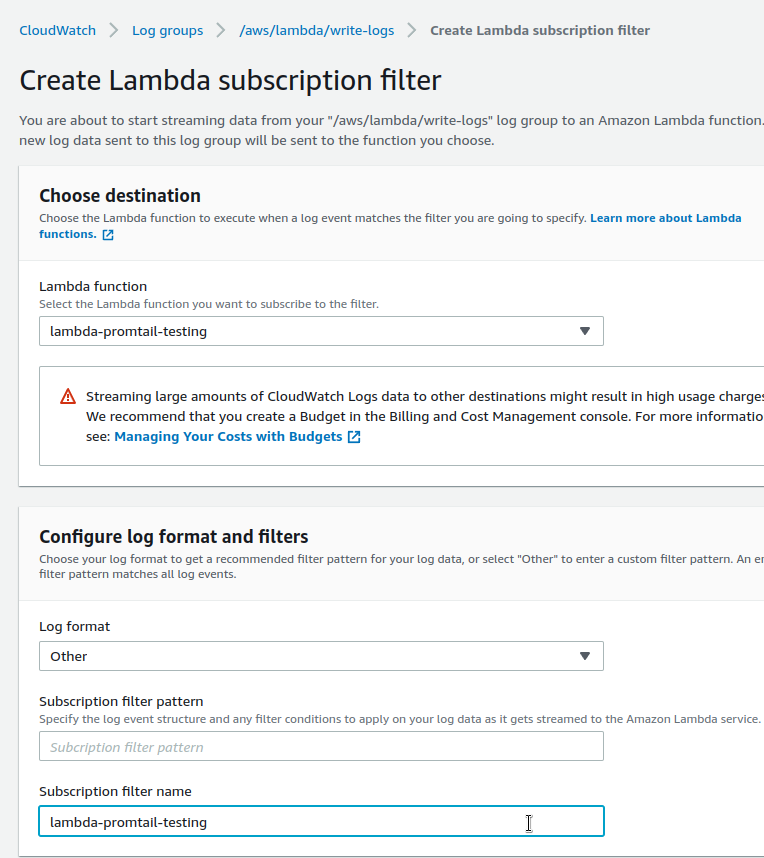
Return to the CloudWatch Log Group, which contained our test logs, and in the Subscription filters tab add a new subscription for the Lambda function (see Using CloudWatch Logs subscription filters or How can I configure a CloudWatch subscription filter to invoke my Lambda function? ):
Choose a function to which we will stream logs, and if necessary, specify a filter in the Configure log format and filters field, which will be used to choose what exactly to send to Lambda, not to send all the records.
At this moment we don’t need it, so we set Other in the Log format and leave the Subscription filter pattern empty.
In the Subscription filter name, specify the name of the filter itself:
Save – press Start streaming, return to the write-logs Lambda and press Test several times to create more records in the CloudWatch Log Group That should trigger the function lambda-promtail-testing and transfer the data it will send to Loki.
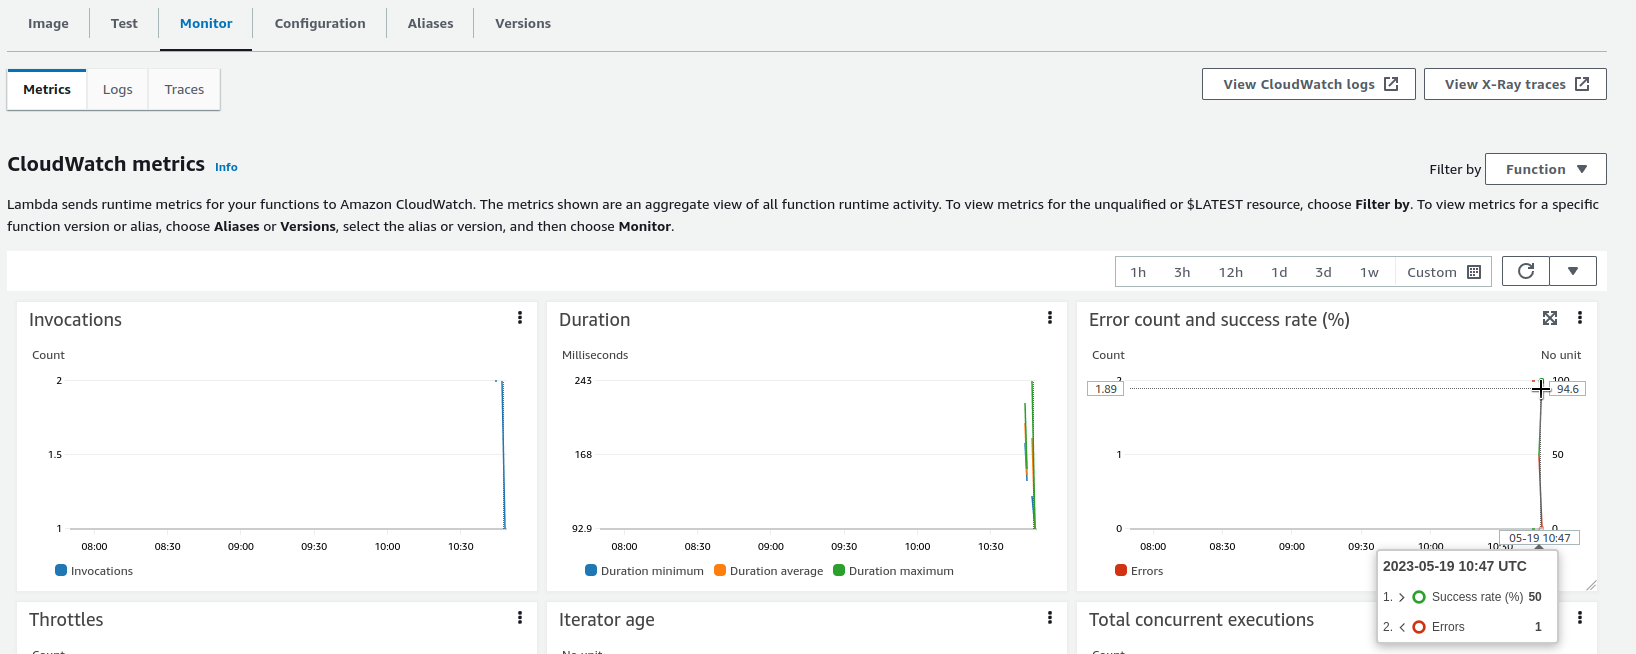
Check the lambda-promtail-testing function – there should be executions in the Monitoring:
In the case of Errors, the Logs tab contains a link to the CloudWatch Log for this function, which will describe the error.
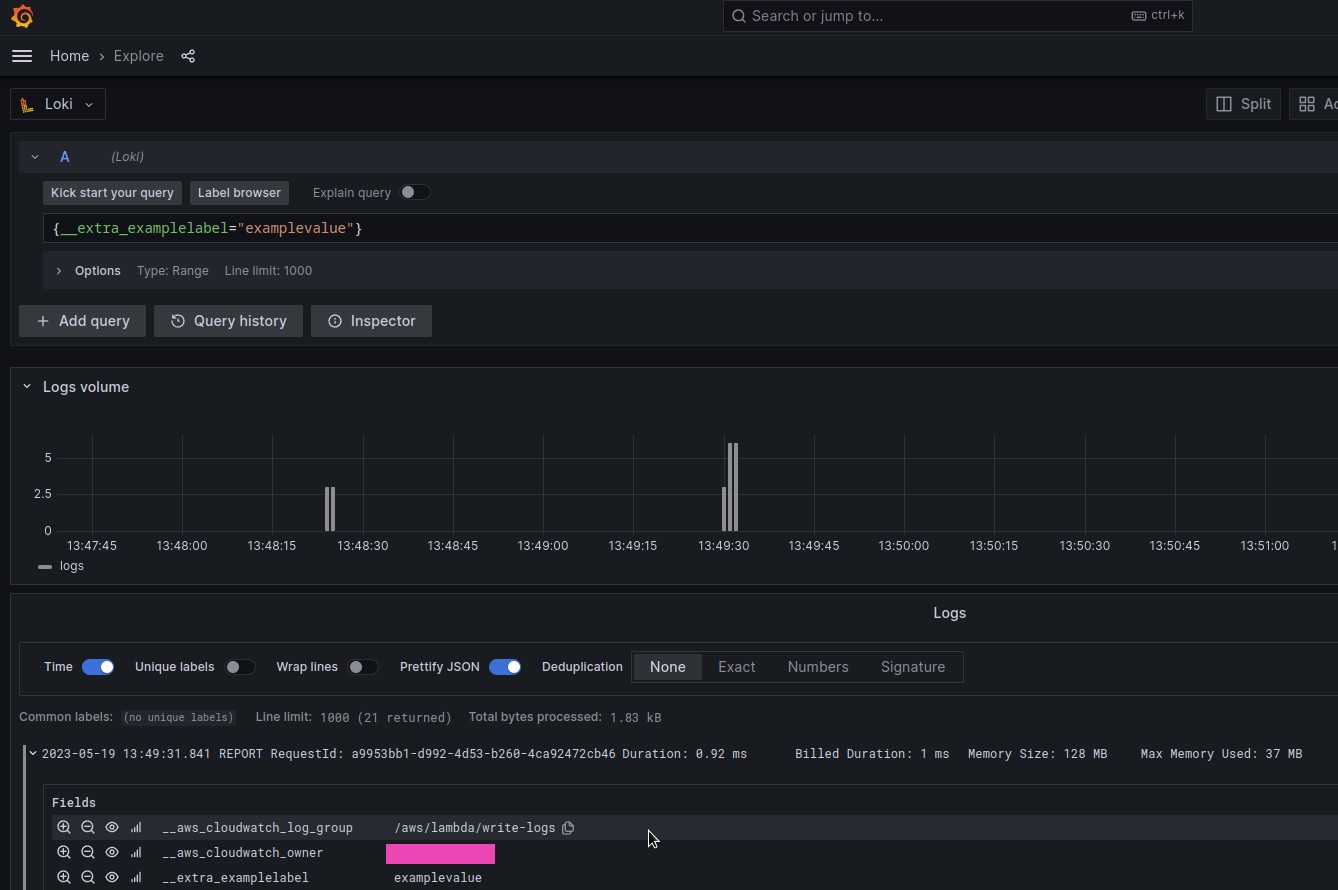
If everything is Success, then we should already see a new label in the Loki, and we can use it to select logs from the function write-logs:
Done.
On the Grafana documentation page, they also write that “Or, have lambda-promtail write to Promtail and use pipeline stages “, but I wasn’t able to find a possibility to write data via gRPC or HTTP in Promtail, although this idea was back in 2020, but it is still in Draft – Promtail Push API.
![]()
