Recently, I got a new interesting task – to build a dashboard in Grafana that would display the status of our development process and its performance, that is, the efficiency of our DevOps processes.
This is necessary because we are trying to build “true continuous deployment” so that the code automatically enters Production, and we need to see exactly how the development process is going.
In general, we came up with 5 metrics to evaluate the effectiveness of the development process:
- Deployment Frequency: how often deployments are performed
- Lead Time for Changes: how long it takes to deliver a feature to Production, i.e. the time between its first commit to a repository and the moment it reaches Production
- PR Lead Time: the time the feature “hangs” in the Pull Request status
- Change Failure Rate: percentage of deployments that caused problems in Production
- Time to Restore Service: time to restore the system in case of its crash
See MKPIS – Measuring the development process for Gitflow managed projects and The 2019 Accelerate State of DevOps: Elite performance, productivity, and scaling.
We decided to start with the metric for PR Lead Time to measure the time from the creation of a Pull Request to its merge in the master branch and display it on the Grafana dashboard.
So, what we will do today: will write our own GitHub Exporter, which will go to the GitHub API, collect necessary data, and create Prometheus metrics, which we will then use in Grafana. See Prometheus: Building a Custom Prometheus Exporter in Python.
To do this, we will use:
- Grafana/Prometheus stack
- Python
- the PyGithub library for working with the GitHub API
- prometheus-client to create your own metrics
Contents
GitHub API and PyGithub
Let’s start with the GitHub API. Documentation – Getting started with the REST API.
GitHub token та аутентифікація
First, we will need a token – see Authenticating to the REST API та Creating a personal access token.
Create and check it:
[simterm]
$ curl -X GET -H "Authorization: token ghp_ys9***ilr" 'https://api.github.com/user'
{
  "login": "arseny***",
  "id": 132904972,
  "node_id": "U_kgDOB-v4DA",
  "avatar_url": "https://avatars.githubusercontent.com/u/132904972?v=4",
  "gravatar_id": "",
  "url": "https://api.github.com/users/arseny***",
...
[/simterm]
Okay, we’ve got the answer, so the token works.
The PyGithub library
Install PyGithub:
[simterm]
$ pip install PyGithub
[/simterm]
Now let’s try to access the GitHub API in a Python code:
#!/usr/bin/env python

from github import Github

access_token = "ghp_ys9***ilr"

# connect to Gihub
github_instance = Github(access_token)
organization_name = 'OrgName'
# read org
organization = github_instance.get_organization(organization_name)
# get repos list
repositories = organization.get_repos()

for repository in repositories:
    print(f"Repository: {repository.full_name.split('/')[1]}")
Here we create github_instance, authenticate with our token, and get information about GitHub Organization and all repositories of this organization.
Run the script:
[simterm]
$ ./test-api.py
Repository: chatbot-automation
Repository: ***-sandbox
Repository: ***-ios
...
[/simterm]
Okay, it works.
Getting information about a Pull Request
Next, let’s try to get information about the pool request, namely, the time of its creation and closing.
Here, in order to simplify and speed up the development of the exporter and its testing, we will use only one repository and we will select closed pool requests only for the last week, and then we will return the loop in which we will go through all repositories and pool requests in them:
...

# get infro about a repository
repository = github_instance.get_repo("OrgName/repo-name")
# get all PRs in a given repository
pull_requests = repository.get_pulls(state='closed')

# to get PRs closed during last N days
days_ago = datetime.now() - timedelta(days=7)

for pull_request in pull_requests:
    merged_at = pull_request.closed_at
    created_at = pull_request.merged_at

    if created_at >= days_ago and created_at and merged_at:
        print(f"Pull Request: {pull_request.number} Created at: {pull_request.created_at} Merged at: {pull_request.merged_at}")
Here in the loop for each PR, we get its attributes merged_at and created_at, see List pull requests – the Response schema has a list of all the attributes we can see for each PR.
In the days_ago = datetime.now() - timedelta(days=7) we are getting a day 7 days ago to select pool requests created after this date, and then for verification, we display information about the date of creation of the PR and the date when it was frozen in the master.
Run the script again:
[simterm]
$ ./test-api.py
Pull Request: 1055 Created at: 2023-05-31 18:34:18 Merged at: 2023-06-01 08:14:49
Pull Request: 1049 Created at: 2023-05-31 10:22:16 Merged at: 2023-05-31 18:03:09
Pull Request: 1048 Created at: 2023-05-30 15:16:13 Merged at: 2023-05-31 14:17:57
...
[/simterm]
Good! It’s working too.
Now we can start thinking about metrics for Prometheus.
Prometheus Client and metrics
Install the library:
[simterm]
$ pip install prometheus_client
[/simterm]
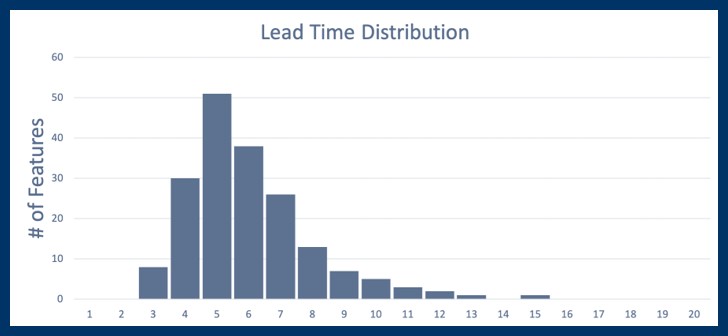
To have a better idea of what exactly we want to build, you can read How to Read Lead Time Distribution, where there is an example of such a graph:
That is, in our case, there will be:
- the x-axis (horizontal): time (hours to close PR)
- the y-axis (vertical): number of PRs closed in X hours
Here I spent quite a lot of time, trying to do this using different types of metrics for Prometheus, and at first, I tried Histogram because it seems logical to enter values into histogram buckets, like this:
buckets = [1, 2, 5, 10, 20, 100, 1000]
gh_repo_lead_time = Histogram('gh_repo_lead_time', 'Time in hours between PR open and merge', buckets=buckets, labelnames=['gh_repo_name'])
However, it did not work with Histogram, because bucket 1000 contains all values less than 1000, bucket 100 contains all values less than one hundred, and so on, while we need to include in the bucket 100 only data on pool requests that were closed between 50 hours and 100 hours.
But in the end, it all worked out using the Counter type and the repo_name and time_interval labels.
See A Deep Dive Into the Four Types of Prometheus Metrics.
Creating the metric
First, let’s create a Python dictionary with the “buckets” – these are the hours during which pool requests were closed:
time_intervals = [1, 2, 5, 10, 20, 50, 100, 1000]
Next, we will get the number of hours to close in each PR, check which “bucket” this PR falls into, and then enter the data into the metric – add a label time_interval with the value from the bucket into which this PR falls, and increment the counter value.
Let’s create the metric pull_request_duration_count itself and the function calculate_pull_request_duration() to which we will pass a pull request to check:
...
# buckets for PRs closed during {interval}
time_intervals = [1, 2, 5, 10, 20, 50, 100, 1000]  # 1 hour, 2 hours, 5 hours
# prometheus metric to count PRs in each {interval}
pull_request_duration_count = Counter('pull_request_duration_count',
                                      'Count of Pull Requests within a time interval',
                                      labelnames=['repo_name', 'time_interval'])

def calculate_pull_request_duration(repository, pr):
    created_at = pr.created_at
    merged_at = pr.merged_at

    if created_at >= days_ago and created_at and merged_at:
        duration = (merged_at - created_at).total_seconds() / 3600

        # Increment the histogram for each time interval
        for interval in time_intervals:
            if duration <= interval:
                print(f"PR ID: {pr.number} Duration: {duration} Interval: {interval}")
                pull_request_duration_count.labels(time_interval=interval, repo_name=repository).inc()
                break
...
Here in the calculate_pull_request_duration() function we:
- getting the creation time and pool request size
- checking that the PR is younger than
$days_agoand has the attributescreated_atandmerged_at, that is, it is already merged - count how much time it spent until the moment it merged the master branch, and convert it into hours –
duration = (merged_at - created_at).total_seconds() / 3600 - in the loop, we are going through the “buckets” from the
time_intervalsdictionary – look for which of them this PR falls into - and at the end, we create a metric
pull_request_duration_count, and in itslabelswe are setting the name of the repository and the “bucket” into which this pull request went, and incrementing the value of the counter by +1:
pull_request_duration_count.labels(time_interval=interval, repo_name=repository).inc()
Next, we describe the function main() and its call:
...

def main():
    # connect to Gihub
    github_instance = Github(github_token)
    organization_name = 'OrgName'
    # read org
    organization = github_instance.get_organization(organization_name)
    # get repos list
    repositories = organization.get_repos()

    for repository in repositories:
        # to set in labels
        repository_name = repository.full_name.split('/')[1]
        pull_requests = repository.get_pulls(state='closed')

        if pull_requests.totalCount > 0:
            print(f"Checking repository: {repository_name}")
            for pr in pull_requests:
                calculate_pull_request_duration(repository_name, pr)
        else:
            print(f"Sckipping repository: {repository_name}")

    # Start Prometheus HTTP server
    start_http_server(8000)
    print("HTTP server started")
    while True:
        time.sleep(15)
        pass

if __name__ == '__main__':
    main()
Here we will:
- create a GitHub object
- get a list of the organization’s repositories
- for each repository, we are calling the
get_pulls(state='closed')to get a list of closed PRs - check that there were pull requests in the repository, and we send them one by one to the function
calculate_pull_request_duration() - start the HTTP server on port 8000, where we will pass metrics to our Prometheus instance
Full code of the Prometheus exporter
All together now it turns out like this:
#!/usr/bin/env python

from datetime import datetime, timedelta
import time
from prometheus_client import start_http_server, Counter
from github import Github

# TODO: move to env vars
github_token = "ghp_ys9***ilr"

# to get PRs closed during last N days
days_ago = datetime.now() - timedelta(days=7)
# buckets for PRs closed during {interval}
time_intervals = [1, 2, 5, 10, 20, 50, 100, 1000]  # 1 hour, 2 hours, 5 hours
# prometheus metric to count PRs in each {interval}
pull_request_duration_count = Counter('pull_request_duration_count',
                                      'Count of Pull Requests within a time interval',
                                      labelnames=['repo_name', 'time_interval'])

def calculate_pull_request_duration(repository, pr):
    created_at = pr.created_at
    merged_at = pr.merged_at

    if created_at >= days_ago and created_at and merged_at:
        duration = (merged_at - created_at).total_seconds() / 3600

        # Increment the Counter for each time interval
        for interval in time_intervals:
            if duration <= interval:
                print(f"PR ID: {pr.number} Duration: {duration} Interval: {interval}")
                pull_request_duration_count.labels(time_interval=interval, repo_name=repository).inc()
                break

def main():
    # connect to Gihub
    github_instance = Github(github_token)
    organization_name = 'OrgNameg'
    # read org
    organization = github_instance.get_organization(organization_name)
    # get repos list
    repositories = organization.get_repos()

    for repository in repositories:
        # to set in labels
        repository_name = repository.full_name.split('/')[1]
        pull_requests = repository.get_pulls(state='closed')

        if pull_requests.totalCount > 0:
            print(f"Checking repository: {repository_name}")
            for pr in pull_requests:
                calculate_pull_request_duration(repository_name, pr)
        else:
            print(f"Skipping repository: {repository_name}")

    # Start Prometheus HTTP server
    start_http_server(8000)
    print("HTTP server started")
    while True:
        time.sleep(15)
        pass

if __name__ == '__main__':
    main()
Run the script:
[simterm]
$ ./github-exporter.py
...
Skipping repository: ***-sandbox
Checking repository: ***-ios
PR ID: 1332 Duration: 5.4775 Interval: 10
PR ID: 1331 Duration: 0.32916666666666666 Interval: 1
PR ID: 1330 Duration: 20.796944444444446 Interval: 50
...
[/simterm]
Wait until all repositories are checked and the http_server() will be started, and check the metrics with curl:
[simterm]
$ curl localhost:8000
...
# HELP pull_request_duration_count_total Count of Pull Requests within a time interval
# TYPE pull_request_duration_count_total counter
pull_request_duration_count_total{repo_name="***-ios",time_interval="10"} 1.0
pull_request_duration_count_total{repo_name="***-ios",time_interval="1"} 1.0
pull_request_duration_count_total{repo_name="***-ios",time_interval="50"} 2.0
pull_request_duration_count_total{repo_name="***-ios",time_interval="100"} 1.0
pull_request_duration_count_total{repo_name="***-ios",time_interval="20"} 1.0
pull_request_duration_count_total{repo_name="***-ios",time_interval="1000"} 1.0
...
[/simterm]
Nice! It works!
GitHub API rate limits
Keep in mind that GitHub limits the number of API requests to 5,000 per hour with a regular user token, and 15,000 if you have an Enterprise license. See Rate limits for requests from personal accounts.
If you exceed it, you will get a 403:
[simterm]
...
  File "/usr/local/lib/python3.11/site-packages/github/Requester.py", line 423, in __check
    raise self.__createException(status, responseHeaders, output)
github.GithubException.RateLimitExceededException: 403 {"message": "API rate limit exceeded for user ID 132904972.", "documentation_url": "https://docs.github.com/rest/overview/resources-in-the-rest-api#rate-limiting"}
[/simterm]
Prometheus Server and getting metrics
It remains to start collecting metrics in Prometheus and create a Grafana dashboard.
Running our Prometheus Exporter
Create a Dockerfile:
FROM python:latest

COPY github-exporter.py ./
RUN pip install prometheus_client PyGithub

CMD [ "python", "./github-exporter.py"]
Build the image:
[simterm]
$ docker build -t gh-exporter .
[/simterm]
So far we have Prometheus/Grafana in a simple Docker Compose – add the launch of our new exporter:
...
  gh-exporter:
    scrape_timeout: 15s
    image: gh-exporter
    ports:
      - 8000:8000
...
(it is still better to pass the token through an environment variable from the docker-compose file, and not to hardcode it in the code)
And in the configuration file of Prometheus itself, describe a new one scrape_job:
scrape_configs:
...
  - job_name: gh_exporter
    scrape_interval: 5s
    static_configs:
      - targets: ['gh-exporter:8000']
...
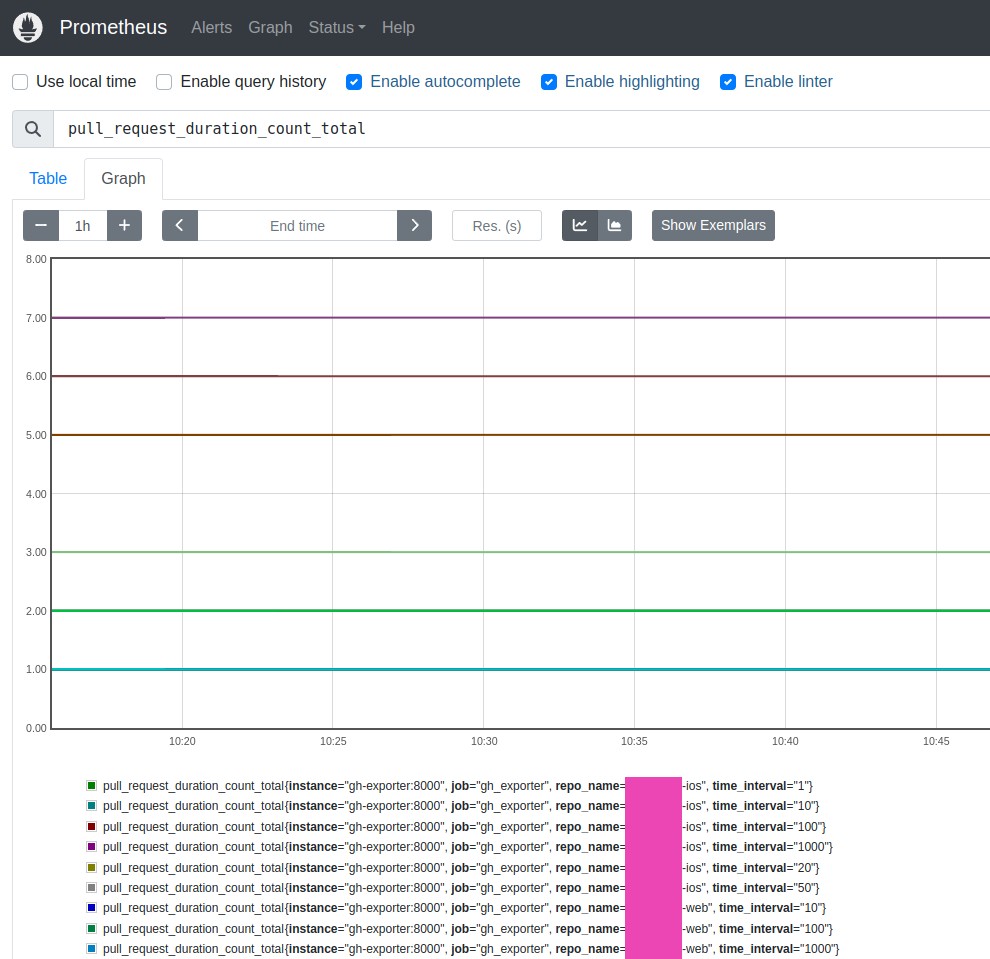
Launch it, and in a minute check the metrics in the Prometheus:
Yay!
Grafana dashboard
The last thing to do is the board itself.
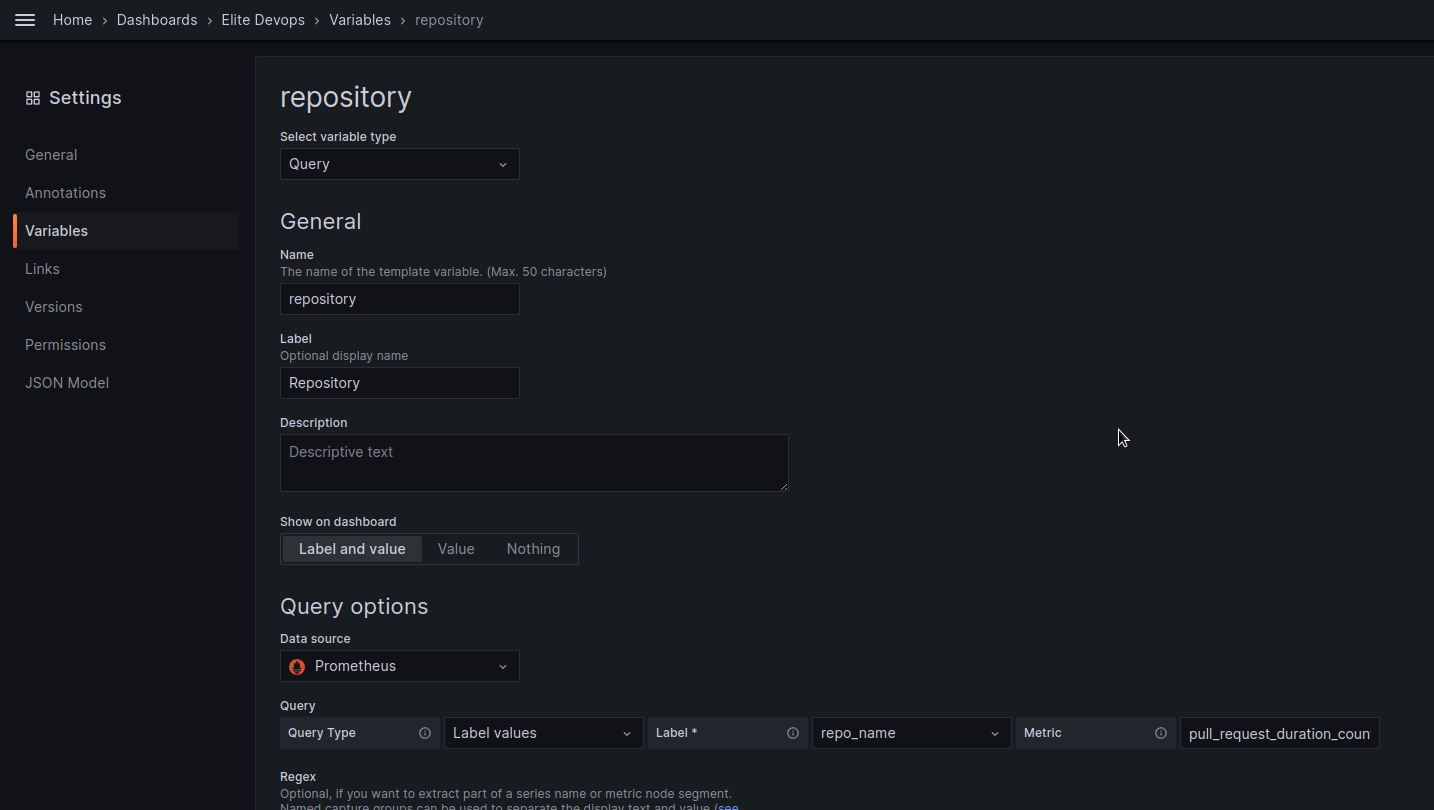
Let’s add a variable to be able to display data for a specific repository/s:
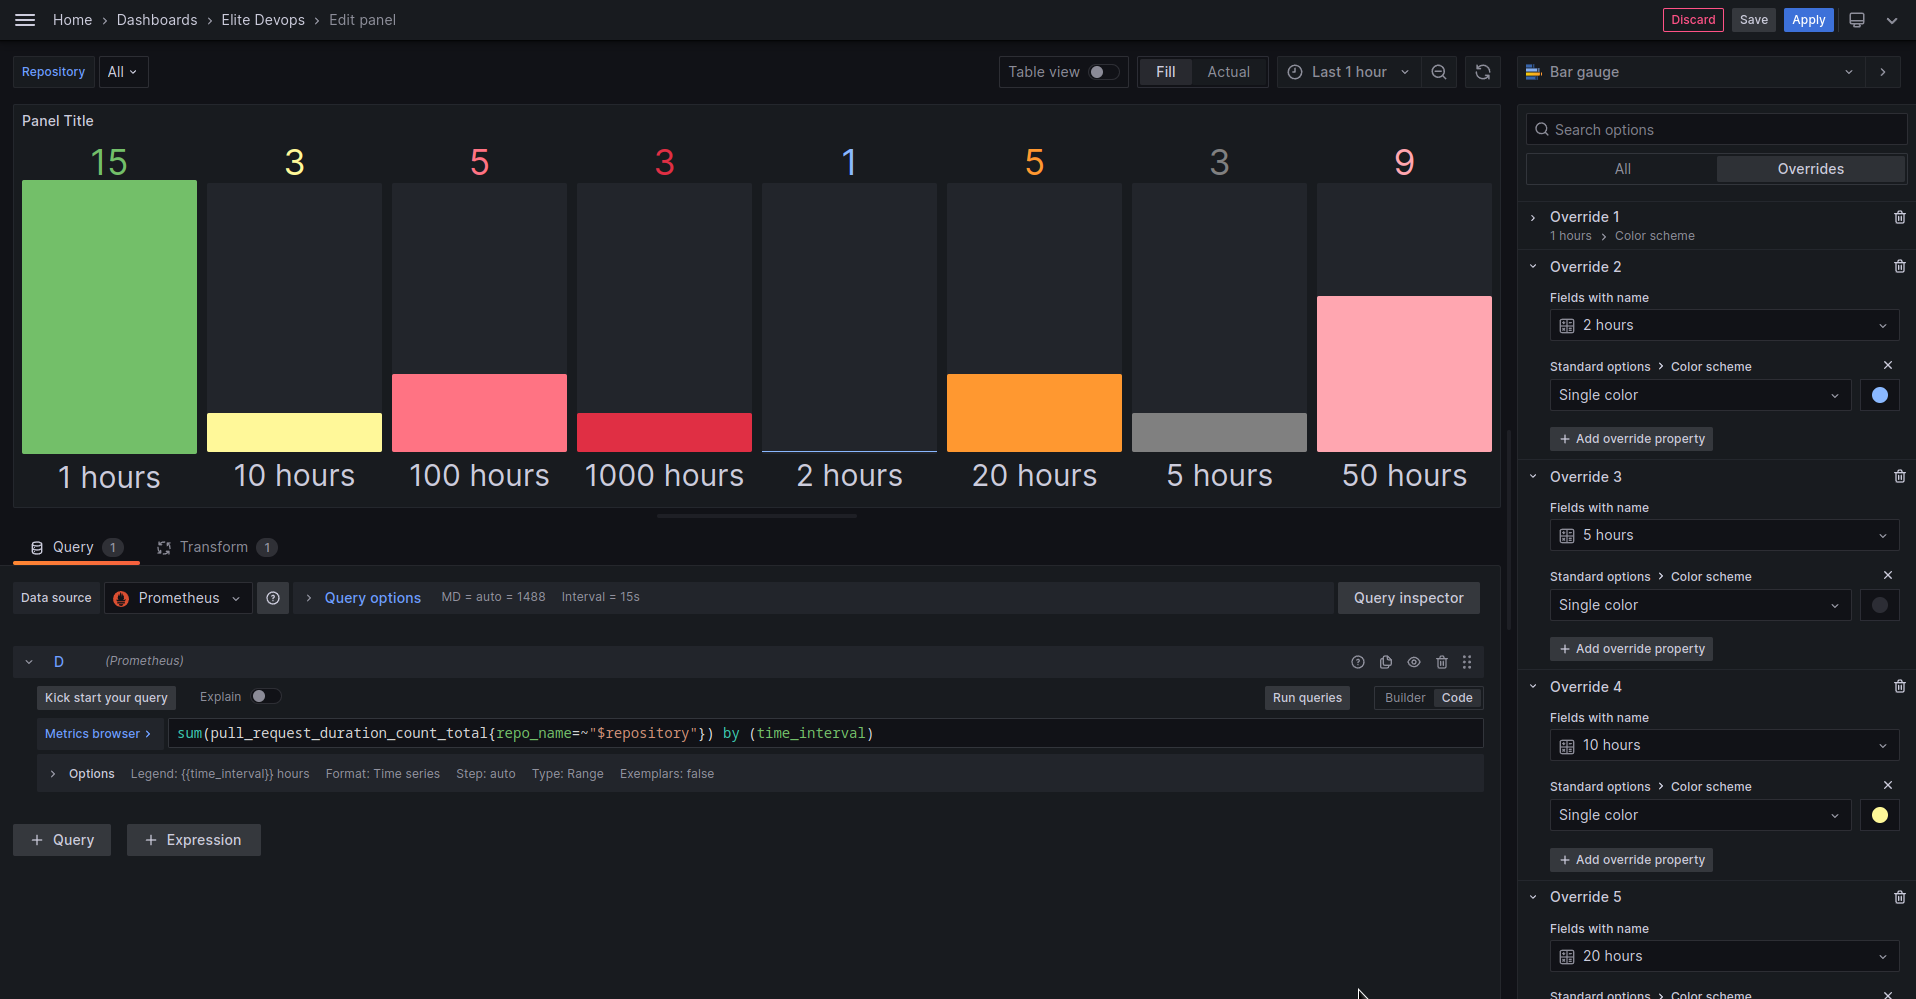
For visualization, I used the Bar gauge type and the following query:
sum(pull_request_duration_count_total{repo_name=~"$repository"}) by (time_interval)
In Overrides, set the color for each column.
The only thing that is not very good here is the sorting of columns: Prometheus itself does not know how to do this and does not want to (see Added sort_by_label function for sorting by label values ), and Grafana sorts by the first digits in the values obtained label, i.e. 1, 2, 5, not counting the number of 0’s after the number.
Maybe we’ll take Victoria Metrics from her sort_by_label, or we’ll just create several graphs in Grafana, and in each, we’ll display data on a specific “bucket” and the number of pool requests in it.
![]()


