I’ve heard a lot about VictoriaMetrics for a long time, and finally, it’s time to try it out.
So, in a nutshell – VictoriaMetrics is “Prometheus on steroids” and is fully compatible with it – can use its configuration files, exporters, PromQL, etc.
So for me who has always used Prometheus, the first question was – what’s the difference? The only thing I remember is that VictoriaMetrics seems to have an anomaly detection feature, which was missing in Prometheus – I wanted to add it for a long time.
There are not many comparisons in Google, but here is what I found:
- System Properties Comparison Prometheus vs. VictoriaMetrics – general information on both systems
- Prometheus vs VictoriaMetrics benchmark on node_exporter metrics – VictoriaMetrics uses much less disk and memory (and ChatGPT also says that VictoriaMetrics uses less disk for data storage as well)
- What is the difference between vmagent and Prometheus? and What is the difference between vmagent and Prometheus agent? – FAQ from VictoriaMetrics herself
- Prominent features – some documentation from VictoriaMetrics about its capabilities
In short about some VictoriaMetrics’ abilities:
- supports both Pull and Push models (unlike Prometheus, which requires Pushgateway for push )
- you can configure Prometheus with remote write to VictoriaMetrics, i.e. write data to VictoriaMetrics from Prometheus
- VictoriaMetrics has a concept of “namespaces” – you can have isolated environments for metrics, see Multitenancy
- has its own MetricsQL with wider capabilities than PromQL
- for acquaintance, there is a VictoriaMetrics playground
- for AWS is Managed VictoriaMetrics
So, today we will look at its architecture and components, will launch VictoriaMetrics with Docker Compose, configure the collection of metrics with Prometheus exporters, will see how it works with alerts, and will connect Grafana.
I have Prometheus with Alertmanager, a bundle of exporters, and Grafana already installed, and currently, they are launched simply through Docker Compose on AWS EC2, so we will add the VictoriaMetrics instance there. That is, the main idea is to replace Prometheus with VictoriaMetrics.
From what I saw while testing VictoriaMetrics, it looks really interesting. More options for functions, alert templates, and the UI itself gives more options for working with metrics. We will try to use it instead of Prometheus in our project and will see how it will be. Although, there are not many examples in the same Google, but ChatGPT can help.
Contents
VictoriaMetrics architecture
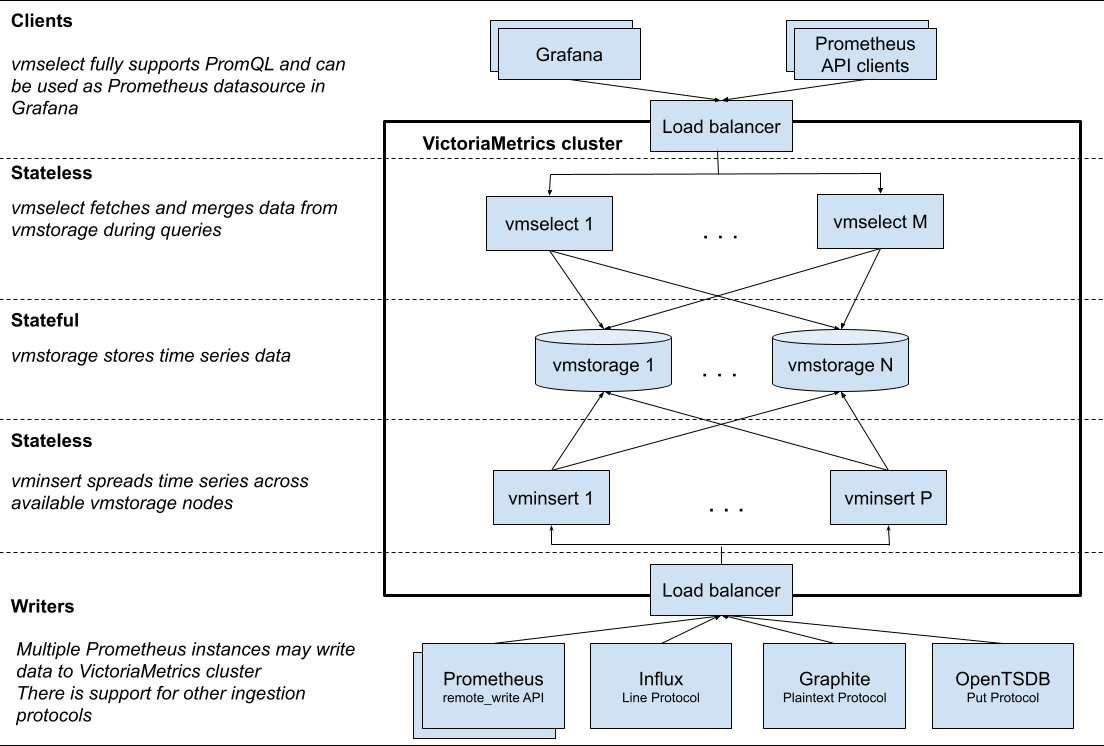
VictoriaMetrics has a cluster version and a single-node version. For small projects up to a million metrics per second, it is recommended to use a single node, but the general architecture is well described in the cluster version.
The main services and components of VictoriaMetrics:
vmstorage: responsible for data storage and responses to data requests by clients (i.e. byvmselect)vmselect: responsible for processing incoming requests for data sampling and data obtaining from thevmstoragenodesvminsert: responsible for receiving metrics and distributing data to thevmstoragenodes in accordance with the names and labels of these metricsvmui: Web UI for accessing data and configuration optionsvmalert: processes alerts from the configuration file and sends them to the Alertmanagervmagent: deals with collecting metrics from various sources, such as Prometheus exporters, filtering and relabeling them, and storing them in a data store (in the VictoriaMetrics instance itself or via theremote_writePrometheus protocol)vmanomaly: VictoriaMetrics Anomaly Detection – a service that constantly scans data in VictoriaMetrics and uses machine learning mechanisms to detect unexpected changes that can be used in alertsvmauth: simple auth proxy, router, and load balancer for VictoriaMetrics.
Running VictoriaMetrics with Docker Compose
So how can we use VictoriaMetrics if we already have Prometheus and its exporters?
- we can configure Prometheus to send metrics to VictoriaMetrics, see Prometheus setup (note that enabling
remote_writeon a Prometheus instance will increase the consumption of CPU and disk resources by 25%) – I don’t see the point in our case, but maybe it will be useful in case of using some KubePrometehusStack - or we can configure VictoriaMetrics to collect data from Prometheus exporters, see How to scrape Prometheus exporters such as node-exporter, that is, just do what I want to have now – replace Prometheus with VictoriaMetrics with minimal changes in the Prometheus configuration
An example of a Docker Compose file is in the docker-compose.yml.
What we have in it:
vmagent: collects metrics from exporters, see its options in Advanced usagevictoriametrics: saves data, see List of command-line flags for optionsvmalert: works with alerts, see options in Flagsalertmanager: old friend 🙂 receives alerts fromvmalert
Let’s start with containers vmagent and victoriametrics, and will connect alerts later.
Here is an example with all services except Prometheus exporters:
version: '3.8'

volumes:
  prometheus_data: {}
  grafana_data: {}
  vmagentdata: {}
  vmdata: {}

services:
  prometheus:
    image: prom/prometheus
    restart: always
    volumes:
      - ./prometheus:/etc/prometheus/
      - prometheus_data:/prometheus
    command:
      - '--config.file=/etc/prometheus/prometheus.yml'
      - '--storage.tsdb.path=/prometheus'
      - '--web.console.libraries=/usr/share/prometheus/console_libraries'
      - '--web.console.templates=/usr/share/prometheus/consoles'
      - '--web.external-url=http://100.***.****.197:9090/'
    ports:
      - 9090:9090
      - alertmanager:alertmanager

  alertmanager:
    image: prom/alertmanager
    restart: always
    ports:
      - 9093:9093
    volumes:
      - ./alertmanager/:/etc/alertmanager/
    command:
      - '--config.file=/etc/alertmanager/config.yml'
      - '--storage.path=/alertmanager'

  grafana:
    image: grafana/grafana
    user: '472'
    restart: always
    environment:
      GF_INSTALL_PLUGINS: 'grafana-clock-panel,grafana-simple-json-datasource'
    volumes:
      - grafana_data:/var/lib/grafana
      - ./grafana/provisioning/:/etc/grafana/provisioning/
    env_file:
      - ./grafana/config.monitoring
    ports:
      - 3000:3000
    depends_on:
      - prometheus

  loki:
    image: grafana/loki:latest
    ports:
      - "3100:3100"
    command: -config.file=/etc/loki/local-config.yaml

  victoriametrics:
    container_name: victoriametrics
    image: victoriametrics/victoria-metrics:v1.91.2
    ports:
      - 8428:8428
    volumes:
      - vmdata:/storage
    command:
      - "--storageDataPath=/storage"
      - "--httpListenAddr=:8428"
#      - "--vmalert.proxyURL=http://vmalert:8880"

  vmagent:
    container_name: vmagent
    image: victoriametrics/vmagent:v1.91.2
    depends_on:
      - "victoriametrics"
    ports:
      - 8429:8429
    volumes:
      - vmagentdata:/vmagentdata
      - ./prometheus:/etc/prometheus/
    command:
      - "--promscrape.config=/etc/prometheus/prometheus.yml"
      - "--remoteWrite.url=http://victoriametrics:8428/api/v1/write"
...
In the victoriametrics for now, we will comment --vmalert.proxyURL as vmalert will be added later.
To the vmagent we mount the ./prometheus directory with a prometheus.yaml configuration file containing srape_jobs, and exporter parameter files (for example, ./prometheus/blackbox.yml and /prometheus/blackbox-targets/targets.yaml for the Blackbox Exporter).
In the --remoteWrite.url we are setting where we will write the received metrics – to the VictoriaMetrics instance.
Run it:
[simterm]
# docker compose up
[/simterm]
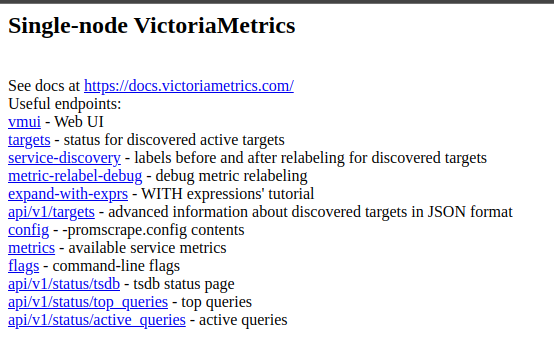
If you go without a URI, that is, just to domain.com/, it will display all the available paths:
field evaluation_interval not found in type promscrape.GlobalConfig
But vmagent didn’t running:
[simterm]
2023-06-05T09:38:31.376Z        fatal   VictoriaMetrics/lib/promscrape/scraper.go:117   cannot read "/etc/prometheus/prometheus.yml": cannot parse Prometheus config from "/etc/prometheus/prometheus.yml": cannot unmarshal data: yaml: unmarshal errors:
  line 4: field evaluation_interval not found in type promscrape.GlobalConfig
  line 13: field rule_files not found in type promscrape.Config
  line 19: field alerting not found in type promscrape.Config; pass -promscrape.config.strictParse=false command-line flag for ignoring unknown fields in yaml config
[/simterm]
Okay, let’s turn off the strictParse – add --promscrape.config.strictParse=false:
...
    command:
      - "--promscrape.config=/etc/prometheus/prometheus.yml"
      - "--remoteWrite.url=http://victoriametrics:8428/api/v1/write"
      - "--promscrape.config.strictParse=false"
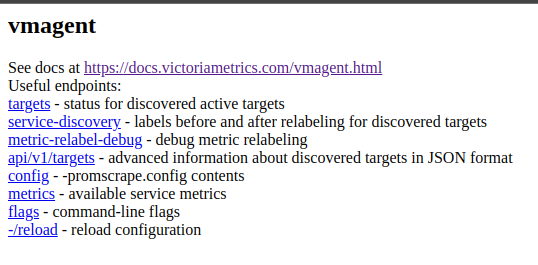
Restart the services, and go to the port 8429 in your browser, vmagent also have links:
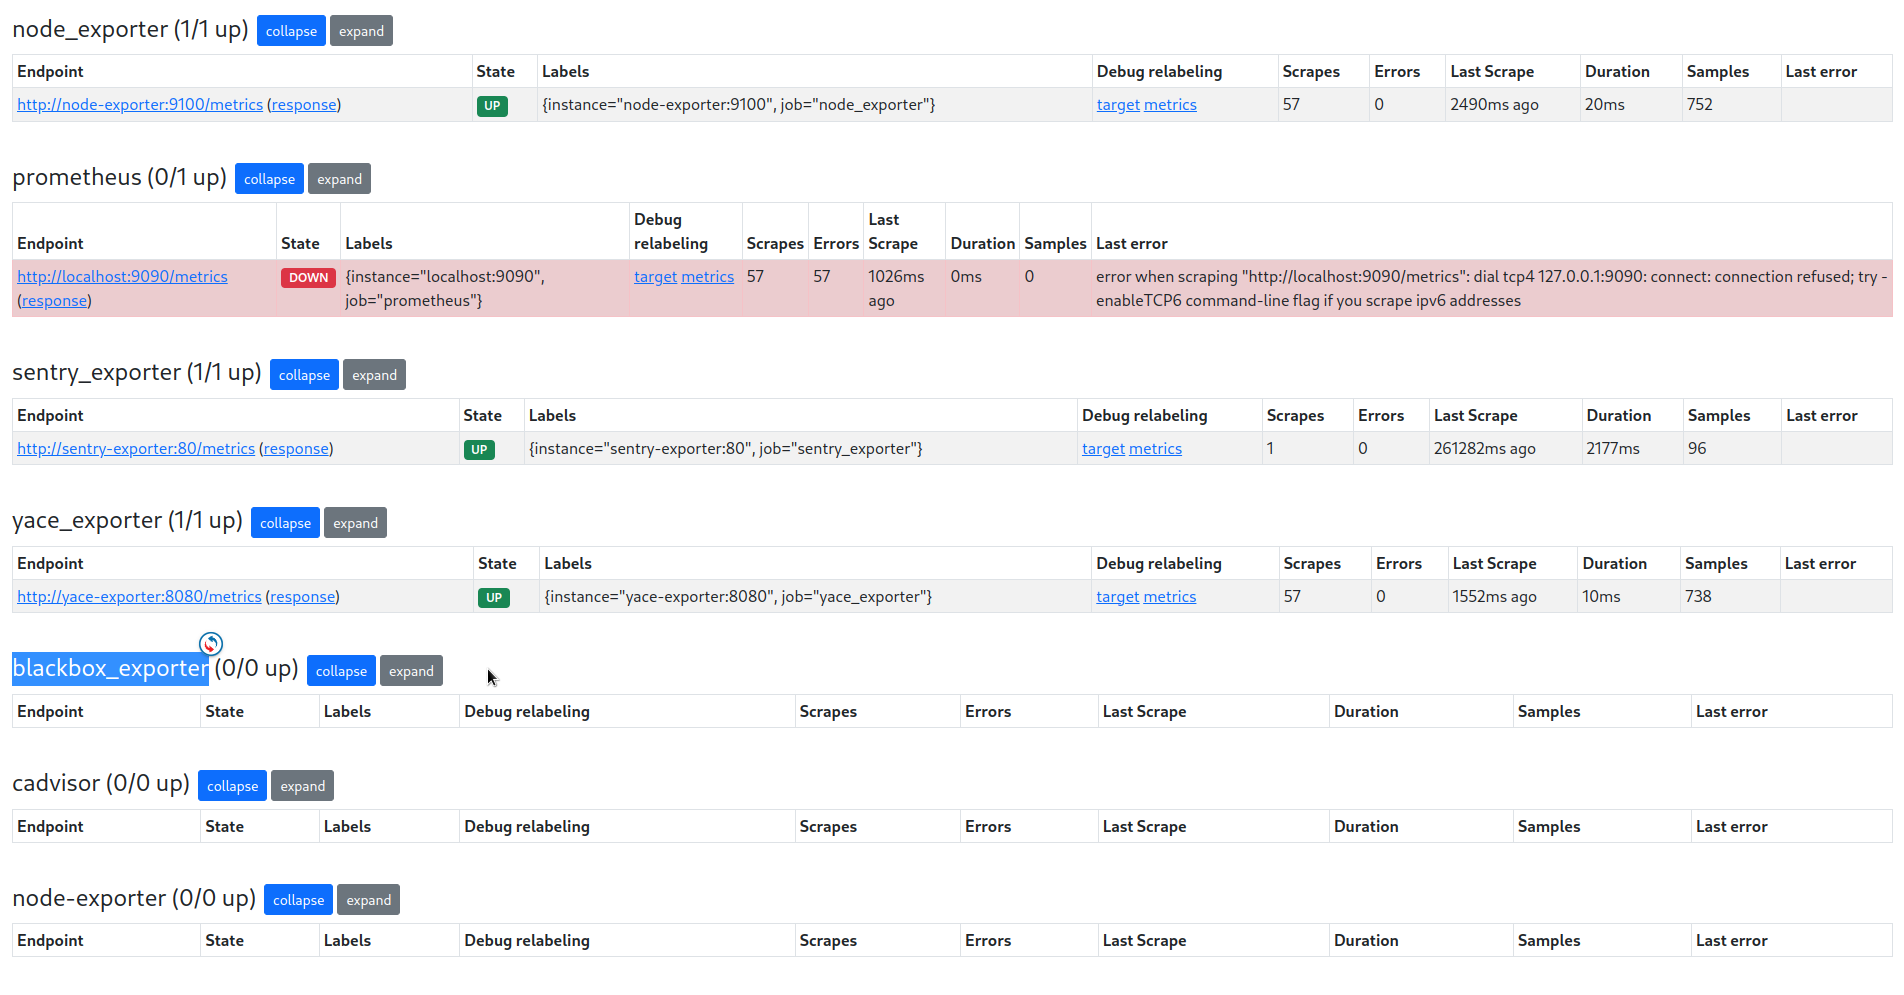
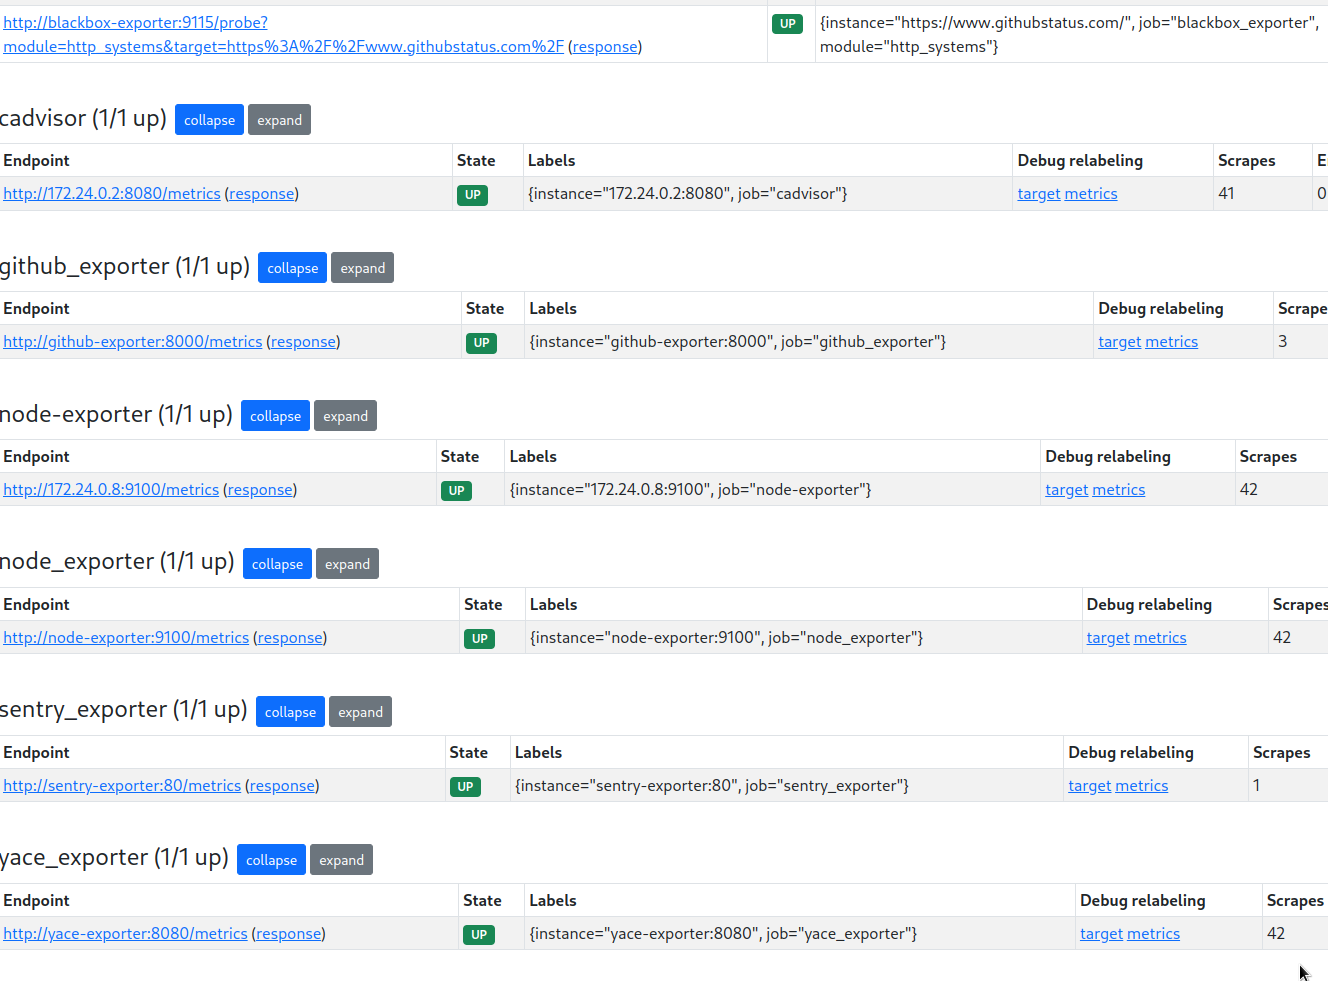
Check the targets – they are there, that is, vmagent was able to read the prometheus.yaml file, but not all of them work, for example – Sentry exporter is there, YACE is there, but the Blackbox, node_exporter, and cAdvisor are just empty:
Why?
Ah, it does not see those who have sd_configs, i.e. dynamic service-discovery:
...  - job_name: 'cadvisor'

    # Override the global default and scrape targets from this job every 5 seconds.
    scrape_interval: 5s

    dns_sd_configs:
    - names:
      - 'tasks.cadvisor'
      type: 'A'
      port: 8080
...
Although it seems to be able to – Supported service discovery configs.
Check the vmagent logs.
error in A lookup for “tasks.cadvisor”: lookup tasks.cadvisor on 127.0.0.11:53: no such host
And the logs are saying that the vmagent container cannot get an A-record from DNS:
[simterm]
...
vmagent                                 | 2023-06-05T10:04:10.818Z      error   VictoriaMetrics/lib/promscrape/discovery/dns/dns.go:163 error in A lookup for "tasks.cadvisor": lookup tasks.cadvisor on 127.0.0.11:53: no such host
vmagent                                 | 2023-06-05T10:04:10.821Z      error   VictoriaMetrics/lib/promscrape/discovery/dns/dns.go:163 error in A lookup for "tasks.node-exporter": lookup tasks.node-exporter on 127.0.0.11:53: no such host
...
[/simterm]
Read the documentation on dns_sd_configs, where it says “# names must contain a list of DNS names to query ”, but now my job is described with names = tasks.container_name, see Container discovery.
Let’s try to specify a simple name, i.e. cadvisorinstead of tasks.cadvisor:
...
  - job_name: 'cadvisor'
    dns_sd_configs:
    - names:
#      - 'tasks.cadvisor'
      - 'cadvisor'
      type: 'A'
      port: 8080
...
And disable the job_name: 'prometheus', we don’t need it anymore.
And now all the targets have appeared:
VictoriaMetrics and Grafana
Now let’s try to use VictoriaMetrics as a data source in Grafana.
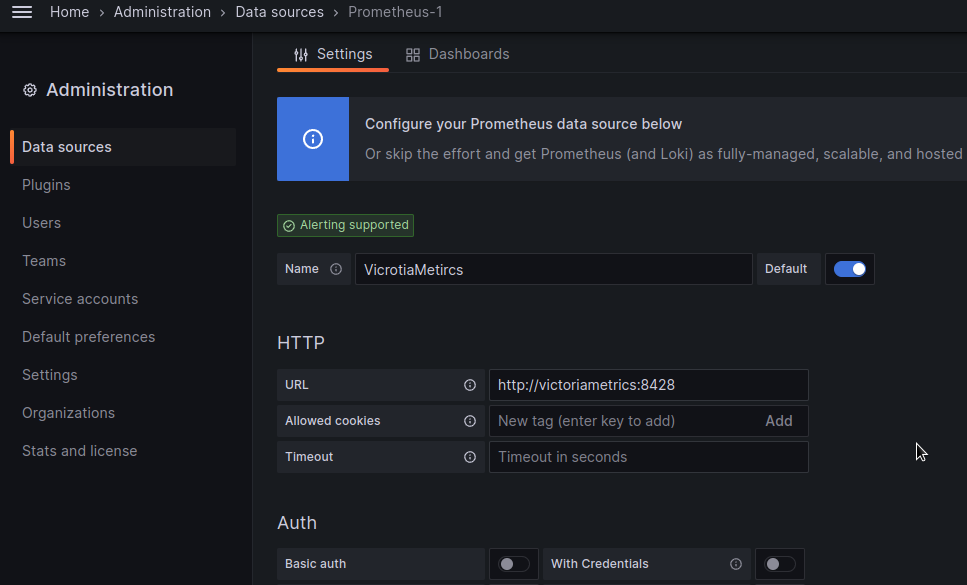
Actually, everything is done here in the same way as with Prometheus, using the same type of data source (although there is a dedicated plugin for VictoriaMetrics, worth to try it next time).
Add a new data source with the Prometheus type, and specify http://victoriametrics:8428 in the URL:
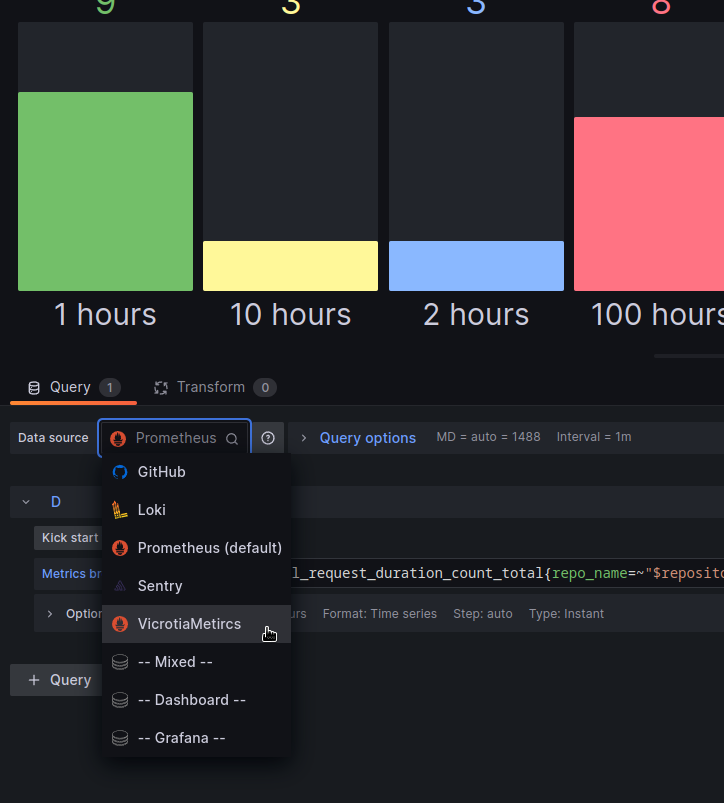
Update a panel – select the newly added data source:
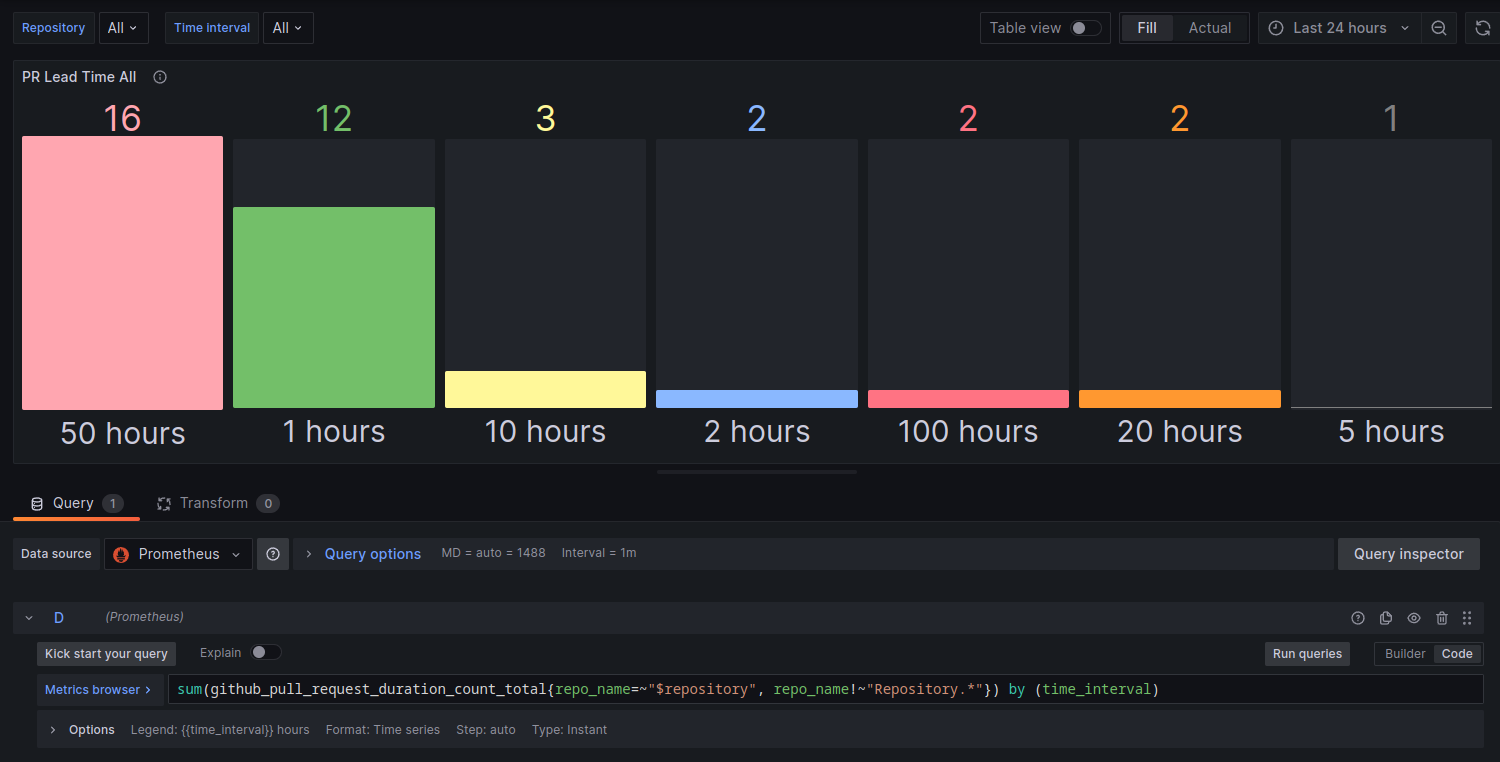
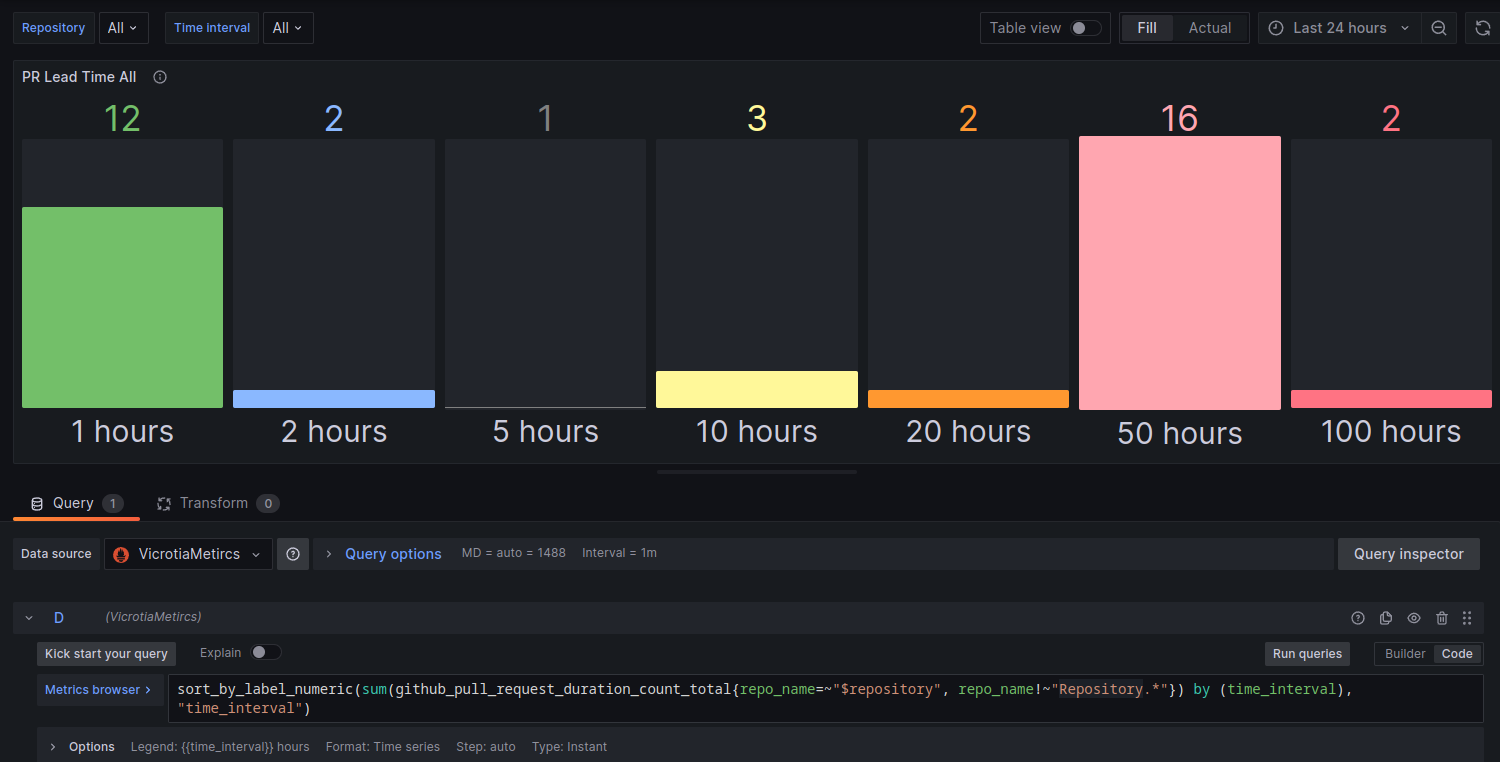
And now we can use the sort_by_label_numeric function that I was missing in the Prometheus post: GitHub Exporter – we write our own exporter for the GitHub API.
With Prometheus, this panel looks like this:
And with VictoriaMetrics and its sort_by_label_numeric function – like this:
Ok, everything seems to be working.
We can try the alerts.
VictoriaMetrics and Alertmanager
So, we now have Alertmanager and Prometheus running.
In the prometheus.yaml we have specified a file with alerts:
...
rule_files:
  - 'alert.rules'
...
What we need now is to launch vmalert, to which we will specify the “backend” in the form of Alertmanager to send alerts to, and add a file with alerts in the Prometheus format.
Like VictoriaMetrics itself, vmalert has slightly wider capabilities than Prometheus, for example, it saves the status of alerts, so restarting the container does not silence silenced alerts. There is also a useful variable $for for templates, in which the value for from an alert definition is passed, so we can have something like this:
...
    for: 5m
    annotations:
      description: |-
        {{ if $value }} *Current latency*: `{{ $value | humanize }}` milliseconds {{ end }} during `{{ $for }}` minutes
...
There is also httpAuth support and it is possible to perform a query with the query, and much more, see Template functions.
So, add the vmalert to the docker-compose.yaml:
...
  vmalert:
    container_name: vmalert
    image: victoriametrics/vmalert:v1.91.2
    depends_on:
      - "victoriametrics"
      - "alertmanager"
    ports:
      - 8880:8880
    volumes:
      - ./prometheus/alert.rules:/etc/alerts/alerts.yml
    command:
      - "--datasource.url=http://victoriametrics:8428/"
      - "--remoteRead.url=http://victoriametrics:8428/"
      - "--remoteWrite.url=http://victoriametrics:8428/"
      - "--notifier.url=http://alertmanager:9093/"
      - "--rule=/etc/alerts/*.yml"
Here the datasource.url configures from where to get metrics for checking in alerts, the remoteRead.url and remoteWrite.url is where to store the status of alerts.
In the notifier.url we’ve set where we will send alerts (and Alertmanager will send them to Slack/Opsgenie/etc through its config). And in the rule param, we specify the file with alerts itself, which is connected via volumes.
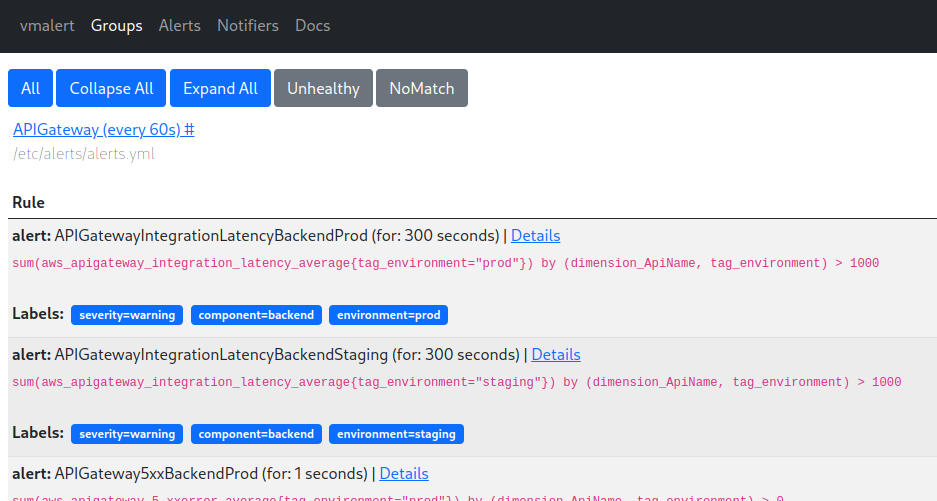
Restart the containers with docker compose restart, and access port 8880:
Okay, there are steering wheel alerts.
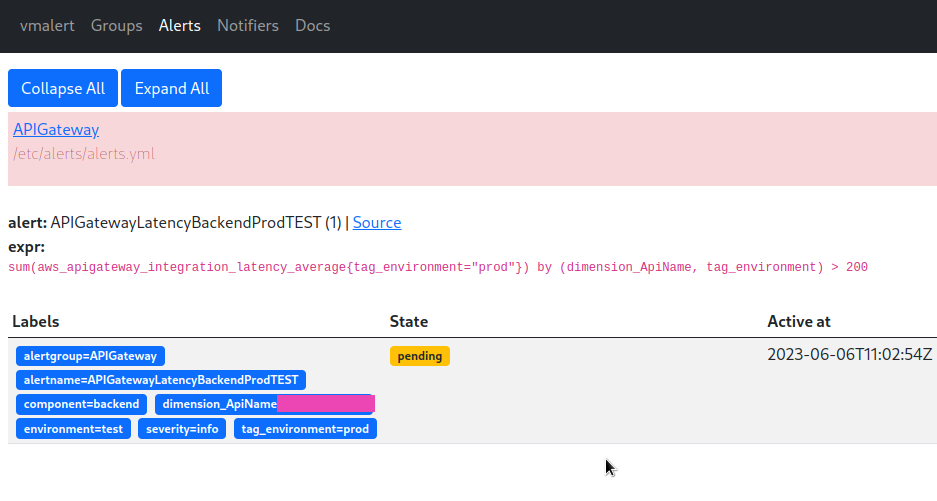
Let’s try to trigger a test alert – and we have a new alert in vmalertAlerts:
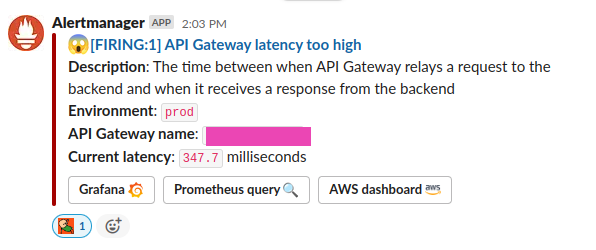
And a Slack message from Alertmanager:
Everything is working.
Now we can disable the Prometheus container, just update the depends_on in Grafana – instead of prometheus set the victoriametrics, and replace data sources in dashboards.
Bonus: Alertmanager Slack template
And an example of a template for notifications in Slack. It will still be reworked, so far the whole system is more in the state of proof of concept, but in general, it will be something like this.
A alertmanager/notifications.tmpl file with the template:
{{/* Title of the Slack alert */}}
{{ define "slack.title" -}}
  {{ if eq .Status "firing" }} :scream: {{- else -}} :relaxed: {{- end -}}
  [{{ .Status | toUpper -}} {{- if eq .Status "firing" -}}:{{ .Alerts.Firing | len }} {{- end }}] {{ (index .Alerts 0).Annotations.summary }}
{{ end }}

{{ define "slack.text" -}}

    {{ range .Alerts }}
        {{- if .Annotations.description -}}
        *Description*: {{ .Annotations.description }}
        {{- end }}
    {{- end }}

{{- end }}
Its use in the alertmanager/config.yml:
receivers:

- name: 'slack-default'

  slack_configs:
    - title: '{{ template "slack.title" . }}'
      text: '{{ template "slack.text" . }}'
      send_resolved: true
      actions:
        - type: button
          text: 'Grafana :grafana:'
          url: '{{ (index .Alerts 0).Annotations.grafana_url }}'
        - type: button
          text: 'Prometheus query :mag:'
          url: '{{ (index .Alerts 0).GeneratorURL }}'
        - type: button
          text: 'AWS dashboard :aws:'
          url: '{{ (index .Alerts 0).Annotations.aws_dashboard_url }}'
Template for an alert, the file is connected to the vmalerts container, see Reusable templates :
{{ define "grafana.filter" -}}
  {{- $labels := .arg0 -}}
  {{- range $name, $label := . -}}
    {{- if (ne $name "arg0") -}}
      {{- ( or (index $labels $label) "All" ) | printf "&var-%s=%s" $label -}}
    {{- end -}}
  {{- end -}}
{{- end -}}
And the alert itself:
- record: aws:apigateway_integration_latency_average_sum
  expr: sum(aws_apigateway_integration_latency_average) by (dimension_ApiName, tag_environment)

- alert: APIGatewayLatencyBackendProdTEST2
  expr: aws:apigateway_integration_latency_average_sum{tag_environment="prod"} > 100
  for: 1s
  labels:
    severity: info
    component: backend
    environment: test
  annotations:
    summary: "API Gateway latency too high"
    description: |-
      The time between when API Gateway relays a request to the backend and when it receives a response from the backend
      *Environment*: `{{ $labels.tag_environment }}`
      *API Gateway name*: `{{ $labels.dimension_ApiName }}`
      {{ if $value }} *Current latency*: `{{ $value | humanize }}` milliseconds {{ end }}
    grafana_url: '{{ $externalURL }}/d/overview/overview?orgId=1{{ template "grafana.filter" (args .Labels "environment" "component") }}'
The $externalURL is obtained by vmalerts from the --external.url=http://100.***.***.197:3000" parameter.
Useful links
- VictoriaMetrics Key concepts
- Third-party articles and slides about VictoriaMetrics
- MetricsQL query with optional WITH expressions
- Monitoring at scale with Victoria Metrics
![]()
