We continue to develop our monitoring stack. See the first part – VictoriaMetrics: creating a Kubernetes monitoring stack with its own Helm chart.
What do we want to do next: give access to developers so that they can set Silence for alerts themselves in Alertmanager to avoid spamming Slack, see Prometheus: Alertmanager Web UI alerts Silence.
In order to provide secure access to the Alertmanager UI, we can use another component from VictoriaMetrics – the VMAuth, that allows to create a single endpoint with user authentication and proxy user requests to a corresponding backend.
In short, with VMAuth we can:
- create a single entry point for services with Basic or Bearer user authentication and authorization
- depending on the user and its route/URI, direct it to the appropriate service (in fact, you can create one Ingress and serve all requests through it instead of creating Ingress and authentication for each service separately)
- have a simple round-robin load balancer
- configure IP filters with Allow and Deny letters
- add custom headers to requests
We will deploy in AWS EKS from the Helm-chart victoria-metrics-auth, but it also can be done through YAML manifests, see documentation and other examples on Authorization and exposing components and VMAuth.
Contents
Installing the VMAuth Helm chart
Since we are using an umbrella chart to deploy our monitoring, we need to add a new subchart to the dependecy block in the Chart.yaml file:
...
- name: victoria-metrics-auth
  version: ~0.3.3
  repository: https://victoriametrics.github.io/helm-charts/
...
See all default values in the values.yaml, and let’s prepare our config,
In a local values.yaml describe the VMAuth configuration – an Ingress, a username and its password, and where to redirect its requests – here it will be Kubernetes Service for Alertmanager:
...
victoria-metrics-auth:
  ingress:
    enabled: true
    annotations:
      kubernetes.io/ingress.class: alb
      alb.ingress.kubernetes.io/target-type: ip
      alb.ingress.kubernetes.io/scheme: internet-facing
      alb.ingress.kubernetes.io/certificate-arn: arn:aws:acm:us-east-1:49***148:certificate/66e3050e-7f27-4f0c-8ad4-0733a6d8071a
      alb.ingress.kubernetes.io/listen-ports: '[{"HTTPS":443}, {"HTTP":80}]'
      alb.ingress.kubernetes.io/load-balancer-attributes: idle_timeout.timeout_seconds=600
    hosts:
      - name: vmauth.dev.example.co
        path: /
        port: http
  config:
    users:
      - username: "vmadmin"
        password: "p@ssw0rd"
        url_prefix: "http://vmalertmanager-vm-k8s-stack.dev-monitoring-ns.svc:9093"
...
Install Helm dependency:
$ helm dependency update
And deploy the chart:
$ helm -n dev-monitoring-ns upgrade --install atlas-victoriametrics . -f values/dev/atlas-monitoring-dev-values.yaml
Check whether Ingress and AWS ALB have been added to it:
$ kk -n dev-monitoring-ns get ingress
NAME                                          CLASS    HOSTS                   ADDRESS                   PORTS   AGE
atlas-victoriametrics-victoria-metrics-auth   <none>   vmauth.dev.example.co   k8s-***elb.amazonaws.com  80      3m12s
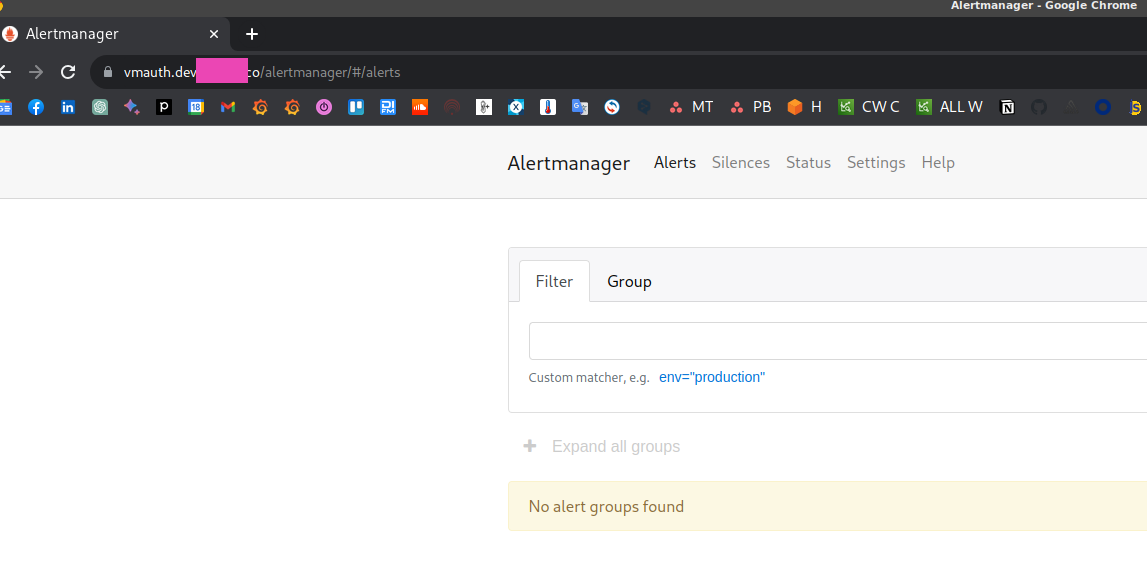
Wait for the DNS to update, and open https://vmauth.dev.example.co:
Log in and you have to see the Alertmanager:
VMAuth config in a Kubernetes Secret
Instead of keeping the config in the values files, you can create a Kubernetes Secret:
apiVersion: v1
kind: Secret
metadata:
  name: vmauth-config-secret
stringData:
  auth.yml: |-
    users:
      - username: vmadmin
        password: {{ .Values.vmauth_password }}
        url_map:
        url_prefix: http://vmalertmanager-vm-k8s-stack.dev-monitoring-ns.svc:9093/
VMAuth, users, and routes
It is possible to create one user and with the url_map configure several routes – depending on the URI of the request, a user will be redirected to an appropriate backend.
In the src_paths we can use regular expressions, and with the default_url we can specify a URL for requests with no corresponding ULR in the src_paths:
...
    users:
      - username: vmadmin
        password: {{ .Values.vmauth_password }}
        url_map:
        - src_paths:
          - /alertmanager.*
          url_prefix: http://vmalertmanager-vm-k8s-stack.dev-monitoring-ns.svc:9093/
        - src_paths:
          - /vmui.*
          url_prefix: http://vmsingle-vm-k8s-stack.dev-monitoring-ns.svc:8429
        default_url:
          - https://google.com
If you plan to add access to the VMSingle instance, add a block for Prometheus, otherwise there will be errors like:
{“ts”:”2023-08-22T14:37:43.363Z”,”level”:”warn”,”caller”:”VictoriaMetrics/app/vmauth/main.go:159″,”msg”:”remoteAddr: \”10.0.0.74:25806, X-Forwarded-For: 217.***.***.253\”; requestURI: /prometheus/vmui/custom-dashboards; missing route for \”/prometheus/v
mui/custom-dashboards\””}
{“ts”:”2023-08-22T14:37:43.396Z”,”level”:”warn”,”caller”:”VictoriaMetrics/app/vmauth/main.go:159″,”msg”:”remoteAddr: \”10.0.0.74:25806, X-Forwarded-For: ***.***.165.253\”; requestURI: /prometheus/api/v1/label/__name__/values; missing route for \”/promet
heus/api/v1/label/__name__/values\””}
For Prometheus, the block looks similar to others:
...
      - src_paths:
        - /prometheus.*
        url_prefix: http://vmsingle-vm-k8s-stack.dev-monitoring-ns.svc:8429
In order for the Alertmanager itself to work through the URI /alertmanager, in its values you need to configure routePrefix:
...
  alertmanager:
    enabled: true
    spec:
      configSecret: "alertmanager-config"
      routePrefix: "/alertmanager"
...
And don’t forget to change the default URL for VMAlert and other components, which are using Alertmanager, like Ruler:
...
  vmalert:
    annotations: {}
    enabled: true
    spec:
      notifier:
        url: "http://vmalertmanager-vm-k8s-stack.dev-monitoring-ns.svc:9093/alertmanager"
...
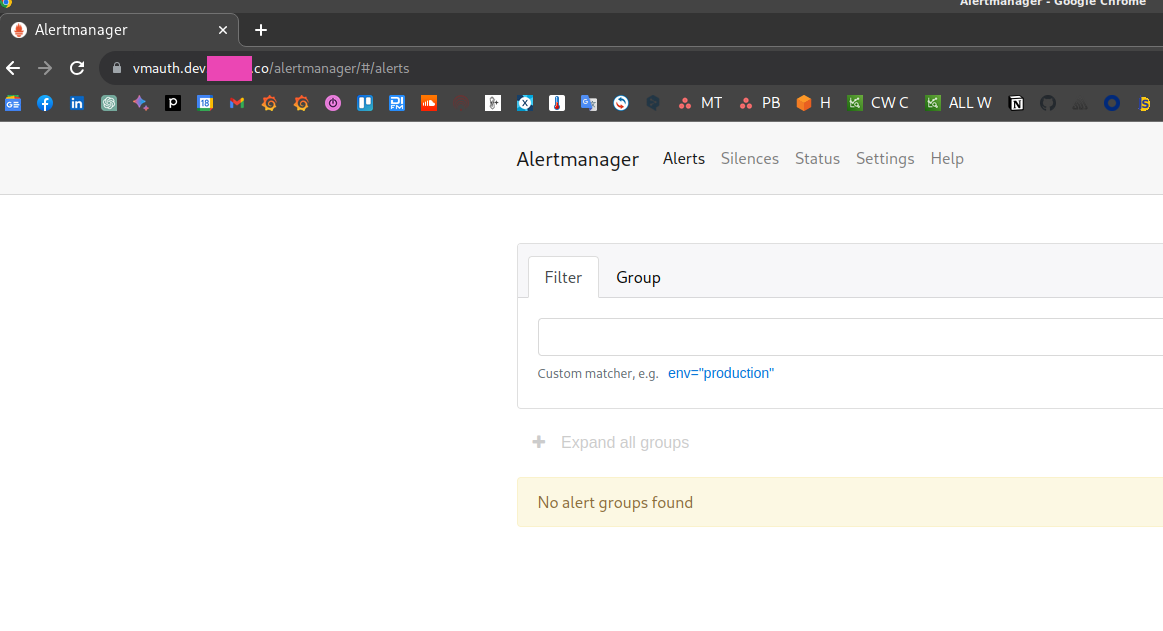
Deploy the changes, and to apply the config changes in the VMAuth instance itself, make a request to the /-/reload endpoint, i.e. – https://vmauth.dev.example.co/-/reload .
Alertmanager is now available at https://vmauth.dev.example.co/alertmanager :
In fact, the src_pathscan configuration may be a bit complicated., For example, in the documentation, the routes are set as /uri/path:
url_map:
- src_paths:
  - /api/v1/query
  - /api/v1/query_range
But when I started doing it, it turned out that when performing a redirect from VMAuth to an internal service, an extra slash was added at the end, and access to Alertmanager did not work.
That is why in my examples above, the routes are specified with the “.*“.
Thanks to the help of VictoriaMetrics Support in the VictoriaMetrics Slack, we found the workaround using the regex.
Overall, VictoriaMetrics Support is really professional and responds quite fast.
Basic Auth vs Bearer token
Instead of the common login:password, we can use a ServiceAccount token.
Create a ServiceAccount and a Secret for it with the type kubernetes.io/service-account-token:
apiVersion: v1
kind: ServiceAccount
metadata:
  name: vmauth-sa
  namespace: dev-monitoring-ns
secrets:
- name: vmauth-token-secret
---
apiVersion: v1
kind: Secret
metadata:
  name: vmauth-token-secret
  namespace: dev-monitoring-ns
  annotations:
    kubernetes.io/service-account.name: vmauth-sa
type: kubernetes.io/service-account-token
Deploy, get a token for this ServicAccount:
$ kk -n dev-monitoring-ns create token vmauth-sa
eyJhbGciOi***gfeNGWVjJn5-LWd2aslxAwnUTpQ
Add bearer_token to the VMAuth config:
...
    users:
    - username: vmadmin
      password: {{ .Values.vmauth_password }}
      url_map:
      - src_paths:
        - /alertmanager.*
        url_prefix: http://vmalertmanager-vm-k8s-stack.dev-monitoring-ns.svc:9093
      - src_paths:
        - /vmui.*
        url_prefix: http://vmsingle-vm-k8s-stack.dev-monitoring-ns.svc:8429
      - src_paths:
        - /prometheus.*
        url_prefix: http://vmsingle-vm-k8s-stack.dev-monitoring-ns.svc:8429
    - bearer_token: "eyJhbGciOiJSUzI1NiIsImtpZ***gfeNGWVjJn5-LWd2aslxAwnUTpQ"
      url_prefix: http://vmalertmanager-vm-k8s-stack.dev-monitoring-ns.svc:9093
Deploy, call the /-/reload endpoint again, and check access.
Set the token to a variable:
$ token="eyJhbGciOiJSUzI1NiIsImt***-LWd2aslxAwnUTpQ"wnUTpQ
And using curl open the VMAuth now:
$ curl -H "Authorization: Bearer ${token}" https://vmauth.dev.example.co/
<a href="/alertmanager">Found</a>.
VMAuth and “AnyService”
And finally, VMAuth can be used to authenticate not only VictoriaMetrics and its services, but (almost) any.
For example, we have a pod with Nginx Demo:
apiVersion: v1
kind: Pod
metadata:
  name: my-pod
  labels:
    app: my-pod
spec:
  containers:
    - name: my-container
      image: nginxdemos/hello
---
apiVersion: v1
kind: Service
metadata:
  name: my-service
spec:
  selector:
    app: my-pod
  ports:
    - protocol: TCP
      port: 80
      targetPort: 80
In VMAuth, add a new route:
...
      - src_paths:
        - /nginxdemo.*
        url_prefix: http://my-service.default.svc:80
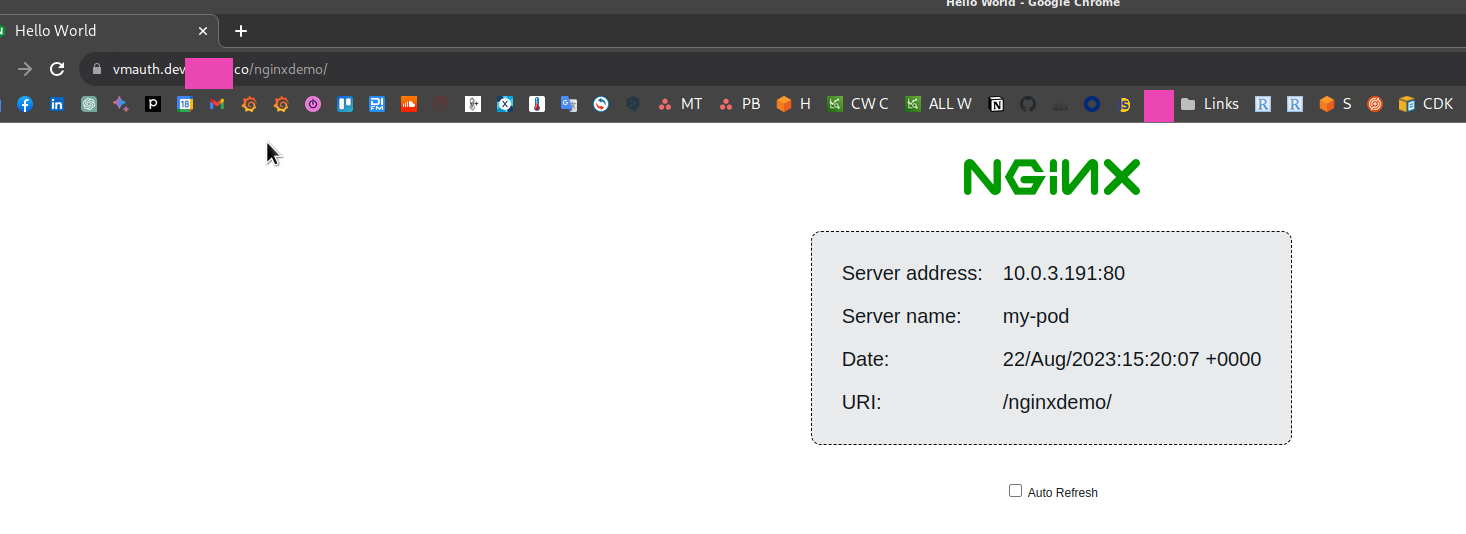
And now on the https://vmauth.dev.example.co/nginxdemo after authentication you’ll see the Nginx:
But for the Kubernetes Dashboard, this will not work, because it uses a self-signed TLS certificate, and VMAuth does not connect to the corresponding service, because it cannot validate the certificate. Maybe there is a workaround for this, but I didn’t dive too deep into that, just checked if this is working in general.
VMAuth Self-Security
See Security,
Secure the “service” routes of VMAuth itself.
Add extraArgs to the values.yaml:
...
  extraArgs:
    reloadAuthKey: password
    flagsAuthKey: password
    metricsAuthKey: password
    pprofAuthKey: password
...
Deploy, and now if you call the /-/reload without a key, you’ll get an error:
$ curl https://vmauth.dev.example.co/-/reload
The provided authKey doesn't match -reloadAuthKey
To specify a key for authentication, add it with the authKey as /-/reload?authKey=password:
$ curl -I https://vmauth.dev.example.co/-/reload?authKey=password
HTTP/2 200
So far, it seems that there is no possibility to specify the keys with a Kubernetes Secret, only hardcode the in values.yaml, but there is already a feature request.
![]()


