 This one turned out to be a bit unusual 🙂
Unusual in the sense that it’s actually quite “usual” – usual in the way posts like this were written back in the old days, in the age of mammoths – before LLMs and AI agents: today I was debugging an issue, and decided to do it without using AI at all, purely in “manual mode” – with Googling and reading the documentation.
This was inspired by my previous post – AI: LLMs, agents, work and us – engineers. Personal thoughts, because when I saw the alerts in the morning and started figuring out where the problem was and how to look for it, my first thought was “I’ll just throw this into Codex and let it figure it out”.
But then I started thinking – how did I solve problems like this before? Where do I even start? What metrics does LiteLLM have in the first place, and what interesting things can we find in the logs?
So today we’ll do it a bit “the old school way” – switch the brain on and do everything ourselves.
Fortunately, the problem isn’t that critical for us, and I have a chance to dig around a bit and spend some extra time on it.
Contents
The issue: LiteLLM PostgreSQL Failed Requests
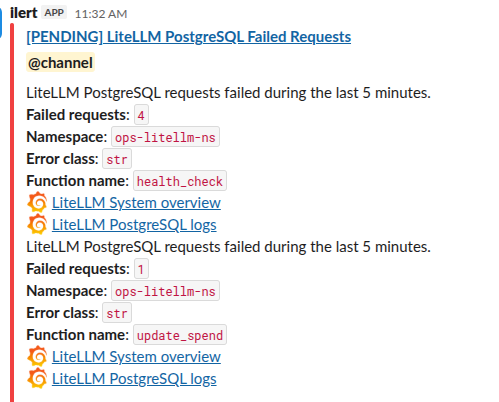
Starting overnight, alerts for “LiteLLM PostgreSQL Failed Requests” began appearing in Slack:
Debugging: LiteLLM “level”
The first interesting question is – what changed overnight at all?
Maybe we have too many requests to LiteLLM and the load on its PostgreSQL has increased? See What is stored in the DB.
Let’s look at the request graphs – there were spikes overnight, but that’s expected, this is what it always looks like for us at night:
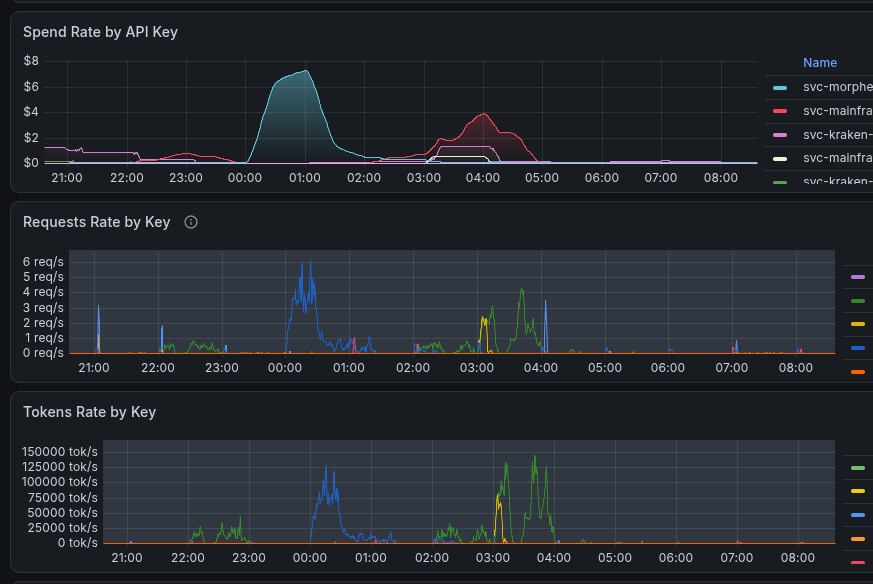
Besides, the request spikes ended at 04:00, which is also our common flow, and after that the traffic is already minimal – but the PostgreSQL errors are happening right now.
The alert itself is built from LiteLLM’s default metric – litellm_postgres_failed_requests_total (see Monitor System Health, and I also covered it a bit in LiteLLM: monitoring with VictoriaMetrics – alerts and Grafana):
- alert: LiteLLM PostgreSQL Failed Requests
  expr: |
      sum by (namespace, error_class, function_name) (
        increase(litellm_postgres_failed_requests_total[5m])
      ) > 0
Let’s look at the error graphs – when did it actually start, and what does the PostgreSQL error frequency look like?
And the graph for the last 2 days is very interesting – the problem started exactly tonight, at 01:00 UTC:
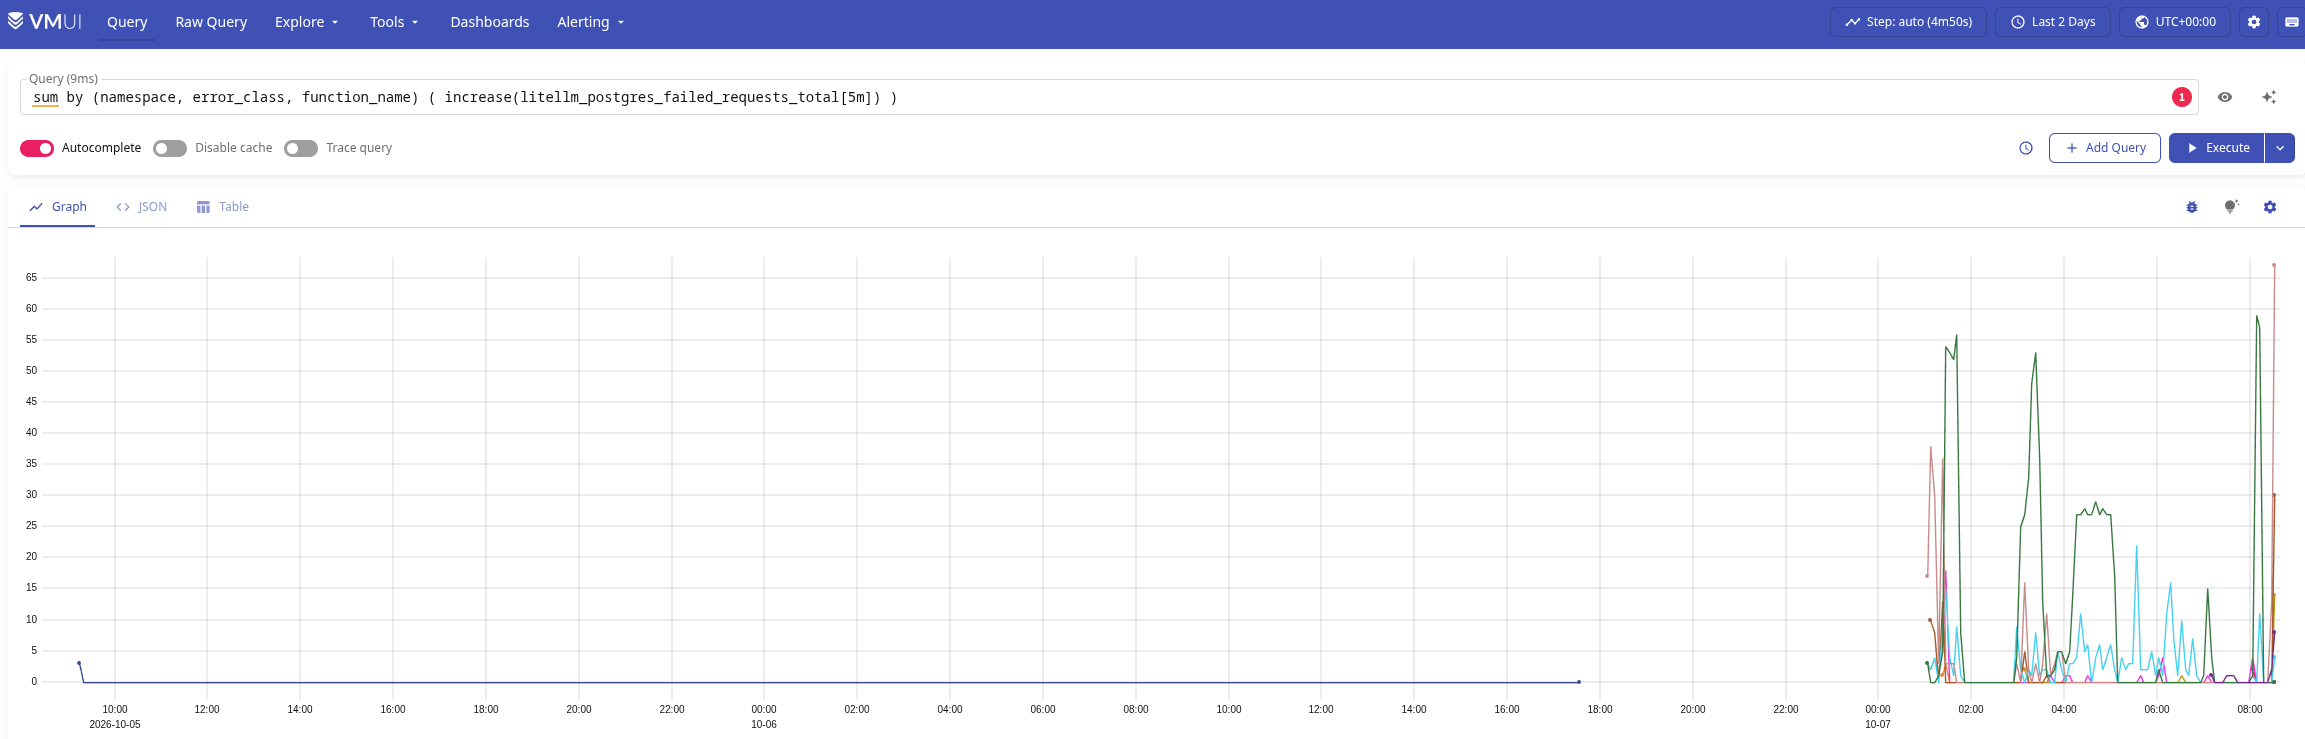
We definitely didn’t deploy any changes to LiteLLM overnight – so the reason most likely isn’t any changes in her (his? – it’s an AI Gateway – probably “his” after all) code.
We can also see that the problem is happening in two environments – Test and Ops (our production), and it has different error_class and function_name values:
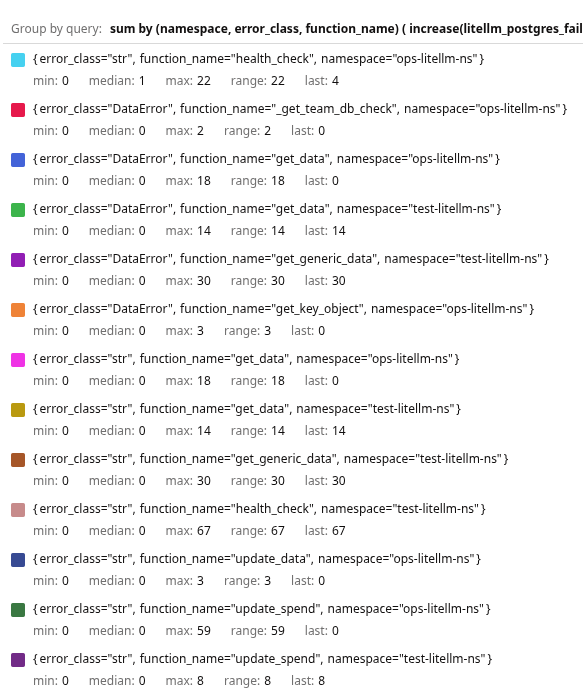
Which means this isn’t some “local” problem with a single LiteLLM component, but something more “global”.
Alright – let’s go check the LiteLLM logs.
And in the logs we see this “beauty”:
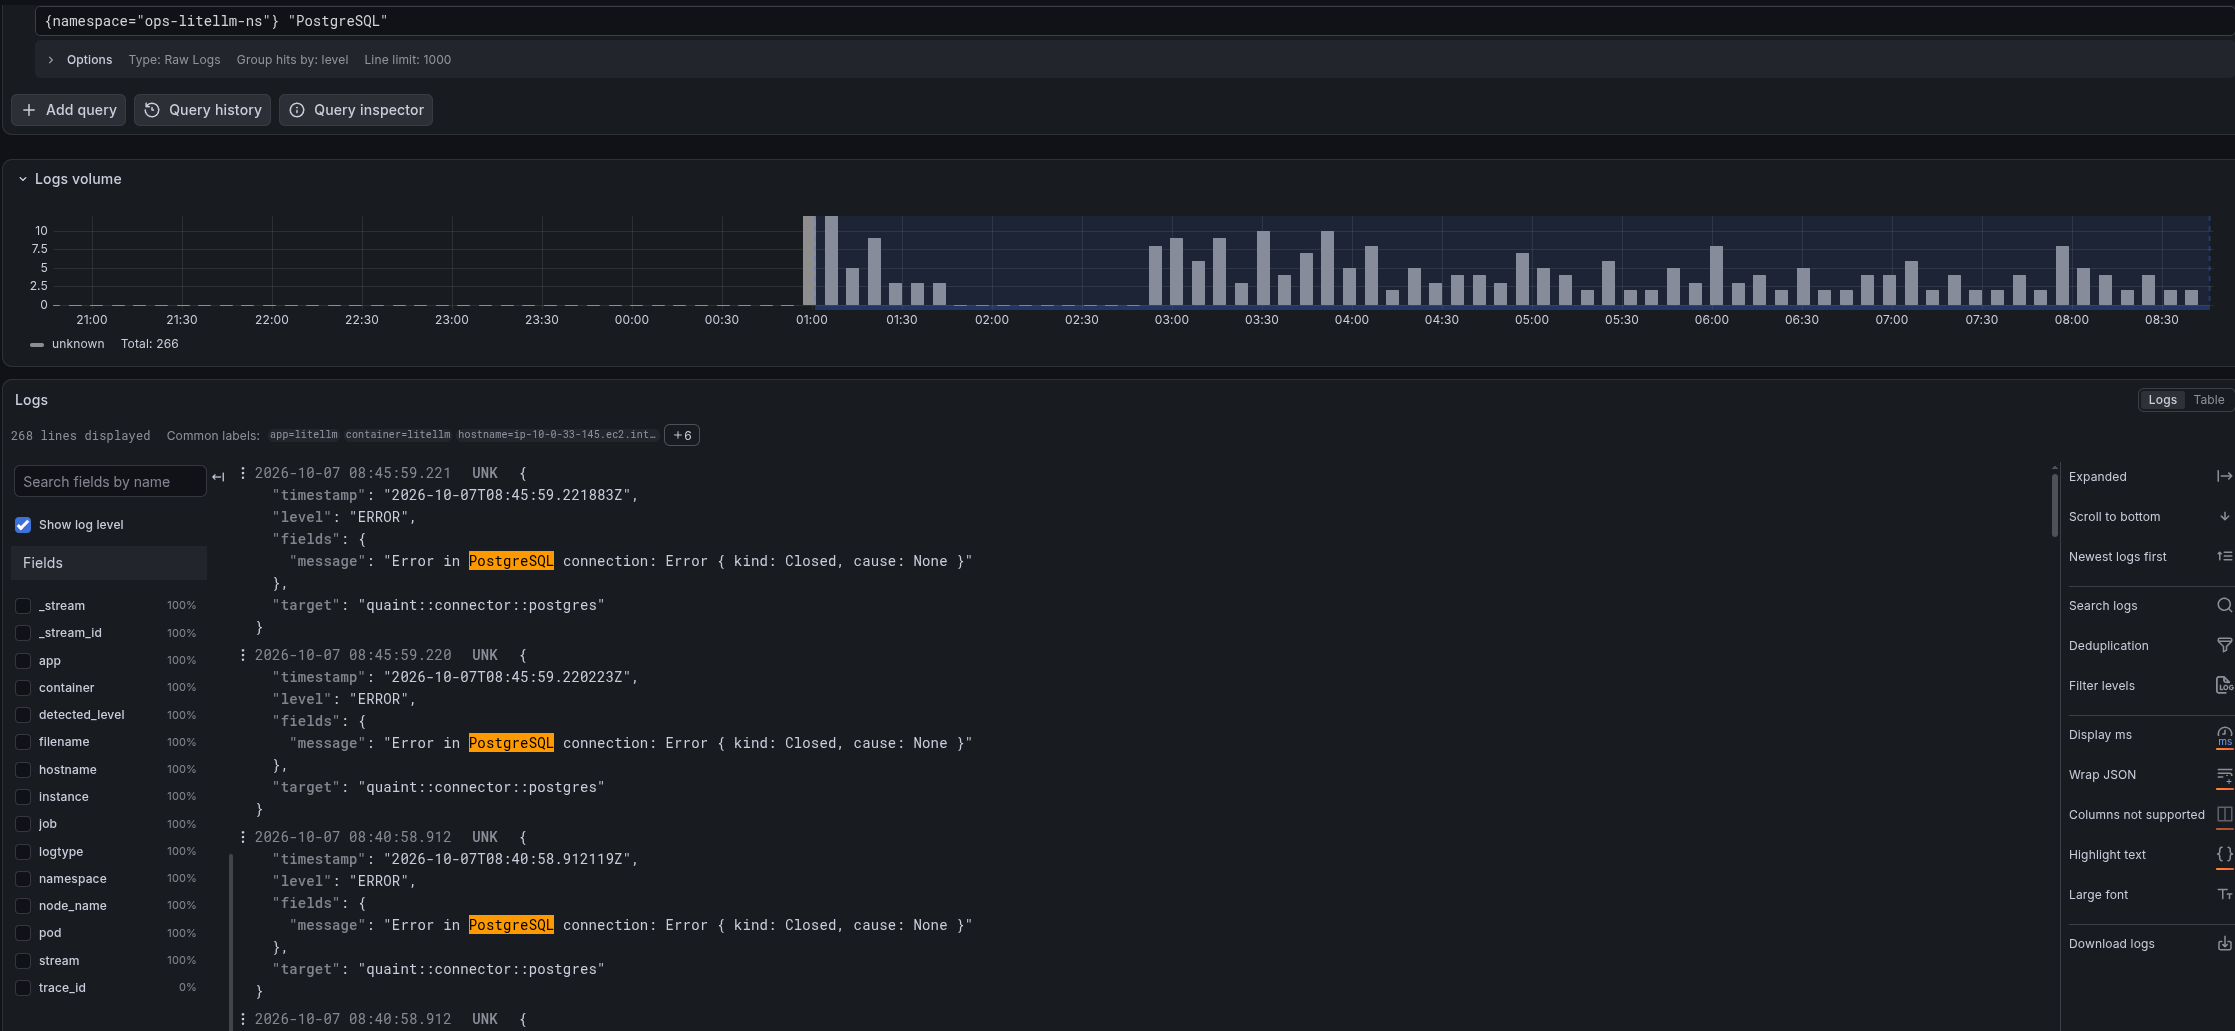
2026-10-07 08:05:57.169 unk {
  "timestamp": "2026-10-07T08:05:57.169121Z",
  "level": "ERROR",
  "fields": {
    "message": "Error in PostgreSQL connection: Error { kind: Closed, cause: None }"
  },
  "target": "quaint::connector::postgres"
}
And this also started at 01:00 UTC.
The problem is already pretty clear – something is happening during connections to RDS, which means we already know where to go next – time to check the state of the AWS RDS instance itself.
Debugging: AWS RDS “level”
And we didn’t have to look far – everything is immediately visible on the Aurora and RDS > Databases page, where “atlas-monitoring-ops-rds” is the instance that hosts the LiteLLM databases:
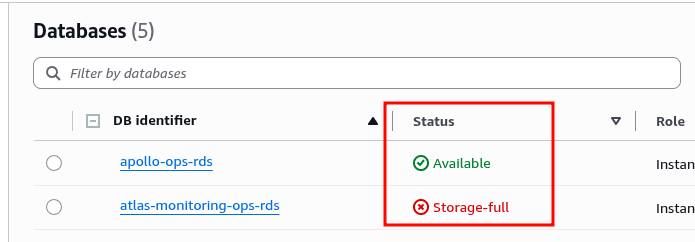
Why didn’t I see this in our monitoring? Because of the “specifics of a startup that’s still in MVP”: this RDS instance used to be used only for Grafana, so there is no proper monitoring for it.
Later we created LiteLLM databases on the same instance – but monitoring was “not a priority”. I did create a ticket for myself, but “never got around to it”.
And it’s also “funny” that I did enable Storage autoscaling when creating the instance – but:
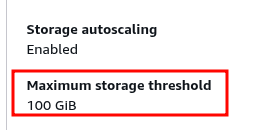
Fuck 🙂
Because, again – the limit was set back when the only database here was Grafana’s.
Fixing: AWS RDS Maximum storage threshold
What we need to do:
- increase the AWS RDS Maximum storage threshold
- finally set up proper monitoring for this RDS – but later
- add alerts from LiteLLM logs for PostgreSQL problems
The RDS itself is created with Terraform and terraform-aws-modules/rds/aws, which has the max_allocated_storage parameter – it was set to 100 GB here, let’s set it to 500:
module "monitoring_rds" {
  source  = "terraform-aws-modules/rds/aws"
  version = "~> 7.2.0"
  ...
  allocated_storage     = 20
  max_allocated_storage = 500
  ...
But before deploying, a “stop signal” kicks in – how will changing the storage settings of an existing EBS affect RDS? Will there be downtime or not? Because I’m about to increase max_allocated_storage, which should allow Storage Autoscaling to increase the current disk size.
And once again – let’s do this without an LLM.
RTFM! Read the documentation first.
And one more case where it’s useful to read the documentation yourself instead of just feeding the task to an agent – because I didn’t remember some of the limitations.
We Google “aws rds change storage autoscaling“, find Managing capacity automatically with Amazon RDS storage autoscaling and read:
Changing storage autoscaling settings doesn’t require a database reboot and doesn’t cause any downtime. The changes take effect immediately without disrupting database operations.
Okay.
One more nuance from the documentation:
Storage optimization has completed on the instance for the previous storage modification, and fewer than four storage modifications have occurred in the past 24 hours.
No more than 4 storage modifications (including storage size increases) in the last 24 hours – also OK.
I also found something interesting in Why does my Amazon RDS DB instance enter a storage-full state:
Note: If your DB instance is in the storage-full state, then you must first stop any data loads to the DB instance. This process can take a few minutes to several hours before the instance isn’t in a storage-full state.
So, if we have a lot of data being written – we need to stop new writes (this isn’t about stopping the RDS instance itself, but the jobs running against it).
The same applies to some large read-only queries that create a lot of temporary files (with ORDER BY, GROUP BY, etc).
Okay – in our case we can safely change it “live” – deploy, check the AWS Console – and the disk is already growing:

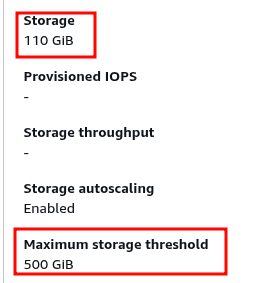
A couple of minutes later, done – the disk was 100 GB, now it’s 110, and Maximum has been updated too:
VictoriaLogs, Recording Rule and Alert
And finally, I want to add a Recording Rule for problems like this in LiteLLM – because its metric doesn’t explain what the actual problem is.
Our logs are written to VictoriaLogs, so the queries below use its LogsQL. I wrote about Recording Rules in VictoriaMetrics: Recording Rules for AWS Load Balancer logs and VictoriaLogs: creating Recording Rules with VMAlert.
We have the error text:
2026-10-07 08:05:57.169 unk {
  "timestamp": "2026-10-07T08:05:57.169121Z",
  "level": "ERROR",
  "fields": {
    "message": "Error in PostgreSQL connection: Error { kind: Closed, cause: None }"
  },
  "target": "quaint::connector::postgres"
}
And we have a set of fields:
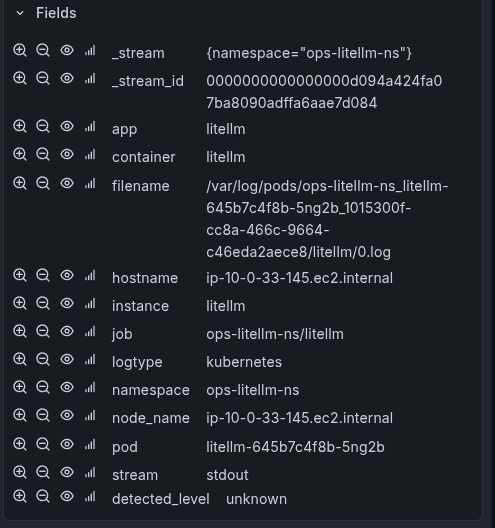
Let’s build the query – still without an LLM, but not from scratch either, because I already have a bunch of similar Recording Rules that (OMG!) I once wrote myself.
With unpack_json, let’s see what we get in fields:
app:="litellm" "PostgreSQL" | unpack_json
All the fields we need are there – we can even do without extract_regexp:
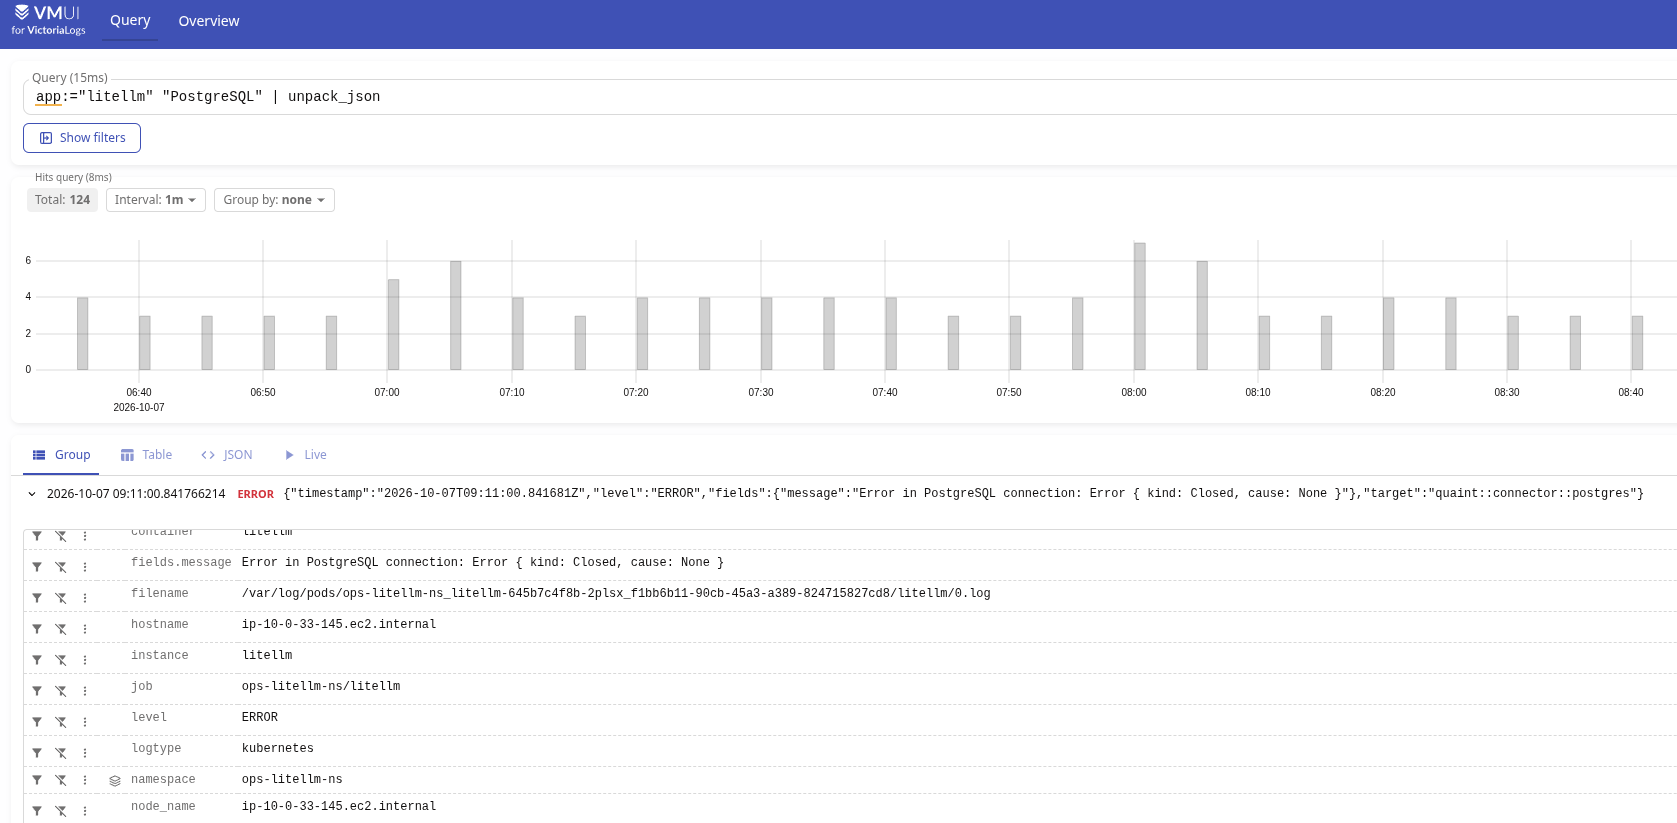
The useful fields here are:
level="ERROR": can be added to the general query filter to reduce the amount of work for VMAlertnamespace="ops-litellm-ns": will be useful in the alert itself, so we can immediately see in Slack which environment has the problem (because each environment has its own Kubernetes Namespace, and in general this is a standard field in our alerts)fields.message="Error in PostgreSQL connection: Error { kind: Closed, cause: None }": the error text itself, which we also want to send to Slack
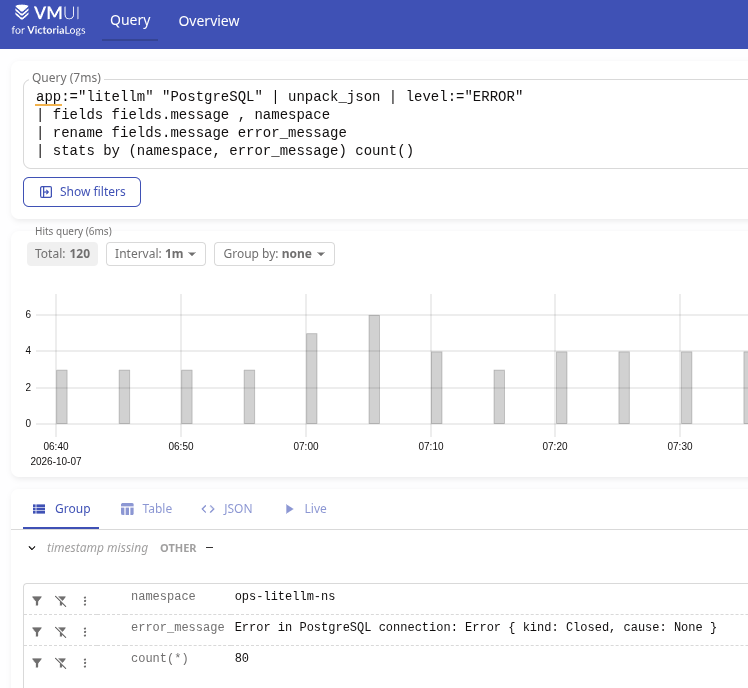
Let’s build the query:
app:="litellm" "PostgreSQL" | unpack_json | level:="ERROR"
| fields fields.message , namespace
| rename fields.message error_message
| stats by (namespace, error_message) count()
The only thing here is the error_message field: it will become a label in the metric, and if there are many different values here, we can run into a High Cardinality issue, see VictoriaMetrics: Churn Rate, High cardinality, metrics and IndexDB.
But in this particular case I don’t think we’ll get anything like that – so for now it’s OK, let’s leave it this way.
First, let’s test it in VM UI for VictoriaLogs:
Let’s define a new Recording Rule and a new vmlogs:litellm:logs:database_errors:count metric:
- record: vmlogs:litellm:logs:database_errors:count
  expr: |
    app:="litellm" "PostgreSQL" | unpack_json | level:="ERROR"
    | fields fields.message , namespace
    | rename fields.message error_message
    | stats by (namespace, error_message) count()
And add an alert:
# PostgreSQL database errors detected in logs
- alert: LiteLLM PostgreSQL Database Error Detected
  expr: vmlogs:litellm:logs:database_errors:count > 0
  for: 0m
  labels:
    component: devops
    environment: ops
    severity: critical
    ilert_routingkey: devops-ops-critical
  annotations:
    summary: LiteLLM PostgreSQL database error detected
    description: |-
      LiteLLM reported a PostgreSQL database error during the latest recording rule evaluation.
      **Events**: `{{ "{{" }} printf "%.0f" $value }}`
      **Namespace**: `{{ "{{" }} $labels.namespace }}`
      **Error message**:
      ```
      {{ "{{" }} $labels.error_message }}
      ```
      :grafana: [LiteLLM System overview](https://{{ $.Values.monitoring.root_url }}/d/adtt9jj/adrmshg/litellm-system-overview)
Let’s wait for it to fire and see what else needs to be tuned in the Recording Rule or the alert.
And finally: there’s still some special, slightly forgotten kind of joy in finding and fixing a problem in this kind of “manual mode”, instead of just giving the task to an LLM and an agent that will do everything on its own.
Although I did still throw the text of this post into GPT 5.6 Sol for proofreading 🙂 It’s good at catching all kinds of typos and punctuation mistakes.
