We continue the migration from Grafana Loki to VictoriaLogs, and the next task is to transfer Recording Rules from Loki to VictoriaLogs and update the alerts.
Recording Rules and integration with VMAlert were brought to VictoriaLogs relatively recently, and I haven’t tested this scheme yet.
Therefore, we will first do everything by hand to see how it works, what are the nuances, and then we will update the Helm chart, which is used to deploy my Monitoring Stack, and add new Recording Rules to it.
So, what’s on today’s agenda:
- install VMAlert from the Helm chart in Kubernetes
- rewrite a Loki LogQL query to VictoriaLogs LogsQL query
- create a VMAlert Recording Rule to generate metrics from logs
- test how to generate alerts from logs and Recording Rules
- and see how this scheme can be integrated into the existing VictoriaMetrics stack
Previous posts by VictoriaLogs:
- VictoriaLogs: an overview, run in Kubernetes, LogsQL, and Grafana
- VictoriaLogs: a Grafana dashboard for AWS VPC Flow Logs – migrating from Grafana Loki
- Vector.dev: introduction, AWS S3 logs, and integration with VictoriaLogs
See also:
- about Recording Rules for Loki – Grafana Loki: performance optimization with Recording Rules, caching, and parallel queries та Grafana Loki: LogQL and Recording Rules for metrics from AWS Load Balancer logs
- about my Helm chart for my Monitoring stack – VictoriaMetrics: deploying a Kubernetes monitoring stack
Contents
VictoriaLogs, Recording Rules, and VMAlert
So, here’s the idea:
- VMAlert can make queries to VictoriaLogs
- in these queries, it executes some
expr– as in regular alerts - based on the results of these requests, VMAlert either generates a metric – if it is a Recording Rule – and records it in VictoriaMetrics or Prometheus, or generates an alert – if it is an Alert
That is, it’s the same scheme as in Loki, and we can use metrics from Recording Rule not only for alerts, but also in Grafana dashboards.
As always, VictoriaMetrics has excellent documentation:
- VMAlert integration with VictoriaLogs – VictoriaMetrics / VictoriaLogs / vmalert
- about VMAlert and VMRules – Rules
Running VMAlert in Kubernetes using Helm чарту
I already have a fully deployed VictoriaMetrics stack and the rest of the monitoring with my own chart, but now we’ll launch VMAlert separately from it, because there is a point with how VMAlert makes requests to VictoriaMetrics and VictoriaLogs – we’ll take a loot at that later.
The chart itself is here: victoria-metrics-alert.
To deploy it, we need the following parameters:
datasource.url: VictoriaLogs address – to whom to make queriesnotifier.url: Alertmanager address – where to send alertsremoteWrite.url: VictoriaMetrics/Prometheus address – where we write metrics and alert statusremoteRead.url: VictoriaMetrics/Prometheus address – where we read the state of alerts when VMAlert restarts
Generate a values.yaml file:
$ helm show values vm/victoria-metrics-alert > vmalert-test-values.yaml
Finding the necessary Kubernetes Services:
$ kk -n ops-monitoring-ns get svc | grep 'alertmanager\|logs\|vmsingle'
atlas-victoriametrics-victoria-logs-single-server      ClusterIP   None             <none>        9428/TCP                     116d
vmalertmanager-vm-k8s-stack                            ClusterIP   None             <none>        9093/TCP,9094/TCP,9094/UDP   138d
vmsingle-vm-k8s-stack                                  ClusterIP   172.20.89.111    <none>        8429/TCP                     138d
Edit the vmalert-test-values.yaml:
...
  # VictoriaLogs Svc
  datasource:
    url: "http://atlas-victoriametrics-victoria-logs-single-server:9428"
...
  # Alertmanager Svc
  notifier:
    alertmanager:
      url: "http://vmalertmanager-vm-k8s-stack:9093"
...
  # VictoriaMetrics/Prometheus Svc
  remote:
    write:
      url: "http://vmsingle-vm-k8s-stack:8429"
...
    read:
      url: "http://vmsingle-vm-k8s-stack:8429"
...
Deploy the chart:
$ helm -n ops-monitoring-ns upgrade --install vmalert-test vm/victoria-metrics-alert -f vmalert-test-values.yaml
Check a Kubernetes Pod with VMalert:
$ kk -n ops-monitoring-ns get pod | grep vmalert-
vmalert-test-victoria-metrics-alert-server-6f485dc8b-tgcfd        1/1     Running     0             36s
vmalert-vm-k8s-stack-7d5bd6f955-dgx2r                             2/2     Running     0             47h
Here, the vmalert-vm-k8s-stack-7d5bd6f955-dgx2r – is my “default” VMAlert instance, and vmalert-test-victoria-metrics-alert-server – out new testing VMAlert.
Rewriting Grafana Loki LogQL query => VictoriaLogs LogsQL query
In Grafana Loki, I have such a Recording Rule:
kind: ConfigMap
apiVersion: v1
metadata:
  name: loki-alert-rules
data:
  rules.yaml: |-
    groups:
...
      - name: EKS-Pods-Metrics

        rules:

        - record: eks:pod:backend:api:path_duration:avg
          expr: |
            topk (10,
                avg_over_time (
                    {app="backend-api"} | json | regexp "https?://(?P<domain>([^/]+))" | line_format "{{.path}}: {{.duration}}"  | unwrap duration [5m]
                ) by (domain, path, node_name)
            )
...
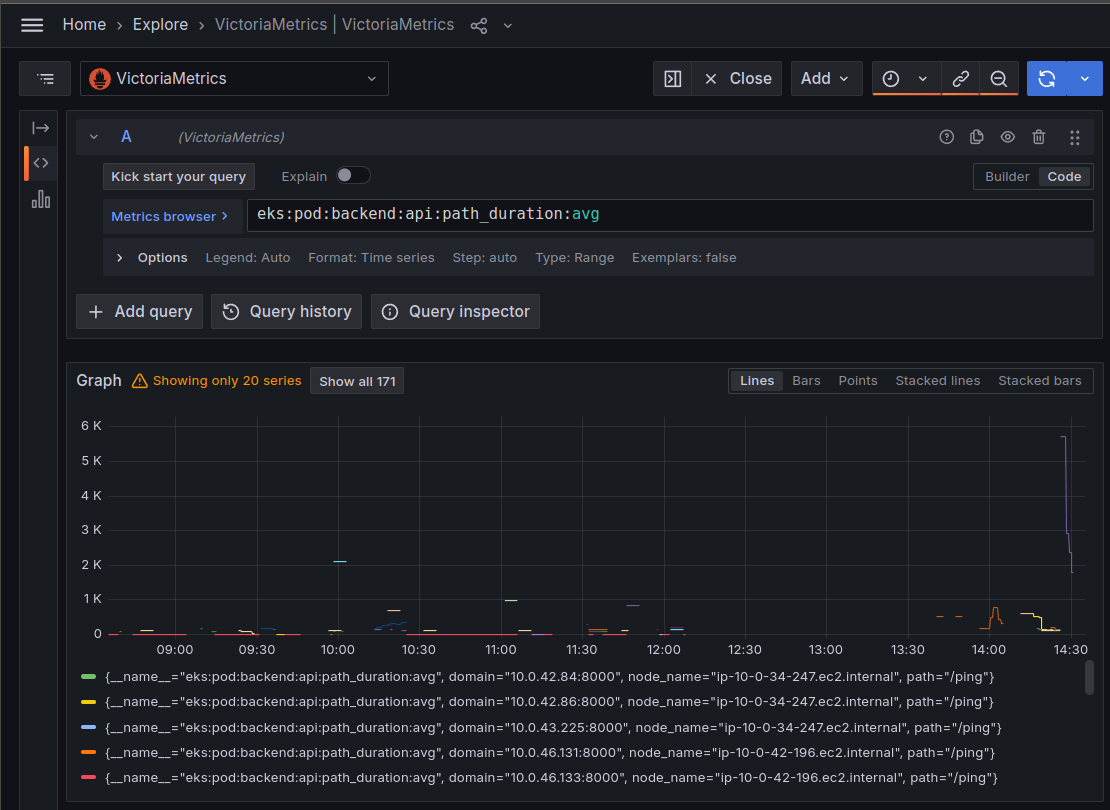
It reads the logs from Kubernetes Pods of our Backend API, creates a new domain field from each record, and uses the existing path and duration fields in the logs.
And then, for each domain, path, node_name, it calculates an average duration of requests.
To make a similar query with VictoriaLogs LogsQL, we need to:
- select logs with
app:="backend-api" - create a
domainfield - get the values of
pathandduration - calculate the mean (average) for 5 minutes from the
durationfield - group the result by the fields
domain,path,node_name
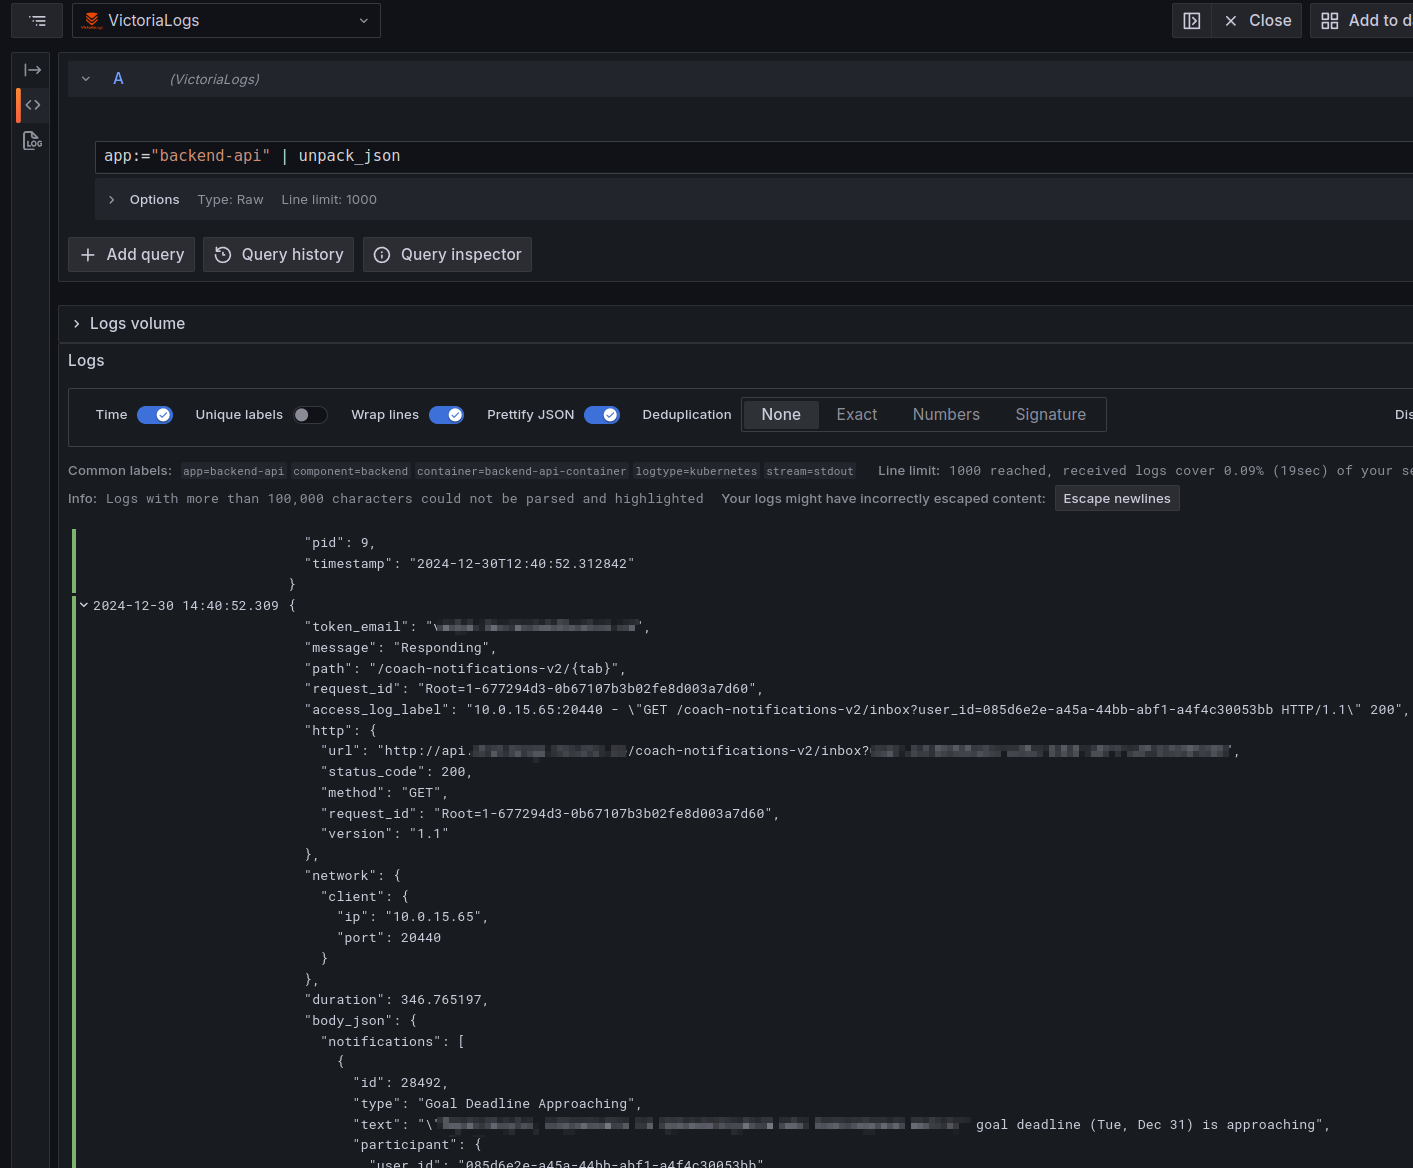
Let’s find the logs in VictoriaLogs:
Next:
- add
unpack_json, because the logs are written in JSON – we can parse it and create new fields - add a filter on the
http.urlfield, because some of the logs either do not have a URL at all, or there is a Kubernetes Pods address in the form of http://10.0.32.14:8080/ping – all kinds of Liveness && Readiness Probes that we are not interested in - use
extract_regexpto create a newdomainfield from the_msgfield - we have too many fields here, and we don’t need all of them, so use the
fieldspipe, and leave only those we will use further - we can add a filter
path:~".+"to skip all records with an emptypath
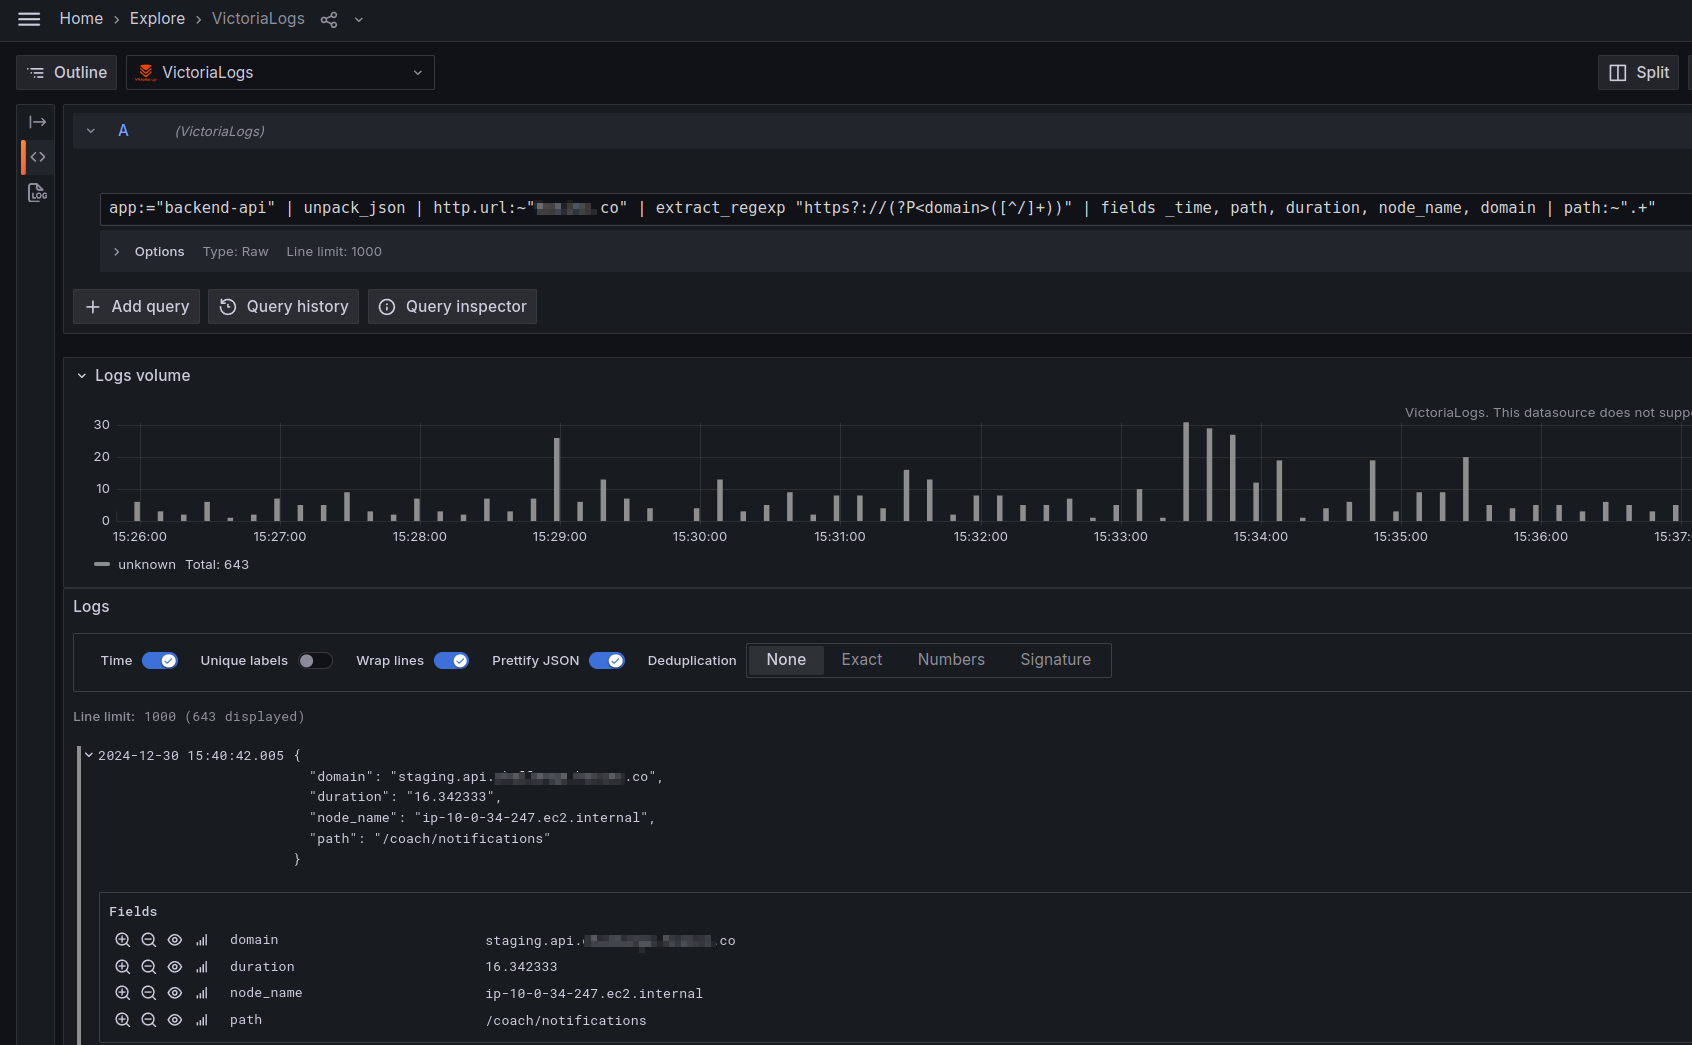
app:="backend-api" | unpack_json | http.url:~"example.co" | extract_regexp "https?://(?P<domain>([^/]+))" | fields _time, path, duration, node_name, domain | path:~".+"
Instead of using the http .url:~"example.co" filter, we can use the Sequence filter in the form http.url:seq("example.co"), but I didn’t see any difference in the request execution speed:
In fact, for a better performance it’s better to move the http.url:~"example.co" filter to the beginning of the request, right after the stream selector app:="backend-api", and simplify it to just Word filter “example.co” – but I’ve already made screenshots, so OK, let’s let it be like that, then we’ll do it right.
Now we have the records we need, we have the fields we need, and we can move on.
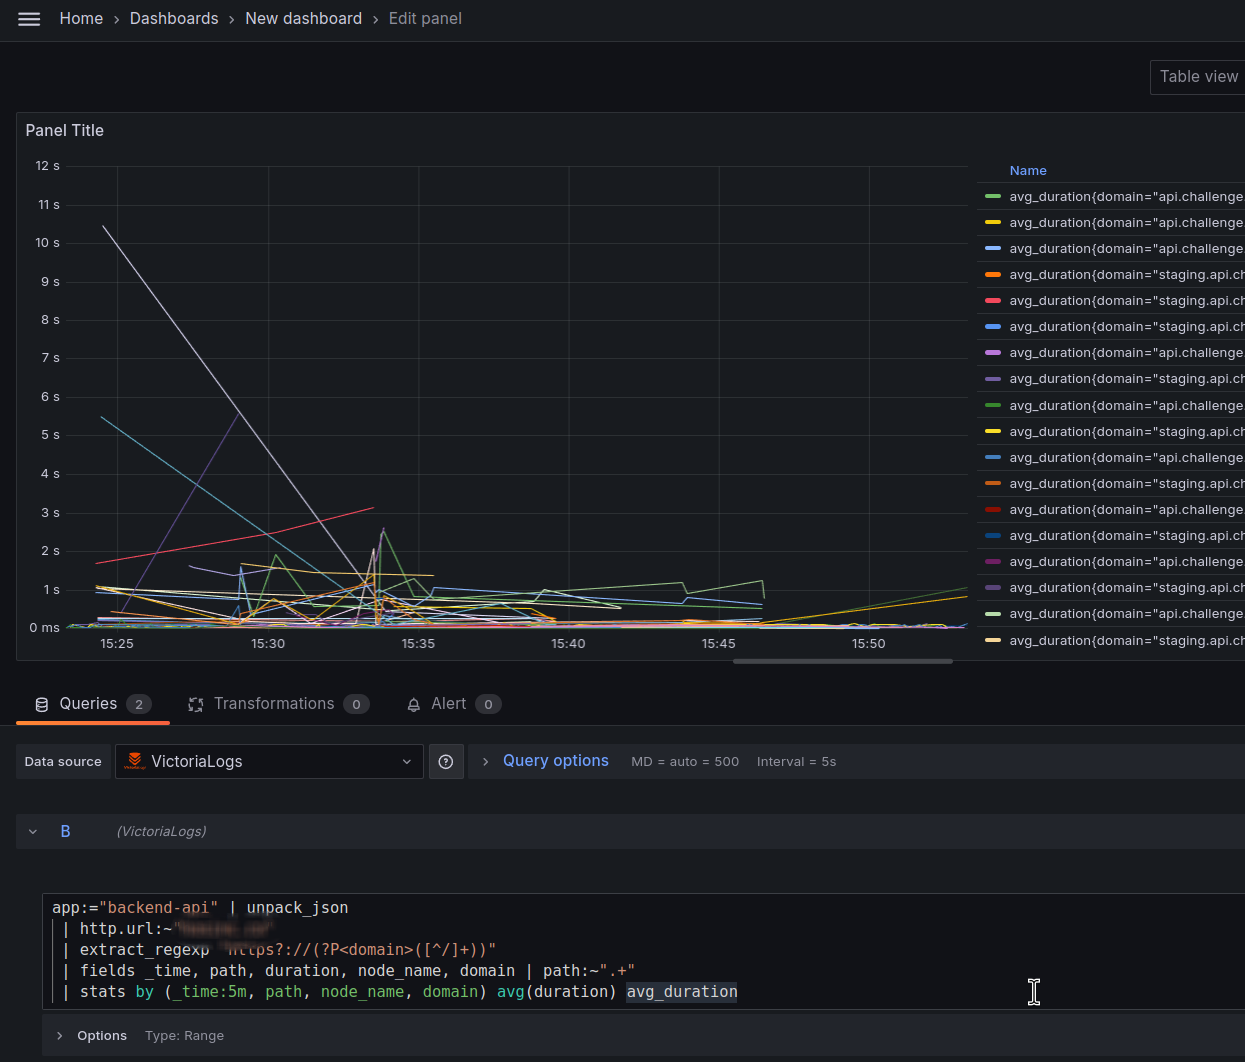
Next, we need a stats pipe with the stats pipe function avg() for 5 minutes from the value in the duration field.
Add the | stats by (_time:5m, path, node_name, domain) avg(duration) avg_duration expression to the request.
Here it is better to use Time series visualization in Grafana dashboard:
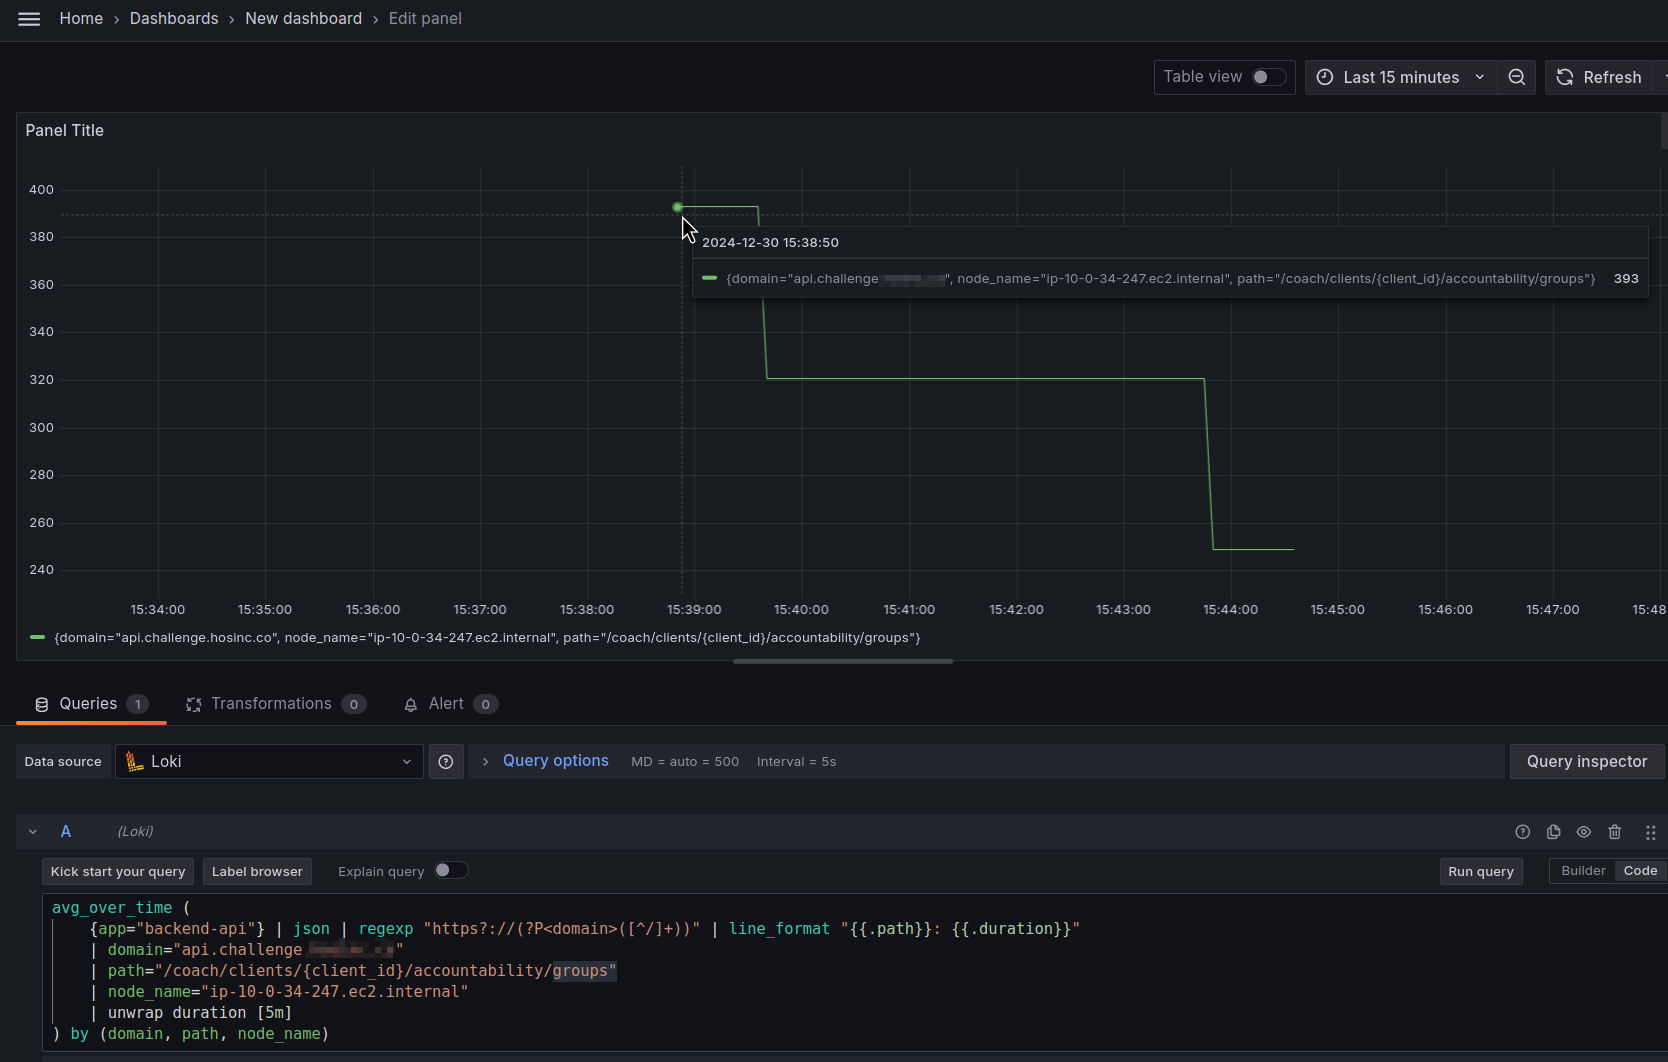
And let’s compare the result from the Loki by a specific domain, a node, and a URI.
In Loki, the result will be as follows:
avg_over_time (
    {app="backend-api"} | json | regexp "https?://(?P<domain>([^/]+))" | line_format "{{.path}}: {{.duration}}"
    | domain="api.challenge.example.co"
    | path="/coach/clients/{client_id}/accountability/groups"
    | node_name="ip-10-0-34-247.ec2.internal"
    | unwrap duration [5m]
) by (domain, path, node_name)
And in VictoriaLogs:
The value is “393” in both cases.
Good!
Now we can actually move on to Recording Rules.
Creating VictoriaLogs Recording Rules and Alerts
To add Recording Rules to the VMAlert chart values, there is a config.alerts.groups block where we can describe either the Recording Rule with the record type, or an Alert with the alert type.
Creating a Recording Rule
First, let’s try a Recording Rule.
Add record:vmlogs:eks:pod:backend:api:path_duration:avg to our vmalert-test-values.yaml file:
...
  # -- VMAlert alert rules configuration.
  # Use existing configmap if specified
  configMap: ""
  # -- VMAlert configuration
  config:
    alerts:
      groups:
        - name: VmLogsEksPodsMetrics
          type: vlogs
          interval: 15s
          rules:
            - record: vmlogs:eks:pods:backend:api:path_duration:avg
              expr: |
                app:="backend-api" | unpack_json
                | http.url:~"example.co"
                | extract_regexp "https?://(?P<domain>([^/]+))"
                | fields _time, path, duration, node_name, domain | path:~".+"
                | stats by (_time:5m, path, node_name, domain) avg(duration) avg_duration
...
Let’s deploy it and see the logs of the test VMAlert:
$ ktail -n ops-monitoring-ns -l app.kubernetes.io/instance=vmalert-test
...
vmalert-test-victoria-metrics-alert-server-6469894c78-cmktk:vmalert {"ts":"2024-12-30T14:21:43.815Z","level":"info","caller":"VictoriaMetrics/app/vmalert/rule/group.go:486","msg":"group \"VmLogsEksPodsMetrics\" started; interval=15s; eval_offset=<nil>; concurrency=1"}
...
group \"VmLogsEksPodsMetrics\" started; – ОК.
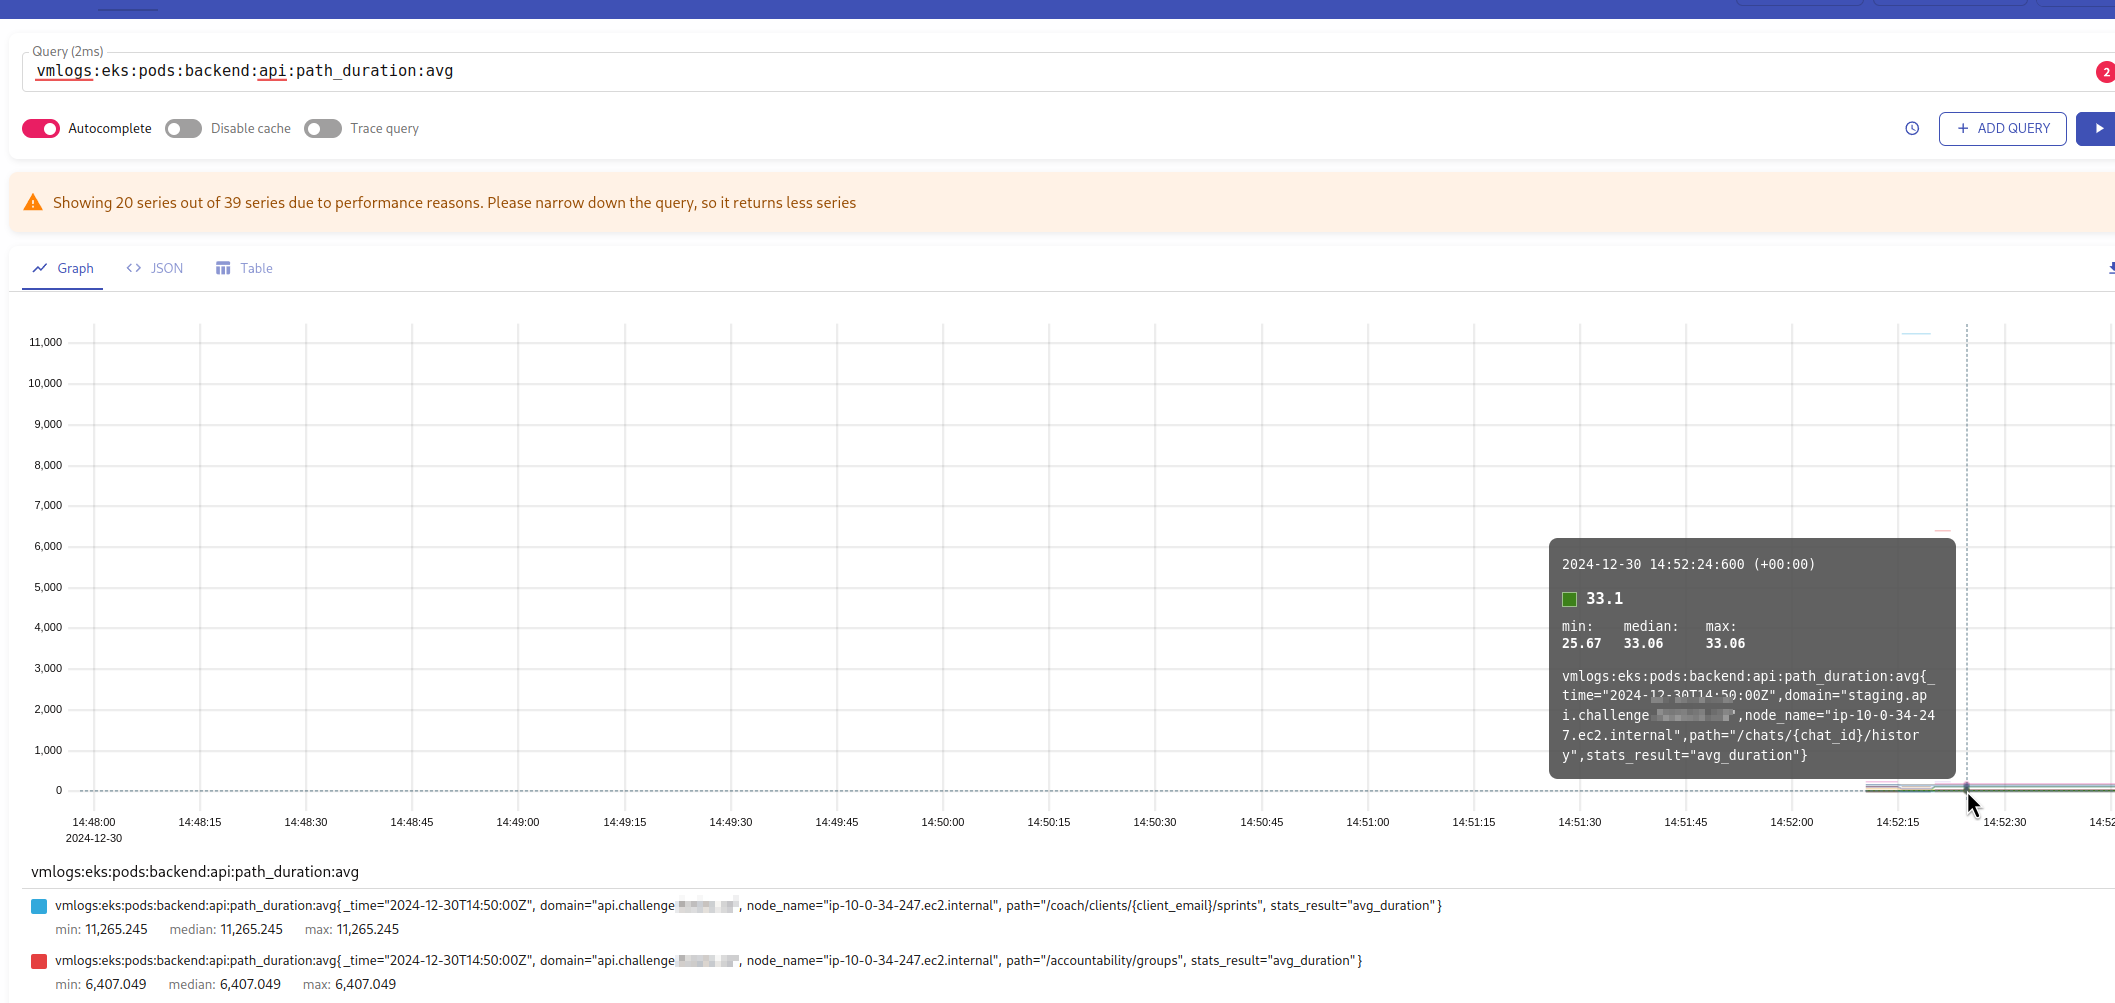
Check the vmlogs:eks:pods:backend:api:path_duration:avg metric in VMSingle:
Yay!
It works!
Creating an Alert
We can add alerts in two ways:
- we can describe a new alert directly in the chart values of a new VMAlert, which will query VictoriaLogs directly
- or, since we have a Recording Rule that creates a metric, we can create a regular VMRule that will be processed by the operator and passed to the “default” VMAlert
Let’s try both ways.
First, let’s add an alert to the vmalert-test-values.yaml file, next to our Recording Rule, in the alert name specify a “Raw” postfix:
...
  config:
    alerts:
      groups:
        - name: VmLogsEksPodsMetrics
          type: vlogs
          interval: 5s
          rules:

            - record: vmlogs:eks:pods:backend:api:path_duration:avg
              expr: |
                app:="backend-api" | unpack_json
                | http.url:~"example.co"
                | extract_regexp "https?://(?P<domain>([^/]+))"
                | fields _time, path, duration, node_name, domain | path:~".+"
                | stats by (_time:5m, path, node_name, domain) avg(duration) avg_duration

            - alert: Test API Path duration Raw
              expr: |
                app:="backend-api" | unpack_json
                | http.url:~"example.co"
                | extract_regexp "https?://(?P<domain>([^/]+))"
                | fields _time, path, duration, node_name, domain | path:~".+"
                | stats by (_time:5m, path, node_name, domain) avg(duration) as avg_duration
              for: 1s
              labels:
                severity: warning
                component: backend
                environment: dev
              annotations:
                summary: 'Test API Path duration Raw'
                description: |-
                  Request duration is too slow
                  *Domain Name*: `{{ $labels.domain }}`
                  *URI*: `{{ $labels.path }}`
                  *Duration*: `{{ $value | humanize }}`
                grafana_alb_overview_url: 'https://monitoring.ops.example.co/d/aws-alb-oveview/aws-alb-oveview?from=now-1h&to=now&var-domain={{ $labels.domain }}'
                tags: backend
...
Deploy the Helm chart with this new alert:
$ helm -n ops-monitoring-ns upgrade --install vmalert-test vm/victoria-metrics-alert -f vmalert-test-values.yaml
Now let’s create a file with a VMRule with a similar alert, but from the metric created by our Recording Rule – add a “VMSingle” postfix to the alert name:
apiVersion: operator.victoriametrics.com/v1beta1
kind: VMRule
metadata:
  name: alerts-vmlogs-test
spec:

  groups:

    - name: VMAlertVMlogsTest
      rules:
        - alert: Test API Path duration VMSingle
          expr: vmlogs:eks:pods:backend:api:path_duration:avg > 0
          for: 1s
          labels:
            severity: warning
            component: backend
            environment: dev
          annotations:
            summary: 'Test API Path duration VMSigle'
            description: |-
              Request duration is too slow
              *Domain Name*: `{{ $labels.domain }}`
              *URI*: `{{ $labels.path }}`
              *Duration*: `{{ $value | humanize }}`
            grafana_alb_overview_url: 'https://monitoring.ops.example.co/d/aws-alb-oveview/aws-alb-oveview?from=now-1h&to=now&var-domain={{ $labels.domain }}'
            tags: backend
Deploy it:
$ kk -n ops-monitoring-ns apply -f test-alert.yaml
vmrule.operator.victoriametrics.com/alerts-vmlogs-test created
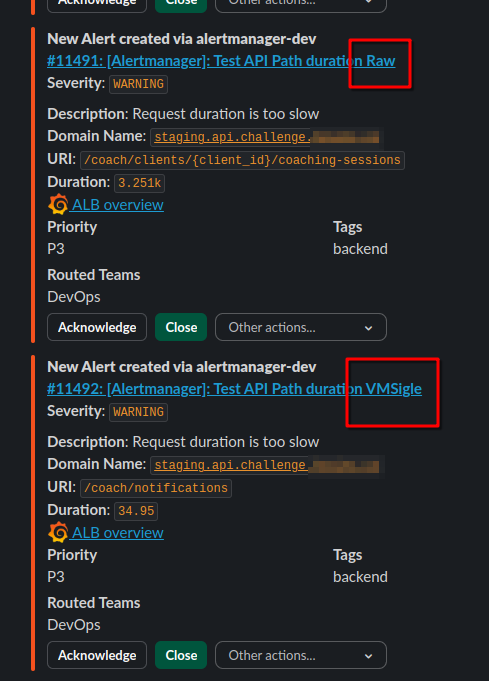
And wait for notifications from Alertmanager in Slack:
Good!
It works.
Now we can move this configuration to the general Helm-chart of our monitoring.
VictoriaLogs, VMAlert, and the victoria-metrics-k8s-stack Helm chart
So, in my project, we have our own chart, in which subcharts are installed through Helm dependencies:
apiVersion: v2
name: atlas-victoriametrics
description: A Helm chart for Atlas Victoria Metrics Kubernetes monitoring stack
type: application
version: 0.1.1
appVersion: "1.17.0"
dependencies:
- name: victoria-metrics-k8s-stack
  version: ~0.31.0
  repository: https://victoriametrics.github.io/helm-charts
- name: victoria-metrics-auth
  version: ~0.8.0
  repository: https://victoriametrics.github.io/helm-charts
  condition: victoria-metrics-auth.enabled
- name: victoria-logs-single
  version: ~0.8.0
  repository: https://victoriametrics.github.io/helm-charts
...
And then in values.yaml I have the parameters for each of them.
VMAlert: datasource.url, VictoriaMetrics, and VictoriaLogs
What we need to do is to add the VMAlert integration with VictoriaLogs here, but there is a caveat: VMAlert can have only one datasource.url parameter, which currently contains the Kubernetes Service with VMSingle – where VMAlert takes metrics to calculate the conditions of existing alerts:
$ kk -n ops-monitoring-ns describe pod vmalert-vm-k8s-stack-7d5bd6f955-m6mz4
...
Containers:
  vmalert:
    ...
    Args:
      -datasource.url=http://vmsingle-vm-k8s-stack.ops-monitoring-ns.svc.cluster.local.:8429
...
But we need to specify the address of VictoriaLogs, and at the same time leave the possibility of queries to VMSingle.
In the VictoriaLogs How to use one vmalert for VictoriaLogs and VictoriaMetrics rules at the same time? documentation there are two suggested solutions:
- either just have two separate VMAlert instances – one for metrics from VictoriaLogs, and one for working with VictoriaLogs
- or use the VMAuth service, and depending on the request URI from VMAlert, it will route requests to the desired backend – either VictoriaMetrics/VMSingle or VictoriaLogs
Option 1: two VMAlert instances
The first option is to run two VMAlerts, and pass each one its own datasource.url.
But there is a question – how do I pass Recording Rules and Alerts to different VMAlerts?
Because my Alerts are described through VMRules resources, which are written from VictoriaMetrics Operator to a ConfigMap, which is then connected to my “default” VMAlert instance:
$ kk -n ops-monitoring-ns describe pod vmalert-vm-k8s-stack-7d5bd6f955-m6mz4
...
Volumes:
  ...
  vm-vm-k8s-stack-rulefiles-0:
    Type:      ConfigMap (a volume populated by a ConfigMap)
    Name:      vm-vm-k8s-stack-rulefiles-0
...
And this ConfigMap contains all the alerts:
$ kk get cm vm-vm-k8s-stack-rulefiles-0 -o yaml | head -n 30
apiVersion: v1
data:
  ops-monitoring-ns-alerts-alertmanager.yaml: |
    groups:
    - name: VM.Alertmanager.rules
      rules:
      - alert: Alertmanager Failed To Send Alerts
        annotations:
          description: |-
            Alertmanager failed to send {{ $value | humanizePercentage }} of notifications
            *Kubernetes cluster*: `{{ $labels.cluster }}`
            *Pod*: `{{ $labels.pod }}`
            *Integration*:  `{{ $labels.integration }}`
          summary: Alertmanager Failed To Send Alerts
          tags: devops
        expr: |-
          sum(
            rate(alertmanager_notifications_failed_total [5m])
            /
            rate(alertmanager_notifications_total [5m])
          ) by (cluster, integration, pod)
          > 0.01
        for: 1m
        labels:
          component: devops
          environment: ops
          severity: warning
  ops-monitoring-ns-alerts-aws-alb.yaml: |
    groups:
    - name: AWS.ALB.Logs.rules
If we make a solution with the two VMAlert instances with different datasource.url, then for the instance that will make requests to VictoriaLogs we need to create its own ConfigMap, and mount it from the VMAlert instance’s values, without VMRules and the participation of the VM Operator.
Although technically, it is probably possible to have VMRules with Recording Rules and Alerts and two VMAlert instances, where each instance will have the same ConfigMap with both RecordingRules and Alerts mapped to it – but then one VMAlert will constantly write about errors in requests to VictoriaMetrics, and the other will write about errors about requests to VictoriaLogs.
Therefore, I can only see an option with a separate ConfigMap for RecordingRules, and a separate VMRules for alerts, as it is now.
I don’t really like this idea because I would like to describe both RecordingRules and Alerts through VMRules.
OK, then let’s consider another option – with the VMAuth.
Option 2: VMAuth and src_paths
The second option is to redirect requests from a single instance of VMAlert to VictoriaLogs and VictoriaMetrics/VMSingle via VMAuth.
I already have VMAuth, I wrote about it in the VictoriaMetrics: VMAuth – Proxy, Authentication, and Authorization post, with an authentication and some routes configured, I use it to access some internal resources when I’m too lazy to do the kubectl port-forward.
What we need to do is add a few more src_paths:
/api/v1/query.*– for queries to VictoriaMetrics/VMSingle/select/logsql/.*– for queries to VictoriaLogs
Then, in my case, everything together will look like this:
apiVersion: v1
kind: Secret
metadata:
  name: vmauth-config-secret
stringData:
  auth.yml: |-
    users:
    - username: vmadmin
      password: {{ .Values.vmauth_password }}
      url_map:
      - src_paths:
        - /alertmanager.*
        url_prefix: http://vmalertmanager-vm-k8s-stack.ops-monitoring-ns.svc:9093
      - src_paths:
        - /vmui.*
        url_prefix: http://vmsingle-vm-k8s-stack.ops-monitoring-ns.svc:8429
      - src_paths:
        - /prometheus.*
        url_prefix: http://vmsingle-vm-k8s-stack.ops-monitoring-ns.svc:8429
      - src_paths:
        - /api/v1/query.*
        url_prefix: http://vmsingle-vm-k8s-stack:8429
      - src_paths:
        - /select/logsql/.*
        url_prefix: http://atlas-victoriametrics-victoria-logs-single-server:9428
      default_url:
        - http://vmalertmanager-vm-k8s-stack.ops-monitoring-ns.svc:9093
This Secret is passed to the values for VMAuth:
...
victoria-metrics-auth:
  ingress:
    enabled: true
  ...
  secretName: vmauth-config-secret
...
If you don’t use VMAuth, or if it works without a password, it’s easier, because you can just set datasource.url for VMAlert.
If you need authentication, we’ll add another Kubernetes Secret with a username and password for VMAuth access:
apiVersion: v1
kind: Secret
metadata:
  name: vmauth-password
stringData:
  username: vmadmin
  password: {{ .Values.vmauth_password }}
Next, add datasource.url and datasource.basicAuth in the VMAlert values:
...
  vmalert:
    annotations: {}
    enabled: true
    spec:
      datasource:
        basicAuth:
          username:
            name: vmauth-password
            key: username
          password:
            name: vmauth-password
            key: password
        url: http://atlas-victoriametrics-victoria-metrics-auth:8427
...
Here:
- the
specfield for VMAlert is described inVMAlertSpecand has adatasourcefield- the
datasourcefield is described in theVMAlertDatasourceSpecand has thebasicAuthandurlfields- the
basicAuthfield is described inbasicauthand has two fields –passwordandusername- the
passwordandusernamefields are described in the SecretKeySelector, and have two fields –nameandkey- the
namefield: a name of the Kubernetes Secret - the
keyfield: a key the Kubernetes Secret
- the
- the
- the
- the
Deployed the changes, and now our VMAlert sends requests to VMAuth, and VMAuth redirects them to url_prefix: http://vmsingle-vm-k8s-stack:8429.
Adding a VMRule with a Recording Rule
Now let’s add a new VMRule in which we will describe a Recording Rule, in which we will generate a vmlogs:eks:pods:backend:api:path_duration:avg metric:
apiVersion: operator.victoriametrics.com/v1beta1
kind: VMRule
metadata:
  name: vmlogs-alert-rules
spec:

  groups:

    - name: VM-Logs-Backend-Pods-Logs
      # an expressions for the VictoriaLogs datasource
      type: vlogs
      rules:
        - record: vmlogs:eks:pods:backend:api:path_duration:avg
          expr: |
            app:="backend-api" "example.co" | unpack_json
            | extract_regexp "https?://(?P<domain>([^/]+))"
            | fields _time, path, duration, node_name, domain | path:~".+"
            | stats by (_time:5m, path, node_name, domain) avg(duration) avg_duration
Deploy, check the new VMRule:
$ kk get vmrule | grep vmlogs
vmlogs-alert-rules                                      4s
And VMAlert logs – new group created:
$ ktail -l app.kubernetes.io/name=vmalert
...
vmalert-vm-k8s-stack-6c5cb6d76d-dxpbf:vmalert 2025-01-08T13:30:43.609Z  info    VictoriaMetrics/app/vmalert/rule/group.go:486   group "VM-Logs-Backend-Pods-Logs" will start in 1.540718685s; interval=15s; eval_offset=<nil>; concurrency=1
vmalert-vm-k8s-stack-6c5cb6d76d-dxpbf:vmalert 2025-01-08T13:30:45.151Z  info    VictoriaMetrics/app/vmalert/rule/group.go:486   group "VM-Logs-Backend-Pods-Logs" started; interval=15s; eval_offset=<nil>; concurrency=1
...
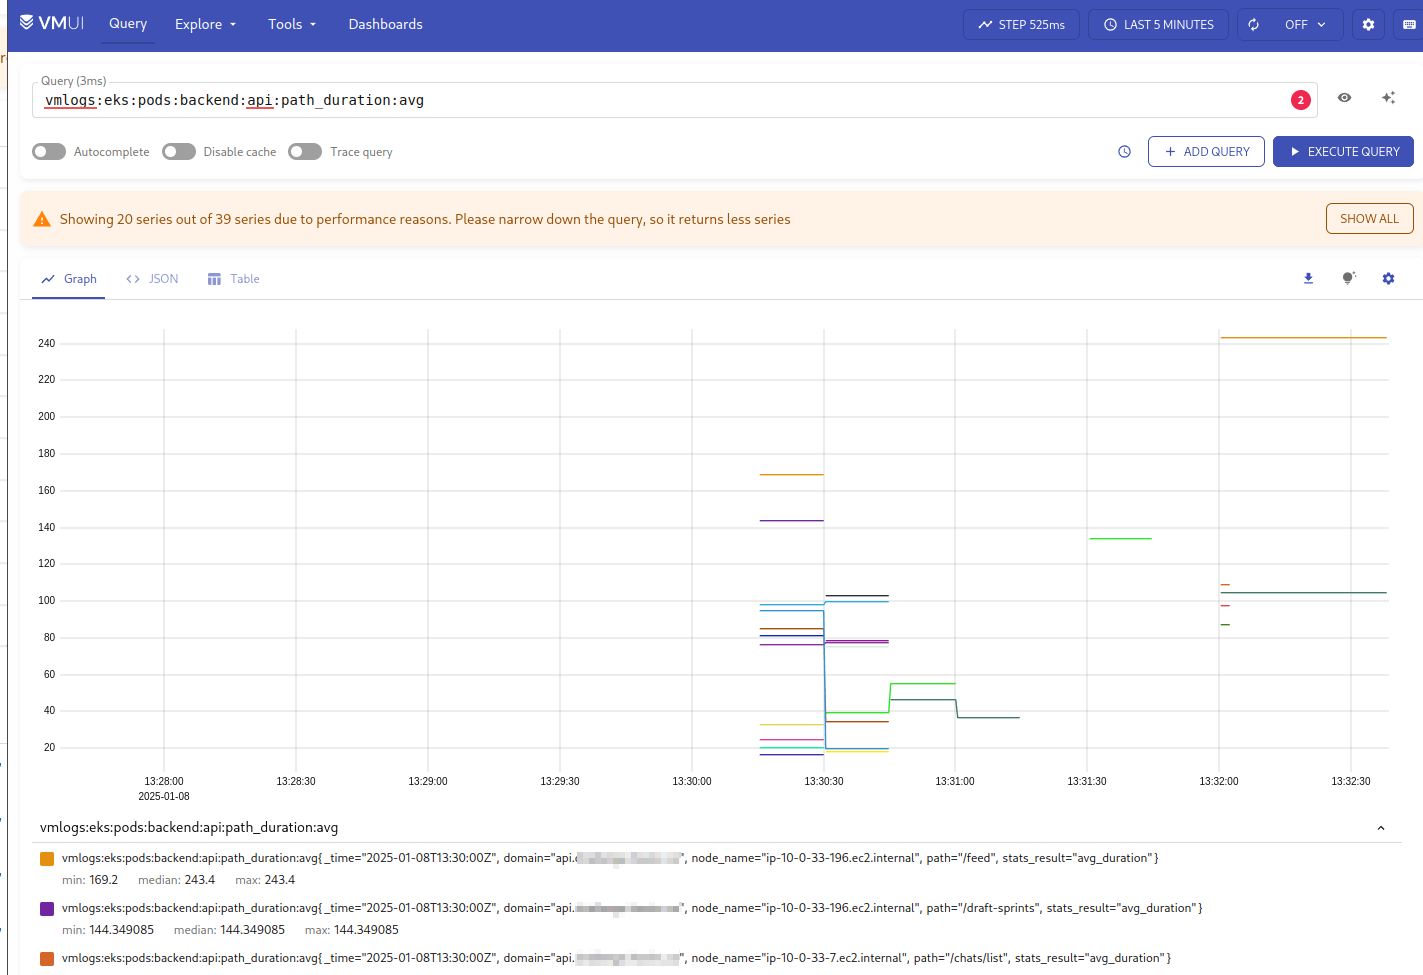
And check the new metric in VMSingle:
Done.
Now we can migrate the rest of the Recording Rules from Loki to VictoriaLogs.
![]()
