 Currently, we are able to collect our API Gateway logs from the CloudWatch Logs to Grafana Loki, see. Loki: collecting logs from CloudWatch Logs using Lambda Promtail.
But in the process of migrating to Kubernetes, we have Application Load Balancers that can only write logs to S3, and we need to learn how to collect logs from there as well.
See AWS ALB log format in the Access logs for your Application Load Balancer, setting up logging in S3 – in the Enable access logs for your Application Load Balancer.
Contents
Technical implementation
It seems to be nothing complicated, but firstly, there are some nuances, especially with IAM and VPC, and secondly, I couldn’t find a step-by-step guide anywhere, so I had to write it myself.
Actually, everything is almost the same as collecting logs from CloudWatch Logs:
- use Promtail Lambda
- on the S3 bucket, set up a trigger to send an event to Lambda when an object appears or is updated in the cart
- Promtail goes to the bucket and takes the log from there
Schematically, it can be represented as follows, with the IAM permissions:

Now let’s do everything manually, and then we’ll think about how to implement it with Terraform.
Creating an S3 bucket for logs
For the S3 bucket, we need an IAM Policy that will allow to:
- write logs from an Application Load Balancer to this bucket
- take logs from the bucket to Lambda
To do this, we will need:
- an ELB Account ID of the Load Balancer – see Step 2: Attach a policy to your S3 bucket
- in our case, AWS Region == us-east-1, so the
elb-account-idwill be == 127311923021
- in our case, AWS Region == us-east-1, so the
- an IAM Role ARN – a role that is connected to our Lambda function with Promtail
Create a s3-alb-logs-policy.json file with two Allow rules:
{
    "Version": "2012-10-17",
    "Statement": [
        {
            "Effect": "Allow",
            "Principal": {
                "AWS": "arn:aws:iam::127311923021:root"
            },
            "Action": "s3:PutObject",
            "Resource": "arn:aws:s3:::eks-alb-logs-test/AWSLogs/492***148/*"
        },
        {
            "Effect": "Allow",
            "Principal": {
                "AWS": "arn:aws:iam::492***148:role/grafana-atlas-monitoring-dev-1-28-loki-logger-backend"
            },
            "Action": "s3:GetObject",
            "Resource": "arn:aws:s3:::eks-alb-logs-test/*"
        }
    ]
}
Create a bucket:
$ aws --profile work s3api create-bucket --bucket eks-alb-logs-test --region us-east-1
Attach the Policy:
$ aws --profile work s3api put-bucket-policy --bucket eks-alb-logs-test --policy file://s3-alb-logs-policy.json
Next, we need to set up sending S3 notifications to our Lambda.
S3 Event notifications
Go to the Properties > Event notifications:

Set a name and prefix – the AWSLogs directory and the directory with the Account ID in it:

Select the types of events – all ObjectCreated:

And set the Destination – the ARN of the function to which we will send events:

Promtail Lambda permissions
Let’s check permissions in Lambda. We’ll need to know this when we will do automation and for debugging.
Go to the Lambda’s Configuration > Permissions:

And at the bottom, in the Resource-based policy statements, we should see new permission – it was added automatically when we created an Event Notification in the S3:

Creating an Ingress/ALB with logging to S3
Create a Kubernetes Ingress, and in its annotations add the alb.ingress.kubernetes.io/load-balancer-attributes with the bucket:
apiVersion: apps/v1
kind: Deployment
metadata:
  name: nginx-demo-deployment
spec:
  replicas: 1
  selector:
    matchLabels:
      app: nginx-demo
  template:
    metadata:
      labels:
        app: nginx-demo
    spec:
      containers:
        - name: nginx-demo-container
          image: nginx:latest
          ports:
            - containerPort: 80

---
apiVersion: v1
kind: Service
metadata:
  name: nginx-demo-service
spec:
  selector:
    app: nginx-demo
  ports:
    - protocol: TCP
      port: 80
      targetPort: 80
  type: ClusterIP

---
apiVersion: networking.k8s.io/v1
kind: Ingress
metadata:
  name: example-ingress
  annotations:
    alb.ingress.kubernetes.io/scheme: internet-facing
    alb.ingress.kubernetes.io/target-type: ip
    alb.ingress.kubernetes.io/listen-ports: '[{"HTTP": 80}]'
    alb.ingress.kubernetes.io/load-balancer-attributes: access_logs.s3.enabled=true,access_logs.s3.bucket=eks-alb-logs-test
spec:
  ingressClassName: alb
  rules:
    - host: example.com
      http:
        paths:
          - path: /
            pathType: Prefix
            backend:
              service:
                name: nginx-demo-service
                port:
                  number: 80
Create the resources:
$ kk apply -f ingress-svc-deploy.yaml
deployment.apps/nginx-demo-deployment created
service/nginx-demo-service created
ingress.networking.k8s.io/example-ingress created
Check the Ingress:
$ kk get ingress
NAME              CLASS   HOSTS         ADDRESS                                                                  PORTS   AGE
example-ingress   alb     example.com   k8s-default-examplei-b48cab7a95-1519459738.us-east-1.elb.amazonaws.com   80      22s
Check the files in the bucket:
$ aws s3 ls s3://eks-alb-logs-test/AWSLogs/492***148/
2023-11-15 14:51:43        106 ELBAccessLogTestFile
Do several requests to the ALB:
$ curl k8s-default-examplei-b48cab7a95-1519459738.us-east-1.elb.amazonaws.com
And in 2-3 minutes, we have a new file in the bucket:
$ aws s3 ls s3://eks-alb-logs-test/AWSLogs/492***148/elasticloadbalancing/us-east-1/2023/11/15/
...
2023-11-15 16:15:11        344 492***148_elasticloadbalancing_us-east-1_app.k8s-default-examplei-b48cab7a95.bc6b35b432aa3492_20231115T1415Z_54.211.225.139_2ir4tbe3.log.gz
And in another minute, we have an event at Lambda:

And its logs – you can search by the file name, bc6b35b432aa3492_20231115T1415Z_54.211.225.139_2ir4tbe3:
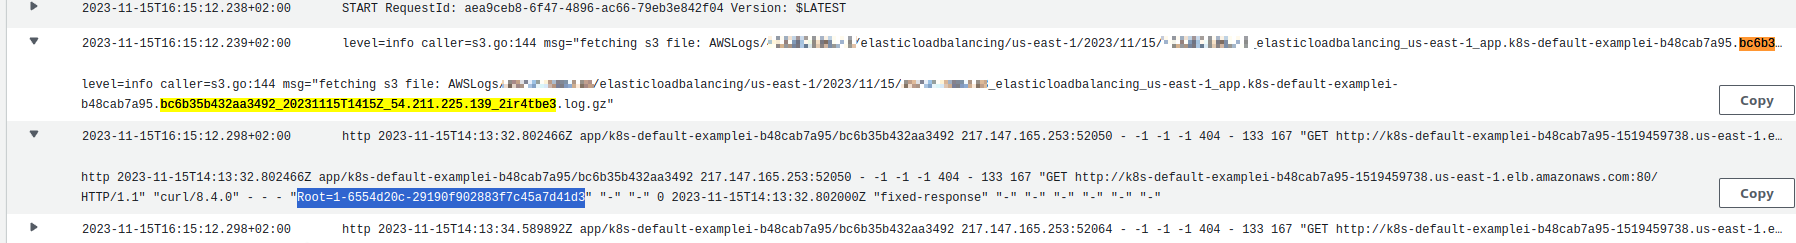
And logs in Loki – here you can search by the X-Ray ID, which is added to all requests to ALB in the X-Amzn-Trace-Id header:

Lambda error: Task timed out, and VPC Endpoints
While setting this up, I ran into the “Task timed out” error.
In the logs, it looked like this:
msg=”fetching s3 file: AWSLogs/492***148/elasticloadbalancing/us-east-1/2023/11/15/492***148_elasticloadbalancing_us-east-1_app.k8s-default-examplei-b48cab7a95.21d12877724a6c9f_20231115T1205Z_52.44.168.196_jin2v33x.log.gz”
Task timed out after 3.00 seconds
At first, I thought that Promtail couldn’t retrieve the log from S3 in the default timeout – 3 seconds, so I increased the function’s timeout:

But it turned out that there was another cause: the Lambda Promtail is running in a VPC, and it goes to S3 through an VPC Endpoint (see Terraform: Building EKS, part 1 – VPC, Subnets and Endpoints), but in the SecurityGtoup that is connected to this function, the Outbound access was allowed only to addresses in the Private Subnets of this VPC, because only log transfer to Grafana Loki was configured at that time:

And we need to grant access to the VPC of the S3 entity, and if it were an Endpoint Interface type, then in the SecurityGroup of the lambda, you could set the SecurityGroup ID of this Endpoint Interface:

But a Gateway type doesn’t have this option.
However, we can use the Prefix List ID to find it:

And add it to the Outbound Rules:

Done.
![]()