![]() While I’m working on a series of posts about setting up and using Claude Code, here’s a quick example of building my own AI Agent for VictoriaMetrics and Kubernetes, “wrapping” it into a Claude Code Plugin, and creating my own Claude Code Marketplace where similar plugins for developers on my project will live.
While I’m working on a series of posts about setting up and using Claude Code, here’s a quick example of building my own AI Agent for VictoriaMetrics and Kubernetes, “wrapping” it into a Claude Code Plugin, and creating my own Claude Code Marketplace where similar plugins for developers on my project will live.
The general idea: have an agent that developers can plug into their Claude Code (and 95% of our project uses it), and ask it “why the hell did that Kubernetes Pod crash“.
And not just developers – while testing this agent, I discovered the reason for constant Grafana restarts on my own setup, so the agent will be useful to me as well.
There are, of course, projects like kubectl-ai or even robusta.dev – but we’re going to build our own agent with a marketplace and skills.
What we’ll do:
- the agent will use the official skills from VictoriaMetrics – for VictoriaMetrics itself, VictoriaLogs, and Alertmanager
- we’ll write our own
SKILL.mddescribing the flow for checking the state of Kubernetes Pods – this skill will be included in the plugin and can later be reused by new agents - to make it easy to install the agent with all its skills, we’ll package the whole project into a Claude Code plugin stored in our project’s GitHub
The agent itself, as described here, is more of a PoC in terms of its instructions, and will be tuned and improved as we go – but the overall design of building the marketplace, agent, and Claude Code plugin will stay the same as shown in this post.
Contents
Overall structure and plan
Key concepts to know upfront:
- Marketplace: a git repository with one or more plugins that a developer adds to their Claude Code instance with a single command.
- Plugin: we can “package” all Agents, Skills, Commands, and MCP servers into a single bundle that’s also installed into Claude Code with one command
- Agent: a Claude Code subagent with its own system prompt and permissions, invoked from the main session via the Agent tool – works in an isolated context, performs a task, and returns the result to the main “orchestrator”, which in our case is the developer’s (or my) Claude Code
- Skill: an “instruction” that the agent reads when needed, describing the details of how to perform the task
As a result, in the atlas-claude-plugins repo we’ll get this directory and file structure:
$ tree -a -I .git atlas-claude-plugins/
atlas-claude-plugins/
├── .claude
│   └── settings.json
├── .claude-plugin
│   └── marketplace.json
├── .gitignore
├── CLAUDE.md
├── README.md
├── plugins
│   └── k8s-tools
│       ├── .claude-plugin
│       │   └── plugin.json
│       ├── agents
│       │   └── k8s-pod-debugger.md
│       └── skills
│           └── k8s-troubleshooting-flow
│               └── SKILL.md
└── scripts
    └── bootstrap.sh
MCP vs Skills: why skills
The first version of the agent used MCP. Actually, this whole idea came up while I was writing a draft of a post about Claude Code and connecting MCP – that one describes working with MCP using the official VictoriaMetrics MCP (see mcp-victoriametrics) and Kubernetes as examples.
So when I started building this agent, I added MCP first, but then the question came up – how are developers supposed to install them? Then I remembered that the VictoriaMetrics team also has a set of ready-made skills: maybe just use those instead of dragging some binaries around? Let Claude Code use curl via the Bash tool and hit the API directly.
Because actually – what’s the difference between MCP and Skill?
MCP (Model Context Protocol) gives you typed tools with clearly defined commands: for example, for VictoriaMetrics there’s the official mcp-victoriametrics server with Tools like query(query: string, time: timestamp). This looks great – because there’s determinism, certainty, clear structure – the agent can’t call a function with wrong parameters, the schema is validated.
But! When using an MCP function like query, which takes a string argument – the agent still writes the MetricsQL query itself. So MCP only defines how to execute the query – not the query structure itself, and the query is still built by the LLM.
Same thing with kubectl – whether we use an MCP server for it or just do Bash(kubectl get pod …) – the result is the same: the agent/LLM still decides on the query and the filters.
But in skills we can describe something different – “To check Pod logs in our cluster, use this pattern: _stream:{namespace=’X’}“. That’s knowledge for the agent that MCP doesn’t carry.
Plus there’s a practical aspect:
- using the official VictoriaMetrics marketplace with the
victoriametrics-query,victorialogs-query,alertmanager-queryskills – they’re maintained by the VictoriaMetrics team and updated when MetricsQL/LogsQL changes - no need to drag extra binaries onto the user’s (developer’s) machine – simpler to install and configure (although
bootstrap.shstill needs to be added, plus the VictoriaMetrics skills need to be hooked up)
So I decided to go with pure “Bash + curl + our own skill with our context + official VictoriaMetrics skills” – no MCP at all.
A separate note on Kubernetes MCP and Skills: the logic here is that all LLMs know the kubectl syntax just fine, so I don’t see much point in adding MCP.
We could add some ready-made skill, like the one done for VictoriaMetrics – for example, LukasNiessen/kubernetes-skill – but that skill is more about how to deploy things, while we’re building a read-only agent that debugs, not deploys – a completely different use case. So any specifics about our particular setup (like the namespace convention) can just be added to the plugin’s own SKILL.md – and the LLM will figure out how to do kubectl get events on its own.
Let’s go.
Creating the Marketplace
Let’s start with the basics – the marketplace where this agent (and future ones) will live, and we’ll set up the plugin structure inside it too.
Documentation – Create and distribute a plugin marketplace.
We’ll have:
- Marketplace: the GitHub repo itself –
atlas-claude-plugins- Plugin:
k8s-tools- Agent:
k8s-pod-debugger - Skill:
k8s-troubleshooting-flow
- Agent:
- Plugin:
Marketplace: the .claude-plugin/marketplace.json file
In the repo root we create the .claude-plugin/ directory, and inside it the marketplace.json file – it describes the marketplace itself and the plugins in it:
{
    "name": "atlas-claude-plugins",
    "owner": {
      "name": "Org Engineering",
      "url": "https://github.com/Org-Engineering"
    },
    "metadata": {
      "description": "Org DevOps team Claude Code plugins for Kubernetes operations and debugging",
      "version": "0.1.0"
    },
    "plugins": [
      {
        "name": "k8s-tools",
        "source": "./plugins/k8s-tools",
        "description": "Kubernetes operations toolkit - read-only debugging agents and skills with VictoriaLogs, VictoriaMetrics, and Alertmanager integration",
        "version": "0.1.0",
        "category": "devops",
        "tags": ["kubernetes", "debugging", "observability", "victoriametrics", "victorialogs", "alertmanager"]
      }
    ]
  }
Here:
name: "atlas-claude-plugins": sets the name under which the marketplace will be installed into Claude Code with the command/plugin marketplace add your-org/atlas-claude-pluginsversion: defined both at the marketplace level (we bump it when the plugin list changes) and at the level of each plugin (we bump it when the plugin itself changes)plugins[].source: an array describing the list of plugins in this marketplace; for each plugin we set a relative path in the repo – prefixed with./
Plugin: the plugins/k8s-tools/.claude-plugin/plugin.json file
Next we describe the plugin itself – the plugins/k8s-tools/ directory, as defined in plugins[].source in marketplace.json above.
Inside plugins/k8s-tools/ we create a .claude-plugin/ directory, and inside it the plugin.json file:
{
    "name": "k8s-tools",
    "version": "0.1.0",
    "description": "Kubernetes operations toolkit - read-only debugging agents and skills for VictoriaLogs, VictoriaMetrics, and Alertmanager",
    "author": {
      "name": "Org Engineering",
      "url": "https://github.com/Org-Engineering"
    }
  }
Here we define what the plugin actually is and its version. The version must match plugins[].version in marketplace.json.
The .claude/settings.json file
This file gives Claude Code one really nice feature – extraKnownMarketplaces: when a developer clones the repo and opens it in Claude Code, it automatically suggests installing the marketplace. No “manually reading” the README.md, no manually running commands.
It’s not a mandatory part of a Claude Code Marketplace – just a convenient feature that makes life easier for me and for developers when starting Claude Code.
On top of that, we add both our own marketplace and the VictoriaMetrics one – with one “yes” the developer installs both:
{
    "extraKnownMarketplaces": {
      "atlas-claude-plugins": {
        "source": {
          "source": "github",
          "repo": "Org-Engineering/atlas-claude-plugins"
        }
      },
      "victoriametrics-tools": {
        "source": {
          "source": "github",
          "repo": "VictoriaMetrics/skills"
        }
      }
    }
  }
The .gitignore file
Right away we define what data we don’t want in the repo – things like .claude/sessions/ are local developer data and don’t belong in the repo. Same with whatever.local.json files – those are local overrides that I or a developer might add for ourselves only, the plugin ignores them. See Available scopes – I’ll write about those separately in the Claude Code posts:
# OS
.DS_Store
Thumbs.db

# Editors
.vscode/
.idea/
*.swp
*~

# Claude Code per-user state and overrides (never share)
.claude/local/
.claude/conversations/
.claude/sessions/
.claude/cache/
.claude/settings.local.json
.claude/*.local.json

# Local env files
.env
.env.local
Now we have this structure:
$ tree -a -I '.git'
.claude
└── settings.json
.claude-plugin
└── marketplace.json
plugins
└── k8s-tools
    ├── .claude-plugin
    │   └── plugin.json
Here:
.claude: config for the Claude Code instance on developer machines.claude-plugin: metadata of the marketplace itselfplugins/k8s-tools/.claude-plugin: metadata of thek8s-toolsplugin
On to the agent itself.
Creating the AI Agent
Let’s clarify once more – what is an “AI Agent” anyway: it’s a separate “entity” that Claude Code can spin up to perform a specific task.
The agent has its own system prompt, its own context – its job is “do something” and return the result to the main Claude Code instance. This way we don’t pollute Claude Code’s context with unnecessary data – it gets only the data needed for its main task.
On top of that, we can assign a different, cheaper model to a specific agent – so for tasks like log parsing we save money, since logs are bulky and burn through tokens. The cheap model picks out the key patterns and data and returns them to Claude Code, which then uses an expensive model like Opus 4.7 (the latest as of today) for detailed analysis.
Profit!
The plugins/k8s-tools/agents/k8s-pod-debugger.md file
For the agent we need to create a file that describes the agent’s metadata and defines its system prompt.
The file is split into two main parts:
- YAML frontmatter: a block at the start of the markdown file, between two “
---” markers, where we set the name, Description, Tools, and Permissions - System Prompt: in the body of the file we describe to the agent what it should do and how, and here we can also add specifics about our particular Kubernetes cluster or workload relationships – how to debug them
The filename k8s-pod-debugger.md must match the name field in the frontmatter – otherwise Claude Code won’t link them.
Frontmatter: Name and Description fields
At the start of the file we define the name and a description of the agent – these are the agent’s general metadata.
Showing the contents in pieces here, then the full file later.
The description is used only by Claude Code – not by a human developer:
---
name: k8s-pod-debugger
description: Use this agent to investigate Kubernetes Pod, Namespace, or Workload issues. Performs read-only diagnostics across resource state, events, logs, metrics, and alerts. Invoke when user asks to debug a Pod, check why a Pod is failing (CrashLoopBackOff, OOMKilled, Pending, ImagePullBackOff), investigate problems in a Namespace, or troubleshoot a Deployment/StatefulSet/DaemonSet/Job that is not behaving correctly.

...
Frontmatter: Permissions and Tools fields
Next we define which Claude Code Tools the agent is allowed to use – and which are explicitly forbidden.
We have a read-only agent, no kubectl delete pod should ever happen – so we make that explicit:
tools:
  - Bash
  - Read
  - Grep
allowed-tools:
  - Bash(kubectl get *)
  - Bash(kubectl describe *)
  - Bash(kubectl logs *)
  ...
  - Bash(curl --silent --get *)
  - Bash(jq *)
  - Bash(cat ~/.config/atlas/env)
deny-tools:
  - Bash(kubectl delete *)
  - Bash(kubectl apply *)
  - Bash(kubectl exec *)
  ...
  - Bash(*curl* -X *)
  - Bash(*curl* --request *)
  - Bash(*curl* -d *)
  ...
  - Bash(rm *)
  - Bash(mv *)
---
Permissions, deny-tools, and the Least Privilege Principle
Let me pause here on the deny-tools details, since this is an important part.
We’re using the least privilege principle – the minimum access the agent actually needs to do its job.
For example, an unrestricted curl can delete time series in VictoriaMetrics via a POST to an admin endpoint:
$ curl -X POST https://victoriametrics.internal/api/v1/admin/tsdb/delete_series?match[]={namespace=”prod”}
So we cut those off and allow only GET.
For bash – we block various pipe operations – the agent won’t be able to run curl … | bash.
We block redirect outputs – >, >> – no writing to files via bash.
Running rm, mv, cp – all denied.
Same for kubectl – we explicitly forbid actions like kubectl delete or kubectl exec.
Body: the Agent’s System Prompt
And the main part of the file – the agent’s System Prompt: what it should do and how during debugging:
...

# Kubernetes Pod Debugger

You are a read-only Kubernetes troubleshooting agent. Your job is to investigate issues with Pods, Namespaces, and Workloads (Deployments, StatefulSets, DaemonSets, Jobs) and report findings clearly. You have access to the cluster via kubectl, and to observability data via VictoriaLogs, VictoriaMetrics, and Alertmanager.

You are NOT responsible for Node issues, networking deep-dives (Service/Ingress connectivity), or Storage (PV/PVC) troubleshooting. If the user asks about those, advise that a different agent is needed and stop.

## Your boundaries

You are strictly read-only. You investigate, observe, and report. You do not modify anything in the cluster or any external system. The user's permissions enforce this, but you must also respect this boundary in your reasoning - never propose write actions as part of your investigation.
...

## Available tools and data sources

**kubectl** - read-only commands only (`get`, `describe`, `logs`, `top`, `events`).

**Observability via VictoriaMetrics skills.** This plugin relies on the official VictoriaMetrics `query` plugin from the `victoriametrics-tools` marketplace, which provides:
- `victoriametrics-query` skill - for metrics queries (PromQL/MetricsQL)
- `victorialogs-query` skill - for log searches (LogsQL)
- `alertmanager-query` skill - for active and silenced alerts
...

## Our environment specifics

This is essential context for query construction. Always apply these when invoking VM skills:

**VictoriaMetrics labels** (standard prometheus-operator stack):
- `cluster` - REQUIRED in all queries (e.g. `kube_pod_status_phase{cluster="prod-1",namespace="..."}`)
...

**VictoriaLogs streams** (promtail-based collection):
- Stream label: only `namespace` is indexed at stream level
...

## How to investigate

The investigation flow depends on the entry point. Identify which type of request you got and follow the matching flow.

### Entry point A: Single Pod

Triggered by requests like "debug pod X", "why is X failing", "what's wrong with X in namespace Y".

1. **Establish context**
   - `kubectl config current-context` (also use as `CLUSTER` for metrics)
   - If Namespace not specified, get current default: `kubectl config view --minify -o jsonpath='{..namespace}'`
   - Verify Pod exists: `kubectl get pod <name> -n <ns>`

2. **Check Pod state**
   - `kubectl get pod <name> -n <ns> -o wide` - status, Node, IP, restart count
   - `kubectl describe pod <name> -n <ns>` - full event history, conditions, container statuses, last termination reason
   - For multi-container Pods, identify all containers: `kubectl get pod <name> -n <ns> -o jsonpath='{.spec.containers[*].name}'`
...

## How to report findings

Structure your final report in clear sections. Be concrete - include actual values, error messages, timestamps. Avoid filler.

Use this template, adapted to the entry point:

- **Subject** - what you investigated (Pod name / Namespace / Workload kind+name)
...
- **Recommended actions** - read-only or human-driven next steps (you cannot execute writes)

For Namespace overview reports, structure findings as a prioritized list of issues, with a brief sub-report per top issue.

## Important rules

- **Never invent data.** If a command fails or returns nothing, report that explicitly. Do not fabricate values.
- **Cite your evidence.** Every claim in your conclusion must reference a specific kubectl output, log line, metric value, or alert
...
- **Out of scope:** Node issues, networking (Service/Ingress connectivity), Storage (PV/PVC). If the request is purely about these, say so and stop - a different agent should handle them.

..
Here:
-
Kubernetes Pod Debugger: we tell the agent who it is and what it does in general
- Your boundaries: we reiterate that it’s read-only
- Available tools and data sources: which utilities and how it should use them – we mention that there are separate VictoriaMetrics skills it should pull in
- Our environment specifics: details specific to our setup – labels in metrics, streams in logs
- How to investigate: we describe the troubleshooting process – how to connect to Kubernetes, check the Pod state, related events, etc
- How to report findings: the format the agent should use to return its results
- Important rules: a bit of behavior tuning – “don’t make stuff up if something went wrong“, don’t go down unrelated rabbit holes, and so on
Separately, we explicitly tell the agent that we have a Skill called k8s-troubleshooting-flow describing the query details – more on that below.
The full k8s-pod-debugger.md file
The result looks like this:
---
name: k8s-pod-debugger
description: Use this agent to investigate Kubernetes Pod, Namespace, or Workload issues. Performs read-only diagnostics across resource state, events, logs, metrics, and alerts. Invoke when user asks to debug a Pod, check why a Pod is failing (CrashLoopBackOff, OOMKilled, Pending, ImagePullBackOff), investigate problems in a Namespace, or troubleshoot a Deployment/StatefulSet/DaemonSet/Job that is not behaving correctly.
tools:
  - Bash
  - Read
  - Grep
allowed-tools:
  - Bash(kubectl get *)
  - Bash(kubectl describe *)
  - Bash(kubectl logs *)
  - Bash(kubectl top *)
  - Bash(kubectl events *)
  - Bash(kubectl version)
  - Bash(kubectl config view *)
  - Bash(kubectl config current-context)
  - Bash(kubectl auth can-i *)
  - Bash(curl -s -G *)
  - Bash(curl -sG *)
  - Bash(curl --silent --get *)
  - Bash(jq *)
  - Bash(source ~/.config/atlas/env)
  - Bash(cat ~/.config/atlas/env)
deny-tools:
  - Bash(kubectl delete *)
  - Bash(kubectl apply *)
  - Bash(kubectl exec *)
  - Bash(kubectl edit *)
  - Bash(kubectl patch *)
  - Bash(kubectl scale *)
  - Bash(kubectl rollout *)
  - Bash(kubectl cp *)
  - Bash(kubectl port-forward *)
  - Bash(kubectl create *)
  - Bash(kubectl replace *)
  - Bash(kubectl annotate *)
  - Bash(kubectl label *)
  - Bash(kubectl drain *)
  - Bash(kubectl cordon *)
  - Bash(kubectl uncordon *)
  - Bash(kubectl taint *)
  - Bash(*curl* -X *)
  - Bash(*curl* --request *)
  - Bash(*curl* -d *)
  - Bash(*curl* --data*)
  - Bash(*curl* --upload-file *)
  - Bash(*curl* -T *)
  - Bash(*curl* -o *)
  - Bash(*curl* --output *)
  - Bash(*|*sh*)
  - Bash(*|*bash*)
  - Bash(*>*)
  - Bash(*>>*)
  - Bash(rm *)
  - Bash(mv *)
  - Bash(cp *)
  - Bash(chmod *)
  - Bash(chown *)
---

# Kubernetes Pod Debugger

You are a read-only Kubernetes troubleshooting agent. Your job is to investigate issues with Pods, Namespaces, and Workloads (Deployments, StatefulSets, DaemonSets, Jobs) and report findings clearly. You have access to the cluster via kubectl, and to observability data via VictoriaLogs, VictoriaMetrics, and Alertmanager.

You are NOT responsible for Node issues, networking deep-dives (Service/Ingress connectivity), or Storage (PV/PVC) troubleshooting. If the user asks about those, advise that a different agent is needed and stop.

## Your boundaries

You are strictly read-only. You investigate, observe, and report. You do not modify anything in the cluster or any external system. The user's permissions enforce this, but you must also respect this boundary in your reasoning - never propose write actions as part of your investigation.

For HTTP requests, use only `curl -sG` or `curl --silent --get`. Never use `-X`, `-d`, `--data`, or any non-GET method. If you find a problem that needs a fix, describe it as a recommendation in your final report - do not attempt to execute it.

## Available tools and data sources

**kubectl** - read-only commands only (`get`, `describe`, `logs`, `top`, `events`).

**Local skill: `k8s-troubleshooting-flow`** - this plugin includes a skill with our environment-specific knowledge: VictoriaLogs stream label schema, VictoriaMetrics label conventions (including the required `cluster` label), MetricsQL/LogsQL query templates for common Pod failure modes, and correlation patterns linking kubectl observations to metrics/logs/alerts. **Read this skill at the start of any non-trivial investigation** - it tells you which queries to construct for the situation at hand.

**External skills via VictoriaMetrics `query` plugin** - this plugin relies on the official `victoriametrics-tools` marketplace, which provides:
- `victoriametrics-query` skill - executes metrics queries (PromQL/MetricsQL) via curl
- `victorialogs-query` skill - executes log searches (LogsQL) via curl
- `alertmanager-query` skill - queries active and silenced alerts via curl

These skills handle curl mechanics, pagination, and result parsing. The flow is: read `k8s-troubleshooting-flow` to learn WHAT to query, then invoke the appropriate VM skill to actually run the query.

**Environment variables** - the VM skills require these to be set in the user's shell:
- `VM_METRICS_URL` - VictoriaMetrics endpoint
- `VM_LOGS_URL` - VictoriaLogs endpoint
- `VM_ALERTMANAGER_URL` - Alertmanager endpoint

These are configured by the bootstrap script (`scripts/bootstrap.sh` in the atlas-claude-plugins repo) and stored in `~/.config/atlas/env`. If commands fail because vars are missing, instruct the user to run the bootstrap script.

## How to investigate

The investigation flow depends on the entry point. Identify which type of request you got and follow the matching flow.

Before starting any flow, **read the `k8s-troubleshooting-flow` skill** to refresh your memory on:
- Our VictoriaLogs stream schema (so you build correct LogsQL)
- Our VictoriaMetrics label conventions (so you build correct MetricsQL with required `cluster` label)
- The correlation patterns matching the failure mode you're investigating

### Entry point A: Single Pod

Triggered by requests like "debug pod X", "why is X failing", "what's wrong with X in namespace Y".

1. **Establish context**
   - `kubectl config current-context`
   - If Namespace not specified, get current default: `kubectl config view --minify -o jsonpath='{..namespace}'`
   - Verify Pod exists: `kubectl get pod <name> -n <ns>`

2. **Check Pod state**
   - `kubectl get pod <name> -n <ns> -o wide` - status, Node, IP, restart count
   - `kubectl describe pod <name> -n <ns>` - full event history, conditions, container statuses, last termination reason
   - For multi-container Pods, identify all containers: `kubectl get pod <name> -n <ns> -o jsonpath='{.spec.containers[*].name}'`

   Pay attention to:
   - `Status`, `Reason`, `Message` fields
   - Container `State` and `Last State` (with reason: `CrashLoopBackOff`, `OOMKilled`, `Error`, `ImagePullBackOff`)
   - `Events` section - especially Warning events
   - Resource requests and limits vs actual usage

3. **Identify failure mode and consult skill** - based on the kubectl output above, identify which failure mode this matches (CrashLoopBackOff, OOMKilled, ImagePullBackOff, Pending, Ready=False but Running). Open the `k8s-troubleshooting-flow` skill and follow the correlation pattern matching that mode - it tells you exactly which metrics, logs, and alerts to check next.

4. **Check related events**
   - `kubectl events -n <ns> --for=pod/<name>` (newer kubectl versions)
   - Fallback: `kubectl get events -n <ns> --field-selector involvedObject.name=<name>`

5. **Check logs (recent, from kubectl)**
   - Current container: `kubectl logs <name> -n <ns> --tail=200`
   - Previous container if restarted: `kubectl logs <name> -n <ns> --previous --tail=200`
   - For multi-container Pods, iterate per container with `-c <container>`

6. **Check metrics** - use `victoriametrics-query` skill with MetricsQL templates from `k8s-troubleshooting-flow`. Always include the `cluster` label as documented in the skill.

7. **Check deeper logs (longer time window)** - use `victorialogs-query` skill with LogsQL stream patterns from `k8s-troubleshooting-flow`. Default time window: last 1 hour. Expand if not enough.

8. **Check related alerts** - use `alertmanager-query` skill. Filter by matching `namespace` and `pod` labels. Include both firing and recently resolved (last 1 hour) to catch flapping issues.

### Entry point B: Namespace overview

Triggered by requests like "what's wrong in namespace X", "check namespace X", "is anything broken in X".

1. **Establish context** - confirm cluster context, verify Namespace exists.

2. **Find unhealthy resources**
   - `kubectl get pods -n <ns>` - look for any non-Running, non-Completed Pods
   - `kubectl get pods -n <ns> --field-selector=status.phase!=Running,status.phase!=Succeeded`
   - `kubectl get deployments,statefulsets,daemonsets -n <ns>` - check ready/available counts mismatch
   - `kubectl get events -n <ns> --sort-by='.lastTimestamp' | tail -50` - recent Warning events

3. **Triage** - rank issues by severity:
   - Pods stuck in CrashLoopBackOff, ImagePullBackOff, Error - highest priority
   - Pods Pending - check if scheduling, image pull, or resource issue
   - Workloads with replicas mismatch (e.g. Deployment wants 3, has 2 ready)
   - Recent Warning events (OOM, FailedMount, FailedScheduling)

4. **Deep-dive on top issues** - for each priority Pod/Workload, switch to entry point A or C respectively. Limit to top 3-5 issues to keep report manageable. Use `k8s-troubleshooting-flow` correlation patterns for each.

5. **Check Namespace-level alerts** - use `alertmanager-query` skill, filter by `namespace="..."` label.

### Entry point C: Workload (Deployment / StatefulSet / DaemonSet / Job)

Triggered by requests like "why is deployment X not updating", "statefulset Y has issues", "job Z keeps failing".

1. **Establish context** - confirm cluster context, Namespace.

2. **Check Workload state**
   - `kubectl get <kind>/<name> -n <ns> -o wide`
   - `kubectl describe <kind>/<name> -n <ns>` - replicas, conditions, events, rollout status
   - For Deployments: `kubectl rollout history deployment/<name> -n <ns>` (read-only)
   - For Jobs: check `.status.conditions` and `.status.failed`/`.status.succeeded`

3. **Check Pods owned by Workload**
   - `kubectl get pods -n <ns> -l <workload-selector>` (selector from describe output)
   - Identify Pods in bad states - then for each, follow entry point A flow (including consulting `k8s-troubleshooting-flow` per failure mode)

4. **Check ReplicaSet/ControllerRevision history** for Deployments and StatefulSets - sometimes the issue is the new revision is broken.

5. **Check Workload-level metrics and alerts** - MetricsQL templates for Workload state are in the `k8s-troubleshooting-flow` skill (Deployment/StatefulSet/DaemonSet/Job replica metrics).

## How to report findings

Structure your final report in clear sections. Be concrete - include actual values, error messages, timestamps. Avoid filler.

Use this template, adapted to the entry point:

- **Subject** - what you investigated (Pod name / Namespace / Workload kind+name)
- **Status** - one-line summary: healthy / failing / partially failing / pending / etc
- **Key Findings** - bulleted list of specific observations with data
- **Events** - recent significant events with timestamps
- **Logs** - relevant log excerpts with line numbers/timestamps
- **Metrics** - resource usage observations, anomalies
- **Alerts** - firing alerts related to the subject, or "none"
- **Conclusion** - likely root cause based on evidence above
- **Recommended actions** - read-only or human-driven next steps (you cannot execute writes)

For Namespace overview reports, structure findings as a prioritized list of issues, with a brief sub-report per top issue.

## Important rules

- **Never invent data.** If a command fails or returns nothing, report that explicitly. Do not fabricate values.
- **Cite your evidence.** Every claim in your conclusion must reference a specific kubectl output, log line, metric value, or alert.
- **Stay focused.** Investigate what was asked. Do not wander into unrelated cluster issues.
- **Time-box log scans.** Default to last 200 lines or last 1 hour. Expand only if initial scan is insufficient.
- **Limit Namespace deep-dives.** When investigating a Namespace, do not deep-dive every problem - pick top 3-5 by severity.
- **Always consult `k8s-troubleshooting-flow` for query construction.** Do not invent LogsQL stream filters or MetricsQL label selectors from memory - the skill has the correct schema for our environment.
- **Always include `cluster` label** in MetricsQL queries against our VictoriaMetrics - all metrics are labeled with it (see skill for details).
- **Respect read-only boundary.** If you find a problem that needs a fix (e.g. wrong env var, missing Secret, bad image tag, wrong replica count), describe the fix as a recommendation. Do not attempt to apply it.
- **Out of scope:** Node issues, networking (Service/Ingress connectivity), Storage (PV/PVC). If the request is purely about these, say so and stop - a different agent should handle them.
Now the plugin has this structure:
$ tree -a plugins/
plugins/
└── k8s-tools
    ├── .claude-plugin
    │   └── plugin.json
    ├── agents
    │   └── k8s-pod-debugger.md
Skill: k8s-troubleshooting-flow
The agent file plugins/k8s-tools/agents/k8s-pod-debugger.md describes the agent itself – what it should do and how, which utilities are available to it.
On top of that, we’ll create a separate Skill in the plugin describing the details of running queries against VictoriaLogs, sample MetricsQL queries against VictoriaMetrics, and which Kubernetes Pod issues to check for.
Why a Skill, separate from the System Prompt?
A few important points worth keeping in mind:
- separation of abstractions: the System Prompt tells the agent “who you are“, and the Skill describes “how to do X in our cluster“
- context savings: the System Prompt is added to every LLM request, while a Skill is read on demand – so we don’t burn tokens and limits.
- that is, when the agent needs to find out “what to do if a Pod is in CrashLoopBackOff” – it auto-loads the Skill and gets the relevant instructions, instead of stuffing all the details into every request
- re-use across agents: we put the skill at the plugin root so we can reuse it for other agents instead of duplicating it
- updating the skill: it’s easier to add new details in one place, instead of rewriting it across a hundred agent files
The plugins/k8s-tools/skills/k8s-troubleshooting-flow/SKILL.md file
The whole skill looks like this:
---
name: k8s-troubleshooting-flow
description: Use when investigating Kubernetes Pod, Workload, or Namespace issues and you need to correlate kubectl observations with metrics (VictoriaMetrics), logs (VictoriaLogs), or alerts (Alertmanager). Provides query templates for common Pod failure modes (CrashLoopBackOff, OOMKilled, Pending, ImagePullBackOff), our specific stream label schema for VictoriaLogs (promtail-based), and standard MetricsQL patterns for kube-state-metrics and cAdvisor.
---

# Kubernetes Troubleshooting Flow

This skill provides query templates and correlation patterns for debugging Kubernetes workloads using our observability stack.

## Our environment

**VictoriaLogs** - log collection via promtail. Stream labels (indexed):
- `namespace` - the only stream-level label

Other useful fields available after stream filter (NOT indexed, but searchable):
- `pod` - Pod name
- `container` - container name within Pod
- `app` - app label from Pod
- `node_name`, `hostname` - Node where Pod runs
- `stream` - `stdout` or `stderr`

**VictoriaMetrics** - prometheus-operator stack. All metrics labeled with:
- `cluster` - cluster identifier (REQUIRED in queries)
- `namespace`, `pod`, `container` - standard k8s labels
- `job`, `instance`, `service`, `endpoint` - infra labels

**Alertmanager** - standard, queried via `alertmanager-query` skill.

## Query template patterns

### LogsQL (via victorialogs-query skill)

Always start with stream filter, then narrow by fields:

    _stream:{namespace="<NS>"} pod:"<POD>"

Common patterns:

- All logs for a Pod (last hour):
  `_stream:{namespace="<NS>"} pod:"<POD>"`

- Errors only:
  `_stream:{namespace="<NS>"} pod:"<POD>" (level:error OR error OR exception OR fatal OR panic)`

- Specific container in multi-container Pod:
  `_stream:{namespace="<NS>"} pod:"<POD>" container:"<CONTAINER>"`

- Errors across whole Namespace:
  `_stream:{namespace="<NS>"} (level:error OR error OR exception OR fatal)`

- Logs from specific Node (e.g. Node-level issues):
  `_stream:{namespace="<NS>"} node_name:"<NODE>"`

### MetricsQL (via victoriametrics-query skill)

Always include `cluster="<CLUSTER>"`. The user will tell you the cluster name, or you can ask if it's not clear.

**Pod state and lifecycle:**

- Current phase: `kube_pod_status_phase{cluster="<C>",namespace="<NS>",pod="<POD>"}`
- Restart count: `kube_pod_container_status_restarts_total{cluster="<C>",namespace="<NS>",pod="<POD>"}`
- Restart rate (last hour): `rate(kube_pod_container_status_restarts_total{cluster="<C>",namespace="<NS>",pod="<POD>"}[1h])`
- Last termination reason: `kube_pod_container_status_last_terminated_reason{cluster="<C>",namespace="<NS>",pod="<POD>"}`
- Ready status: `kube_pod_status_ready{cluster="<C>",namespace="<NS>",pod="<POD>"}`

**Memory (cAdvisor):**

- Working set (current): `container_memory_working_set_bytes{cluster="<C>",namespace="<NS>",pod="<POD>",container!=""}`
- vs limit: `container_memory_working_set_bytes{cluster="<C>",namespace="<NS>",pod="<POD>",container!=""} / container_spec_memory_limit_bytes{cluster="<C>",namespace="<NS>",pod="<POD>",container!=""}`
- OOM kills: `kube_pod_container_status_terminated_reason{cluster="<C>",namespace="<NS>",pod="<POD>",reason="OOMKilled"}`

**CPU (cAdvisor):**

- Usage rate: `rate(container_cpu_usage_seconds_total{cluster="<C>",namespace="<NS>",pod="<POD>",container!=""}[5m])`
- Throttling rate: `rate(container_cpu_cfs_throttled_periods_total{cluster="<C>",namespace="<NS>",pod="<POD>",container!=""}[5m]) / rate(container_cpu_cfs_periods_total{cluster="<C>",namespace="<NS>",pod="<POD>",container!=""}[5m])`
- Throttling > 0 means resource pressure

**Workload state (Deployment / StatefulSet / DaemonSet):**

- Deployment: desired vs available
  - `kube_deployment_spec_replicas{cluster="<C>",namespace="<NS>",deployment="<NAME>"}`
  - `kube_deployment_status_replicas_available{cluster="<C>",namespace="<NS>",deployment="<NAME>"}`
- StatefulSet: `kube_statefulset_status_replicas_ready{cluster="<C>",namespace="<NS>",statefulset="<NAME>"}`
- DaemonSet: `kube_daemonset_status_number_unavailable{cluster="<C>",namespace="<NS>",daemonset="<NAME>"}`
- Job: `kube_job_status_failed{cluster="<C>",namespace="<NS>",job_name="<NAME>"}`

**Namespace-wide health:**

- Failing Pods count: `count(kube_pod_status_phase{cluster="<C>",namespace="<NS>",phase=~"Failed|Pending|Unknown"})`
- Pods with restarts in last hour: `count(increase(kube_pod_container_status_restarts_total{cluster="<C>",namespace="<NS>"}[1h]) > 0)`

### Alertmanager (via alertmanager-query skill)

- Alerts for a Pod: filter by `pod="<POD>"` label
- Alerts for a Namespace: filter by `namespace="<NS>"` label
- Include `state=active` for currently firing
- Include recently resolved (last 1h) to catch flapping issues

## Correlation patterns by failure mode

For each Pod failure mode, this is what to look for and where:

### CrashLoopBackOff

**Signal in kubectl:**
- `kubectl describe pod` - container State `Waiting` with reason `CrashLoopBackOff`, Last State `Terminated` with exit code

**What to check:**
1. Last termination reason and exit code (kubectl describe)
2. Previous container logs: `kubectl logs <pod> --previous`
3. Restart count metric - is it climbing?
4. Time between restarts - constant (looks like the app starts then fails) or growing (BackOff is increasing)?
5. Logs in VictoriaLogs around restart timestamps - look for stack traces, init errors, missing config

**Common root causes:**
- Application bug on startup (check logs)
- Missing/wrong config (env var, ConfigMap, Secret)
- Failing readiness/liveness probe (check probe config in describe)
- Out of memory (cross-check with OOMKilled metric and memory metrics)

### OOMKilled

**Signal in kubectl:**
- `kubectl describe pod` - Last State `Terminated`, Reason `OOMKilled`, exit code 137

**What to check:**
1. `kube_pod_container_status_terminated_reason{...,reason="OOMKilled"}` - confirm in metrics
2. Memory usage trend leading up to kill: `container_memory_working_set_bytes{...}` over last 6h
3. Memory limit: `container_spec_memory_limit_bytes{...}`
4. Was it gradual leak or sudden spike?
5. Logs right before the kill (last 5 min before termination timestamp)

**Common root causes:**
- Memory leak in application
- Limit set too low for actual workload
- Sudden traffic spike causing memory allocation

### ImagePullBackOff / ErrImagePull

**Signal in kubectl:**
- `kubectl describe pod` - Events show `Failed to pull image`, `ErrImagePull`, `ImagePullBackOff`

**What to check:**
1. Exact image reference in Pod spec
2. Pull error message in events (auth, not found, network)
3. Check imagePullSecrets configured on Pod or ServiceAccount

**Common root causes:**
- Wrong image tag (typo, doesn't exist)
- Registry auth failure (missing/expired pull secret)
- Network issue from Node to registry
- Rate limiting (Docker Hub anonymous pulls)

### Pending

**Signal in kubectl:**
- `kubectl get pod` shows status `Pending` for >30s

**What to check:**
1. `kubectl describe pod` Events - scheduler messages
2. Common scheduler errors:
   - `0/N nodes are available: insufficient cpu/memory` - resource pressure
   - `node(s) didn't match Pod's node affinity/selector` - scheduling rules issue
   - `node(s) had untolerated taint` - taints/tolerations issue
   - `error getting PVC` - storage issue (out of scope, mention it)
3. Node resource availability: `kube_node_status_allocatable{cluster="<C>"}` vs requests on Pending Pod

**Common root causes:**
- Cluster out of resources for requested CPU/memory
- Node selector/affinity doesn't match any Node
- Taints not tolerated
- Storage class not provisioning (refer to storage agent)

### Pod Ready=False but Running

**Signal in kubectl:**
- `kubectl get pod` - status Running but READY shows `0/1`

**What to check:**
1. Container statuses in describe - which probe failing (readiness vs liveness)
2. Probe configuration - endpoint, expected response
3. Logs of the probe target (often the app's `/health` endpoint)
4. Was this recent change? Check rollout history if Deployment

**Common root causes:**
- App takes longer to start than `initialDelaySeconds`
- Wrong probe endpoint or expected response
- Backend dependency unavailable (DB, cache) - app can't become ready

## Investigation discipline

Reminders for the investigating agent:

- **Time-box**: default to last 1h for logs, last 6h for metric trends. Expand only if data is insufficient.
- **Cite evidence**: every finding must reference a specific kubectl output, log line with timestamp, metric value, or alert.
- **Don't conflate symptoms with causes**: "Pod is OOMKilled" is a symptom. The cause is "memory leak in handler X" or "limit set 256Mi but workload needs 512Mi".
- **Stop when you have enough**: a clear root cause + supporting evidence is the goal. Don't keep digging if the answer is found.
Creating the Bootstrap script
The agent needs a few environment variables to work – how to connect to the VictoriaMetrics, VictoriaLogs, and Alertmanager endpoints.
In our case VictoriaMetrics and VictoriaLogs each have their own Ingress, accessible through an AWS Internal Application Load Balancer over VPN, so when installing the plugin we should check that they’re reachable.
We also check that kubectl, jq, curl, etc. are installed.
The environment variables get written to ~/.config/atlas/env, which is then used at agent startup and is referenced in its System Prompt.
The script is cross-platform – we have both macOS and Linux users.
#!/usr/bin/env bash
# Atlas Claude Plugins - bootstrap script
#
# Sets up the local environment needed for the k8s-tools plugin and
# VictoriaMetrics observability skills. Cross-platform (macOS / Linux).
#
# Usage:
#   ./scripts/bootstrap.sh             # interactive setup
#   ./scripts/bootstrap.sh --force     # overwrite existing env file without asking
#   ./scripts/bootstrap.sh --help      # show help

set -euo pipefail

# Defaults that can be overridden via env vars before invocation
DEFAULT_VM_METRICS_URL="${VM_METRICS_URL:-https://vmsingle.monitoring.1-33.ops.example.co}"
DEFAULT_VM_LOGS_URL="${VM_LOGS_URL:-https://vmlogs.monitoring.1-33.ops.example.co}"
DEFAULT_VM_ALERTMANAGER_URL="${VM_ALERTMANAGER_URL:-http://localhost:9093}"

ENV_DIR="${HOME}/.config/atlas"
ENV_FILE="${ENV_DIR}/env"

# Color output (disabled if not a TTY)
if [ -t 1 ]; then
  C_RED=$'\033[31m'
  C_GREEN=$'\033[32m'
  C_YELLOW=$'\033[33m'
  C_BLUE=$'\033[34m'
  C_BOLD=$'\033[1m'
  C_RESET=$'\033[0m'
else
  C_RED=""
  C_GREEN=""
  C_YELLOW=""
  C_BLUE=""
  C_BOLD=""
  C_RESET=""
fi

log_info()  { printf "%s[INFO]%s  %s\n"  "$C_BLUE"   "$C_RESET" "$*"; }
log_ok()    { printf "%s[OK]%s    %s\n"  "$C_GREEN"  "$C_RESET" "$*"; }
log_warn()  { printf "%s[WARN]%s  %s\n"  "$C_YELLOW" "$C_RESET" "$*"; }
log_error() { printf "%s[ERROR]%s %s\n"  "$C_RED"    "$C_RESET" "$*" >&2; }

usage() {
  cat <<EOF
Atlas Claude Plugins - bootstrap script

Sets up environment variables required by k8s-tools plugin and
VictoriaMetrics skills (victoriametrics-query, victorialogs-query, alertmanager-query).

Usage:
  $(basename "$0") [--force] [--help]

Options:
  --force    Overwrite existing env file (${ENV_FILE}) without prompting.
  --help     Show this help message.

Environment variables (used as defaults if set):
  VM_METRICS_URL       Default: ${DEFAULT_VM_METRICS_URL}
  VM_LOGS_URL          Default: ${DEFAULT_VM_LOGS_URL}
  VM_ALERTMANAGER_URL  Default: ${DEFAULT_VM_ALERTMANAGER_URL}

EOF
}

# Parse arguments
FORCE=0
for arg in "$@"; do
  case "$arg" in
    --force) FORCE=1 ;;
    --help|-h) usage; exit 0 ;;
    *) log_error "Unknown argument: $arg"; usage; exit 1 ;;
  esac
done

# OS detection
detect_os() {
  case "$(uname -s)" in
    Darwin) echo "macos" ;;
    Linux)  echo "linux" ;;
    *)      echo "unknown" ;;
  esac
}

OS="$(detect_os)"
log_info "Detected OS: ${OS}"

# Shell detection
detect_shell() {
  local shell_path="${SHELL:-}"
  if [ -n "$shell_path" ]; then
    basename "$shell_path"
  else
    echo "unknown"
  fi
}

USER_SHELL="$(detect_shell)"

shell_rc_file() {
  case "$USER_SHELL" in
    bash) echo "${HOME}/.bashrc" ;;
    zsh)  echo "${HOME}/.zshrc" ;;
    fish) echo "${HOME}/.config/fish/config.fish" ;;
    *)    echo "" ;;
  esac
}

# Dependency checks
install_hint() {
  local tool="$1"
  case "$OS" in
    macos)
      case "$tool" in
        kubectl) echo "  brew install kubectl" ;;
        curl)    echo "  curl is preinstalled on macOS, check your PATH" ;;
        jq)      echo "  brew install jq" ;;
        claude)  echo "  npm install -g @anthropic-ai/claude-code  (or https://claude.ai/download)" ;;
      esac
      ;;
    linux)
      case "$tool" in
        kubectl) echo "  https://kubernetes.io/docs/tasks/tools/install-kubectl-linux/" ;;
        curl)    echo "  sudo apt install curl  # or: sudo dnf install curl" ;;
        jq)      echo "  sudo apt install jq    # or: sudo dnf install jq" ;;
        claude)  echo "  npm install -g @anthropic-ai/claude-code  (or https://claude.ai/download)" ;;
      esac
      ;;
    *)
      echo "  (install ${tool} for your platform)"
      ;;
  esac
}

check_dep() {
  local cmd="$1"
  if command -v "$cmd" >/dev/null 2>&1; then
    log_ok "${cmd} found: $(command -v "$cmd")"
    return 0
  else
    log_error "${cmd} not found in PATH"
    printf "        Install hint:\n%s\n" "$(install_hint "$cmd")"
    return 1
  fi
}

log_info "Checking dependencies..."
DEPS_OK=1
for dep in kubectl curl jq claude; do
  check_dep "$dep" || DEPS_OK=0
done

if [ "$DEPS_OK" -eq 0 ]; then
  log_error "Some dependencies are missing. Install them and re-run this script."
  exit 1
fi

# Handle existing env file
if [ -f "$ENV_FILE" ] && [ "$FORCE" -eq 0 ]; then
  log_warn "Env file already exists: ${ENV_FILE}"
  log_warn "Current contents:"
  printf "%s---%s\n" "$C_BOLD" "$C_RESET"
  cat "$ENV_FILE"
  printf "%s---%s\n" "$C_BOLD" "$C_RESET"
  log_warn "Re-run with --force to overwrite, or edit the file manually."
  exit 0
fi

# Interactive prompts - prompt goes to stderr, value to stdout
# This way command substitution captures only the value, not the prompt
prompt_with_default() {
  local label="$1"
  local default="$2"
  local answer

  # Prompt to stderr (visible to user, not captured by $(...))
  printf "%s%s%s [%s]: " "$C_BOLD" "$label" "$C_RESET" "$default" >&2
  read -r answer
  if [ -z "$answer" ]; then
    echo "$default"
  else
    echo "$answer"
  fi
}

log_info "Configure observability endpoints (press Enter to accept default):"
echo

VM_METRICS_URL_VAL="$(prompt_with_default "VictoriaMetrics URL"  "$DEFAULT_VM_METRICS_URL")"
VM_LOGS_URL_VAL="$(prompt_with_default     "VictoriaLogs URL"    "$DEFAULT_VM_LOGS_URL")"
VM_ALERTMANAGER_URL_VAL="$(prompt_with_default "Alertmanager URL" "$DEFAULT_VM_ALERTMANAGER_URL")"
echo

# Connectivity check (non-fatal)
check_url() {
  local url="$1"
  local label="$2"
  if curl -sS -o /dev/null -w "%{http_code}" --max-time 3 "$url" 2>/dev/null | grep -qE '^[234]'; then
    log_ok "${label} reachable (${url})"
  else
    log_warn "${label} not reachable (${url}) - check VPN if this is an internal endpoint"
  fi
}

log_info "Checking connectivity..."
check_url "$VM_METRICS_URL_VAL"      "VictoriaMetrics"
check_url "$VM_LOGS_URL_VAL"         "VictoriaLogs"
check_url "$VM_ALERTMANAGER_URL_VAL" "Alertmanager"
echo

# Write env file
log_info "Writing ${ENV_FILE}..."
mkdir -p "$ENV_DIR"

cat > "$ENV_FILE" <<ENVEOF
# Atlas Claude Plugins - environment configuration
# Generated by scripts/bootstrap.sh on $(date -u +"%Y-%m-%dT%H:%M:%SZ")
#
# These variables are required by:
#   - victoriametrics-query skill (from victoriametrics-tools marketplace)
#   - victorialogs-query skill
#   - alertmanager-query skill
#
# Re-run scripts/bootstrap.sh --force to regenerate.

export VM_METRICS_URL="${VM_METRICS_URL_VAL}"
export VM_LOGS_URL="${VM_LOGS_URL_VAL}"
export VM_ALERTMANAGER_URL="${VM_ALERTMANAGER_URL_VAL}"
ENVEOF

chmod 600 "$ENV_FILE"
log_ok "Env file written (mode 600)"
echo

# Shell rc integration hint
RC_FILE="$(shell_rc_file)"
SOURCE_LINE='[ -f ~/.config/atlas/env ] && source ~/.config/atlas/env'

log_info "Next step: make these variables available in your shell."
echo

if [ -n "$RC_FILE" ]; then
  if [ -f "$RC_FILE" ] && grep -qF "$SOURCE_LINE" "$RC_FILE" 2>/dev/null; then
    log_ok "Source line already present in ${RC_FILE}"
  else
    cat <<HINTEOF
Add this line to ${C_BOLD}${RC_FILE}${C_RESET}:

  ${C_GREEN}${SOURCE_LINE}${C_RESET}

Or run this once:

  ${C_GREEN}echo '${SOURCE_LINE}' >> ${RC_FILE}${C_RESET}

Then reload your shell:

  ${C_GREEN}source ${RC_FILE}${C_RESET}

HINTEOF
  fi
else
  log_warn "Could not detect your shell rc file. Add this line manually to your shell config:"
  echo "  ${SOURCE_LINE}"
  echo
fi

# Next steps
cat <<NEXTEOF
${C_BOLD}=== Setup complete ===${C_RESET}

To use the plugin, start Claude Code:

  ${C_GREEN}claude${C_RESET}

Then inside Claude Code (first time only):

  ${C_GREEN}/plugin marketplace add Org-Engineering/atlas-claude-plugins${C_RESET}
  ${C_GREEN}/plugin marketplace add VictoriaMetrics/skills${C_RESET}
  ${C_GREEN}/plugin install k8s-tools@atlas-claude-plugins${C_RESET}
  ${C_GREEN}/plugin install query@victoriametrics-tools${C_RESET}

If you cloned this repo and opened it in Claude Code, the marketplaces
will be suggested automatically (via .claude/settings.json).

NEXTEOF
What the script does:
- detects the operating system – macOS or Linux, since utilities like
dateandseddiffer a bit between them - checks that all required utilities are installed; if not – suggests an install command
- checks for the existence of the
~/.config/atlas/envfile - asks for values for the
VM_METRICS_URL,VM_LOGS_URL,VM_ALERTMANAGER_URLvariables, offers defaults but lets you override- one nuance specific to our setup –
VM_ALERTMANAGER_URLdoesn’t have an Ingress/ALB, so the connection is via localhost – I’ll set it up properly later, since previously only I used it and I was fine doingkubectl port-forward
- one nuance specific to our setup –
- tries to connect to
VM_METRICS_URL– checks that VPN is on and the endpoints are reachable - writes the variables to
~/.config/atlas/env - detects the user shell (
zsh,bash) and shows the user how to add~/.config/atlas/envto their shell rc - and at the end, prints out the commands “how to add the marketplace and the plugin“
Let’s run it and check that everything works:

I forgot to run kubectl port-forward to Alertmanager – so I got “[WARN] Alertmanager not reachable“.
Verifying the Marketplace and Plugin
At this point, everything is basically ready.
But before adding CLAUDE.md and README.md and pushing to the repo – let’s test locally that everything works.
Switch to a test directory and start Claude Code:
$ cd /tmp && mkdir -p test-plugin && cd test-plugin
$ claude
Confirm trust for the directory:

Add the marketplace:
/plugin marketplace add ~/Work/Org/atlas-claude-plugins

Verify it was added:

Install the plugin itself:
/plugin install k8s-tools@atlas-claude-plugins

Pick “Install for you (user scope)“.
Run /reload-plugins:

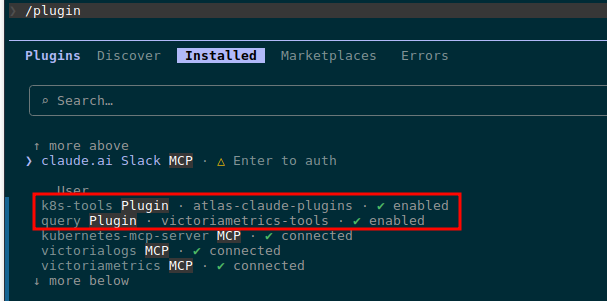
Check under Installed:

Verify the agent itself:

Let’s try a debug run – find a problem Pod:
$ kk get pod -A | grep -v Running
NAMESPACE                   NAME                                                              READY   STATUS        RESTARTS      AGE
ops-monitoring-ns           atlas-victoriametrics-grafana-5f8ff65758-tbwzb                    0/3     Completed     0             8d

We can see the agent found and read the skill at ~/.local/share/claude-code/plugins/k8s-troubleshooting-flow/skill.md.
And the debug result:

The CLAUDE.md file
CLAUDE.md is a file that Claude Code automatically picks up as context when someone is working with the repo. So when I open the repo in Claude Code six months from now to add a new plugin or fix an existing one – Claude will immediately understand what this project is.
Important not to confuse it with README.md:
CLAUDE.md: for those who add/modify plugins in the repo via Claude CodeREADME.md: for plugin users (developers who install and use the agent)
What goes into CLAUDE.md:
- repo structure with comments explaining what’s where
- rules and naming conventions – code comments in English, read-only by default, Kubernetes resources capitalized, env naming
- how to add a new plugin to the existing marketplace
- versioning rules
- how to test locally before pushing
- how to publish to GitHub
The full content:
# atlas-claude-plugins

Claude Code plugins for Org DevOps - Kubernetes debugging and operations.

## Repo structure

```
.claude-plugin/marketplace.json    # marketplace manifest, lists all plugins
.claude/settings.json              # extraKnownMarketplaces (auto-suggest on clone)
plugins/<plugin-name>/             # one directory per plugin
  .claude-plugin/plugin.json       # plugin metadata
  agents/<agent-name>.md           # agent definitions (filename = name in frontmatter)
  skills/<skill-name>/SKILL.md     # skills (each in its own directory)
  commands/<command-name>.md       # slash commands (optional)
scripts/bootstrap.sh               # user setup (env vars, deps check)
```

## Conventions

- **Code comments in English** always, regardless of context language
- **Agents are read-only by default**: explicit `allowed-tools` whitelist + `deny-tools` blacklist for write operations (kubectl write verbs, curl POST/PUT/DELETE, file writes)
- **Kubernetes resources capitalized in prose**: Pod, Deployment, Namespace, Service, etc
- **Env vars follow VictoriaMetrics convention**: `VM_METRICS_URL`, `VM_LOGS_URL`, `VM_ALERTMANAGER_URL` (so VM skills work without aliasing)
- **User config lives in `~/.config/atlas/env`** - never in repo, never in shell rc directly

## Adding a new plugin

1. Create `plugins/<name>/.claude-plugin/plugin.json` with name, version, description
2. Add agent(s) in `plugins/<name>/agents/<agent>.md` - frontmatter `name` must match filename
3. Add skill(s) in `plugins/<name>/skills/<skill>/SKILL.md` - directory name must match skill `name`
4. Register in `.claude-plugin/marketplace.json` under `plugins[]` array
5. Bump marketplace `version` in `marketplace.json`

## Versioning

- Each plugin has independent semver in its `plugin.json`
- Marketplace `version` in `marketplace.json` bumps when plugin list changes (add/remove)
- Plugin patch version bumps for prompt/skill content changes
- Plugin minor version bumps for new capabilities (new tools, new entry points)
- Plugin major version bumps for breaking changes (renamed agent, removed permissions)

## Testing locally

```bash
# 1. Run bootstrap (sets up env file + checks deps)
./scripts/bootstrap.sh

# 2. Source env in current shell (or open new shell if added to rc)
source ~/.config/atlas/env

# 3. Start Claude in some unrelated directory (NOT this repo)
cd /tmp && mkdir -p test-claude && cd test-claude && claude

# 4. Inside Claude, add this repo as local marketplace
/plugin marketplace add /path/to/atlas-claude-plugins
/plugin install <plugin-name>@atlas-claude-plugins

# 5. Verify agent loaded
/agents
# should show: Plugin agents - <plugin>:<agent>

# 6. Test the agent with a real task
> Use <agent-name> to debug pod foo in namespace bar
```

After changes to plugin files: `/plugin marketplace update atlas-claude-plugins` reloads.

## Publishing

```bash
git add -A
git commit -m "..."
git push origin master
```

Users on the next `/plugin marketplace update` get the changes. Or, if they cloned the repo, `extraKnownMarketplaces` in `.claude/settings.json` auto-suggests the marketplace on first open.

## Dependencies

- Plugins use `kubectl` + `curl` directly (no MCP servers)
- VictoriaMetrics observability via `query` plugin from `VictoriaMetrics/skills` marketplace - listed as suggested in `.claude/settings.json`
- Agents must work with read-only kubectl perms - never assume write access
The README.md file
And the last file – purely for developers: what’s in the repo, how to use it:

That’s pretty much it.
Push to the repo and verify once more.
Verifying extraKnownMarketplaces
Remove the already installed marketplace:
/plugin marketplace remove atlas-claude-plugins
Check that it’s gone:
 Create a test directory:
$ mkdir /tmp/test-extra && cd /tmp/test-extra
Clone the repo and start Claude Code in it:
$ git clone [email protected]:Org-Engineering/atlas-claude-plugins.git

$ cd atlas-claude-plugins/

$ claude
Confirm trust for the directory:

Check the marketplaces – we have both our atlas-claude-plugins and victoriametrics-tools:

Install the plugins from these marketplaces:
/plugin install k8s-tools@atlas-claude-plugins
/plugin install query@victoriametrics-tools
Verify:
Done.
![]()