 This is the second part of the LiteLLM monitoring series – in the previous one, we covered the general integration with VictoriaStack and looked at the metrics and traces we get from LiteLLM (see LiteLLM: metrics, traces, and integration with the VictoriaMetrics Stack).
Now let’s move on to the practical part – what to monitor and how to organize it.
That said, although LiteLLM is already running in production for us, the system is still in the “polishing” and “watching how it behaves” phase, so the alerts and dashboards described in this post are not the final version – it’s more of a demonstration of possible approaches to keeping LiteLLM under control, plus some examples of queries to VictoriaMetrics and VictoriaTraces.
Today we’ll focus on the two main monitoring components – alerts and Grafana dashboards, because we have a lot of metrics, and first we need to define a basic set of data to start building the monitoring of the system from.
All posts in this series:
- LiteLLM: AI Gateway for LLMs – Features Overview
- LiteLLM: AI Gateway on Kubernetes and Metrics in VictoriaMetrics
- LiteLLM: Metrics, Traces, and VictoriaMetrics Stack Integration
- (current) LiteLLM: Monitoring with VictoriaMetrics – Alerts and Grafana
And more are coming soon, so stay tuned for updates and follow my Telegram channel @rtfmcoua_en or LinkedIn group RTFM! DevOps[at]UA.
Contents
Alerts
We have a few main components to monitor and alert on:
- the system itself: general alerts on Pods status, failed requests, latency, in-flight requests
- Redis: the status of Redis itself and its Pods, errors
- for a real production, you could add the Redis Prometheus exporter
- PostgreSQL: of course, the database server needs monitoring too – but in my case it’s an already existing server, and it’s been “covered with monitoring” for a long time
- Redis: the status of Redis itself and its Pods, errors
- providers/LLM: model status, failed responses, latency
- costs, tokens, budgets, and limits: system usage by Teams, API Keys, and by services and users in general
System status: LiteLLM status
See also Monitor System Health.
What matters to us here:
- Pods number: checking Deployment desired Pods vs current running Pods
- Pods resources: CPU/RAM used – didn’t make a dedicated alert, the general ones are enough
- Failed requests: this is specifically about failures from clients to LiteLLM
- alerting on the
litellm_proxy_failed_requests_metric_totalmetric
- alerting on the
- Latency: we’ll add alerts later, for now it’s just in a Grafana dashboard:
litellm_request_total_latency_metric: total request processing time – from the moment the request is received from the client + LiteLLM overhead + sending to the LLM provider + waiting and returning the response to the clientlitellm_llm_api_latency_metric: only the response time from the provider/LLMlitellm_overhead_latency_metric: how much of the totallitellm_request_total_latency_metricwas spent by LiteLLM itself – watching it for now, later we can add an alertlitellm_self_latency: auth, routing, logging callbacks (prometheus,otel), spend tracking calculations, Redis and PostgreSQL operations – everything LiteLLM does before and after the request to OpenAI/Anthropic
- LiteLLM HTTP requests: the number of active requests being processed on uvicorn workers – the
litellm_in_flight_requestsmetric
The “Kubernetes LiteLLM Pods/Deployment status” alert
Generally, this is a standard alert that most Helm charts have out of the box – but I created a dedicated one specifically for LiteLLM:
---
apiVersion: operator.victoriametrics.com/v1beta1
kind: VMRule
metadata:
  name: alerts-litellm-system
spec:

  groups:

  - name: LiteLLM.System.Error.rules

    rules:

    # Deployment not matching replicas
    - alert: LiteLLM System Pods Not Ready
      expr: kube_deployment_status_replicas_ready{namespace="ops-litellm-ns"} < kube_deployment_spec_replicas{namespace="ops-litellm-ns"}
      for: 3m
      labels:
        component: devops
        environment: ops
        severity: critical
        ilert_routingkey: devops-ops-critical
      annotations:
        summary: LiteLLM System Pods Not Ready
        description: |-
          LiteLLM System pods are not ready for more than `{{ "{{" }} $for }}`
          *Namespace*: `{{ "{{" }} $labels.namespace }}`
          *Deployment*: `{{ "{{" }} $labels.deployment }}`
          *Ready replicas*: `{{ "{{" }} $labels.ready_replicas }}`
          *Replicas*: `{{ "{{" }} $labels.replicas }}`
          <https://{{ $.Values.monitoring.root_url }}/d/adtt9jj/adrmshg/litellm-system-overview |:grafana: LiteLLM System overview>
Redis alerts
A few alerts specifically for Redis.
The code with the metrics in LiteLLM itself is in prometheus_services.py (because sometimes I had to look there instead of the documentation – although overall the documentation is great).
The “LiteLLM Redis Pods Not Ready” alert
The “Redis Pods Not Ready” alert is similar to the previous one, we just check the number of Pods in Ready vs how many should be in the StatefulSet:
- alert: LiteLLM Redis Pods Not Ready
  expr: kube_statefulset_status_replicas_ready{namespace="ops-litellm-ns", statefulset="litellm-redis-master"} < kube_statefulset_replicas{namespace="ops-litellm-ns", statefulset="litellm-redis-master"}
  for: 1s
  labels:
    component: devops
    environment: ops
    severity: critical
    ilert_routingkey: devops-ops-critical
  annotations:
    summary: LiteLLM Redis Pods Not Ready
    description: |-
      LiteLLM Redis Pods are not ready for more than `{{ "{{" }} $for }}`
      *StatefulSet*: `{{ "{{" }} $labels.statefulset }}`
      *Ready replicas*: `{{ "{{" }} $value }}`
      <https://{{ $.Values.monitoring.root_url }}/d/adtt9jj/adrmshg/litellm-system-overview |:grafana: LiteLLM System overview>
The “LiteLLM Redis Failed Requests” alert
An alert on litellm_redis_failed_requests_total – errors when executing requests from LiteLLM to Redis: it’s incremented on every error in try/except in redis_cache.py, for example on errors when pinging the Redis instance or errors when working with the cache (reads/writes).
In the documentation it’s described as “litellm_redis_fails“, but in 1.91.0 it’s created as litellm_redis_failed_requests_total, and the “litellm_redis_fails” metric is no longer in the code at all.
The labels should be ["error_class", "function_name"] – we’ll see what shows up there, because so far there have been no errors at all, so the alert is as simple as it gets:
- alert: LiteLLM Redis Failed Requests
  expr: rate(litellm_redis_failed_requests_total[5m]) > 0
  for: 1s
  labels:
    component: devops
    environment: ops
    severity: critical
    ilert_routingkey: devops-ops-critical
  annotations:
    summary: LiteLLM Redis Failed Requests
    description: |-
      LiteLLM Redis failed requests have been above 0 for more than `{{ "{{" }} $for }}`
      *Failed requests*: `{{ "{{" }} $value }}`
For PostgreSQL, there are the litellm_postgres_total_requests_total and litellm_postgres_latency_sum metrics, and there should be litellm_postgres_failed_requests_total – but again, there have been no errors so far, so the metric is empty.
Still, you can add the same simple alert as for Redis, just on litellm_postgres_failed_requests_total.
The “LiteLLM Proxy Failed Requests” alert
A dedicated alert for failed responses from LiteLLM to clients – when, after all the retry request or fallback attempts, we still returned an error to the client:
- alert: LiteLLM Proxy Failed Requests
  expr: |
    sum (rate(litellm_proxy_failed_requests_metric_total[5m])) by (api_key_alias, exception_class, exception_status, requested_model) > 0
  for: 1s
  labels:
    component: devops
    environment: ops
    severity: warning
    ilert_routingkey: devops-ops-warning
  annotations:
    summary: LiteLLM Proxy Failed Requests
    description: |-
      LiteLLM proxy failed requests have been above 0 for more than `{{ "{{" }} $for }}`
      *API key alias*: `{{ "{{" }} $labels.api_key_alias }}`
      *Exception class*: `{{ "{{" }} $labels.exception_class }}`
      *Exception status*: `{{ "{{" }} $labels.exception_status }}`
      *Requested model*: `{{ "{{" }} $labels.requested_model }}`
      <https://{{ $.Values.monitoring.root_url }}/d/adrmshg/litellm-system-overview |:grafana: LiteLLM System overview>
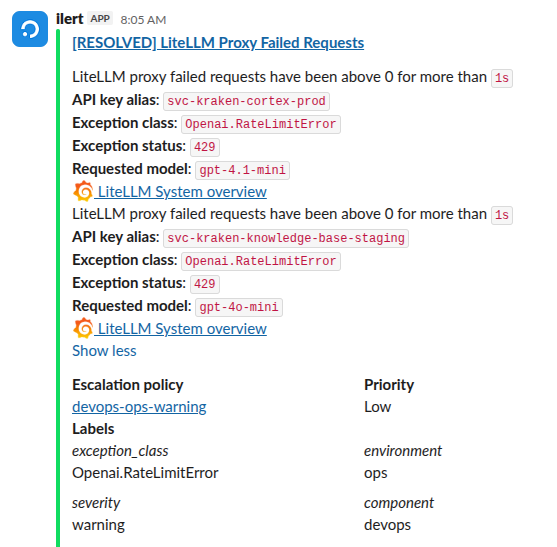
The exception_class and exception_status labels are useful here, an example of the alert:
And there’s a dedicated alert for our Backend API with label_replace, where an additional label named environment is created – to properly configure alert routing to different Slack channels (see ilert: an Opsgenie alternative – first look, Alertmanager, Slack):
...
    # create a metric with the environment label
    - record: litellm:proxy:failed_requests:environment
      expr: |
        label_replace(
          litellm_proxy_failed_requests_metric_total,
          "environment", "$1",
          "api_key_alias", ".*-(ops|dev|staging|prod)$"
        )

    # BACKEND
    {{- range .Values.alerts.litellm.backend }}
    {{- $env := . }}
    {{- range .severities }}
    - alert: LiteLLM Kraken Proxy Failed Requests
      expr: |
        sum (rate(litellm:proxy:failed_requests:environment{environment="{{ $env.env }}"}[5m])) by (api_key_alias, exception_class, exception_status, requested_model) > 0
      for: 1s
      labels:
        severity: {{ . }}
        component: backend
        environment: {{ $env.env }}
        ilert_routingkey: backend-{{ $env.env }}-{{ . }}
      annotations:
        summary: "LiteLLM Kraken Proxy Failed Requests"
        description: |-
          LiteLLM Kraken proxy failed requests have been above 0 for more than `{{ "{{" }} $for }}`
          *API key alias*: `{{ "{{" }} $labels.api_key_alias }}`
          *Exception class*: `{{ "{{" }} $labels.exception_class }}`
          *Exception status*: `{{ "{{" }} $labels.exception_status }}`
          *Requested model*: `{{ "{{" }} $labels.requested_model }}`
          <https://{{ $.Values.monitoring.root_url }}/d/adtt9jj/litellm-services-overview?orgId=1&from=now-2d&to=now&timezone=browser&var-datasource_vm=VictoriaMetrics|:grafana: Litellm Overview>
    {{- end }}
    {{- end }}
Here, the last part of the api_key_alias value is taken and set as the environment label (although you could just pass the environment in the metadata, see Custom Metadata Labels, but that requires code changes).
As for key names, we have a naming convention: <type>-<component>-<feature>-<env>, for example – svc-kraken-cortex-dev, where:
svc: the API key type – Service Account (for regular users – theusrprefix)kraken: our Backend APIcortex: a specific backend feature/servicedev: the environment
For now I’ll watch how this litellm:proxy:failed_requests:environment metric and the default litellm_proxy_failed_requests_metric_total behave – then I’ll decide which one to keep. Or maybe it’ll stay as is – a kind of “system” alert with litellm_proxy_failed_requests_metric_total, and a per-service one with the dedicated litellm:proxy:failed_requests:environment.
There’s also an interesting nuance with RateLimitError errors here – see the “OpenAI and the RateLimitError” part below.
The “LiteLLM In-Flight Requests” alert
A useful metric for monitoring the system load is litellm_in_flight_requests: it’s described in the documentation in the Pod Health Metrics section, and shows how many HTTP requests LiteLLM is processing right now.
There’s even an example of how to use it:
– high in_flight_requests + high ALB TargetResponseTime → pod overloaded, scale out
– low in_flight_requests + high ALB TargetResponseTime → delay is pre-ASGI (event loop blocking)
For now, I’ve just made a simple alert on the number of requests – we’ll see what the values look like, and maybe I’ll rework this alert a bit:
    # In Flight Requests HTTP requests currently in-flight on uvicorn workers
    - alert: LiteLLM In Flight Requests
      expr: |
        avg(litellm_in_flight_requests) > 5
      for: 1s
...
Provider/LLM alerts
A separate group of alerts for the status of the providers themselves: here we send notifications if LiteLLM clients get errors from OpenAI/Anthropic.
The “LiteLLM Deployment/Model Not Ready” alert
The litellm_deployment_state metric returns the values 0 = healthy, 1 = partial outage, 2 = complete outage, and it’s incremented when the provider returned a code != 200 to a client’s request, so in general it makes sense to alert on it:
# Deployment/Model not ready
- alert: LiteLLM Deployment/Model Not Ready
  expr: max(litellm_deployment_state) by (api_base, litellm_model_name) > 0
  for: 1s
  labels:
    component: devops
    environment: ops
    severity: critical
    ilert_routingkey: devops-ops-critical
  annotations:
    summary: LiteLLM Deployment/Model Not Ready
    description: |-
      LiteLLM deployment/model is not ready for more than `{{ "{{" }} $for }}`
      *Model State*: `{{ "{{" }} if eq $value 1.0 {{ "}}" }}1 - Partial outage{{ "{{" }} else if eq $value 2.0 {{ "}}" }}2 - Complete outage{{ "{{" }} else {{ "}}" }}Unknown{{ "{{" }} end {{ "}}" }}`
      *Model name*: `{{ "{{" }} $labels.litellm_model_name }}`
      *API base*: `{{ "{{" }} $labels.api_base }}`
      <https://{{ $.Values.monitoring.root_url }}/d/adtt9jj/adrmshg/litellm-system-overview |:grafana: LiteLLM System overview>
Although the next alert will be more useful, and the litellm_deployment_state metric can just be used in Grafana.
The “LiteLLM Deployment/Model Failure Responses” alert
There’s a separate metric litellm_deployment_failure_responses_total – errors from the provider.
It’s similar to litellm_proxy_failed_requests_metric_total and even has the same exception_class and exception_status labels – but litellm_deployment_failure_responses_total is incremented on every error from the provider, while litellm_proxy_failed_requests_metric_total – after all the retries/fallbacks by LiteLLM itself.
For now, I’ve made both alerts – we’ll see which one turns out to be more useful.
The alert itself can look like this:
- alert: LiteLLM Deployment/Model Failure Responses
  expr: |
    sum(increase(litellm_deployment_failure_responses_total[5m])) by (api_key_alias, exception_class, exception_status, requested_model, team_alias, user_agent) > 0
  for: 1s
  labels:
    component: devops
    environment: ops
    severity: critical
    ilert_routingkey: devops-ops-warning
  annotations:
    summary: LiteLLM Deployment/Model Failure Responses
    description: |-
      LiteLLM deployment/model failure responses have been above 0 for more than `{{ "{{" }} $for }}`
      *API key alias*: `{{ "{{" }} $labels.api_key_alias }}`
      *Exception class*: `{{ "{{" }} $labels.exception_class }}`
      *Exception status*: `{{ "{{" }} $labels.exception_status }}`
      *Team alias*: `{{ "{{" }} $labels.team_alias }}`
      *User agent*: `{{ "{{" }} $labels.user_agent }}`
Budgets
A dedicated VMRule for the budgets we set for Teams and API Keys.
The “LiteLLM Budget Low” alert
We send an alert if a Team has less than 10% of its budget left:
- alert: LiteLLM Team Costs Budget Low
  expr: |
    (
      sum by (team, team_alias) (litellm_remaining_team_budget_metric)
      /
      sum by (team, team_alias) (litellm_team_max_budget_metric)
    ) < 0.1
  for: 1s
  labels:
    component: devops
    environment: ops
    severity: warning
    ilert_routingkey: devops-ops-warning
  annotations:
    summary: LiteLLM Team Budget Low
    description: |-
      LiteLLM team budget is less than 10% remaining for more than `{{ "{{" }} $for }}`
      *Team*: `{{ "{{" }} $labels.team_alias }}`
      *Budget left percentage*: `{{ "{{" }} $value | humanizePercentage }}`%
      <https://{{ $.Values.monitoring.root_url }}/d/adtt9jj/adrmshg/litellm-system-overview |:grafana: LiteLLM System overview>
And a similar one – for API Keys, with the litellm_remaining_api_key_budget_metric metric:
- alert: LiteLLM API Key Budget Low
  expr: |
    (
      sum by (api_key_alias) (litellm_remaining_api_key_budget_metric)
      /
      sum by (api_key_alias) (litellm_api_key_max_budget_metric)
    ) < 0.1
  for: 1s
  labels:
    component: devops
    environment: ops
    severity: warning
    ilert_routingkey: devops-ops-warning
  annotations:
    summary: LiteLLM API Key Budget Low
    description: |-
      LiteLLM API Key budget is less than 10% remaining for more than `{{ "{{" }} $for }}`
      *API Key*: `{{ "{{" }} $labels.api_key_alias }}`
      *Budget left percentage*: `{{ "{{" }} $value | humanizePercentage }}`%
      <https://{{ $.Values.monitoring.root_url }}/d/adtt9jj/adrmshg/litellm-system-overview |:grafana: LiteLLM System overview>
Limits
One more group – for Requests and Tokens per minute.
Here we can have limits from the provider as well as those we set ourselves for an API Key, and maybe it makes sense to split them – but for now I’ve put them in one VMRule, just in different groups.
The OpenAI quirk and “RateLimitError” errors
An interesting nuance came up: OpenAI returns 429 “RateLimitError” in two cases:
- when you actually hit the TPM/RPM limit
- and when the account has run out of money
So alerts on litellm_proxy_failed_requests_metric_total or litellm_deployment_failure_responses_total will fire in both cases – but for different reasons, and I spent a few hours trying to understand why our litellm_remaining_requests_metric value wasn’t dropping – while we were still catching RateLimitError.
And OpenAI’s own documentation, Example rate limit error, makes it even more confusing, because it shows a RateLimitError example with 'code': 'insufficient_quota' – while the explanation text says “when API requests are sent too quickly“.
Maybe LiteLLM will change this somehow later, because the difference is visible in traces, and you can create dedicated metrics (see the example below).
The “LiteLLM OpenAI Quota Exhausted” alert
So instead of using litellm_proxy_failed_requests_metric_total and litellm_deployment_failure_responses_total (the alerts with them stay for now), I did it differently: added a dedicated RecordingRule that checks the value of the event:event_attr:exception.message field in traces and increments the vmtraces:litellm:openai:insufficient_quota:rate metric only when the text contains code: "insufficient_quota":
- name: LiteLLM.VictoriaTraces.OpenAI.rules
  type: vlogs
  interval: 1m

  rules:

    # OpenAI returns HTTP 429 both for actual rate limiting and exhausted quota.
    # Match the structured error code in the LiteLLM exception to distinguish them.
    - record: vmtraces:litellm:openai:insufficient_quota:rate
      expr: |
        {resource_attr:service.name="litellm"} "event:event_attr:exception.message:0":~"\"code\":\\s*\"insufficient_quota\"\\s*\\}\\s*\\}"
        | stats by ("resource_attr:service.name") rate() errors_per_second
And then with this metric – a dedicated alert specifically for the “Not enough gold, my Lord!” (c) case:
- name: LiteLLM.Provider.Quota.rules

  rules:

  # This is separate from rate-limit alerts because OpenAI uses HTTP 429 for
  # both rate limiting and an exhausted account/project quota.
  - alert: LiteLLM OpenAI Quota Exhausted
    expr: vmtraces:litellm:openai:insufficient_quota:rate{stats_result="errors_per_second"} > 0
    for: 1s
    labels:
      component: devops
      environment: ops
      severity: critical
      ilert_routingkey: devops-ops-critical
    annotations:
      summary: LiteLLM OpenAI Quota Exhausted
      description: |-
        OpenAI rejected a LiteLLM request with `insufficient_quota`. The account or project has run out of credits; please add funds.
        *Service name*: `{{ "{{" }} index $labels "resource_attr:service.name" }}`
        <https://platform.openai.com/settings/organization/billing/overview |:openai: OpenAI billing overview>
Similarly, you can create a metric and an alert for the actual RPM/TPM limits from the provider, something like this:
{resource_attr:service.name="litellm"}
"event:event_attr:exception.message:0":~"(rate_limit_exceeded|Rate limit reached)"
-"insufficient_quota"
But it needs to be verified once we get errors specifically on the RPM/TPM limits – haven’t had any yet.
The “Provider RPM and TPM Rate Limits” alerts
Added this alert – to send a notification if we’re about to hit the provider’s RPM/TPM limit:
- alert: LiteLLM Provider RPM Rate Limit Low
  # less then 10% of the limit, limit taken by the max_over_time which is reseted every minute
  expr: |
    (
      sum by (api_key_alias, api_provider, model_group, litellm_model_name) (litellm_remaining_requests_metric)
      /
      sum by (api_key_alias, api_provider, model_group, litellm_model_name) (max_over_time(litellm_remaining_requests_metric[1h]))
    ) < 0.1
  for: 1s
  labels:
    component: devops
    environment: ops
    severity: warning
    ilert_routingkey: devops-ops-warning
  annotations:
    summary: LiteLLM Provider RPM Rate Limit Low
    description: |-
      LLM Provider rate limit is less than 10% of the limit for more than `{{ "{{" }} $for }}`
      *API key alias*: `{{ "{{" }} $labels.api_key_alias }}`
      *API provider*: `{{ "{{" }} $labels.api_provider }}`
      *Model group*: `{{ "{{" }} $labels.model_group }}`
      *Model name*: `{{ "{{" }} $labels.litellm_model_name }}`
      *Rate limit left percentage*: `{{ "{{" }} $value | humanizePercentage }}`%
      <https://{{ $.Values.monitoring.root_url }}/d/adtt9jj/adrmshg/litellm-system-overview |:grafana: LiteLLM System overview>
The idea here is that the value in litellm_remaining_requests_metric should reset every minute (since the limit is per minute after all), and from it we calculate “the percentage of the current number of requests out of the maximum available”, meaning:
- in
max_over_time(litellm_remaining_requests_metric[1h])we take the maximum value – this should be the overall limit from the provider - and in
litellm_remaining_requests_metricwe have the current remainder of the limit
But honestly, I’m not sure this will work – because the alerts’ evaluation interval is once per minute, and most likely the “window” for the alert will be missed.
You can set a smaller interval for the LiteLLM VMPodScrape:
...
podMetricsEndpoints:
  - port: http
    path: /metrics/
    interval: 15s
But keep in mind that decreasing the interval in the Scrape Job will increase the number of samples in the VictoriaMetrics database (see VictoriaMetrics: Churn Rate, High cardinality, metrics, and IndexDB – I covered Metric vs Time Series vs Samples there).
If we decrease the interval for metrics collection – we also decrease the evaluation interval specifically for this VMRules group:
...

  - name: LiteLLM.Provider.Limits.rules
    interval: 10s

    rules:

    # by (api_key_alias, api_provider, model_group, litellm_model_name)

    # RPM Rate limit low
    - alert: LiteLLM Provider RPM Rate Limit Low
      # less then 10% of the limit, limit taken by the max_over_time which is reseted every minute
      expr: |
        (
          sum by (api_key_alias, api_provider, model_group, litellm_model_name) (litellm_remaining_requests_metric)
          /
          sum by (api_key_alias, api_provider, model_group, litellm_model_name) (max_over_time(litellm_remaining_requests_metric[1h]))
        ) < 0.1

...
We’ll see, maybe I’ll rework it later or remove it entirely, although overall the alert looks useful.
Similarly – an alert for the TPM limit, with the litellm_remaining_tokens_metric metric:
    - alert: LiteLLM Provider TPM Rate Limit Low
      # less then 10% of the limit, limit taken by the max_over_time which is reseted every minute
      expr: |
        (
          sum by (api_key_alias, api_provider, model_group, litellm_model_name) (litellm_remaining_tokens_metric)
          /
          sum by (api_key_alias, api_provider, model_group, litellm_model_name) (max_over_time(litellm_remaining_tokens_metric[1h]))
        ) < 0.1
      for: 1s
...
The “LiteLLM API Key RPM and TPM Rate Limit” alerts
Similar alerts – but for the limits we set ourselves for keys in LiteLLM, and with the same evaluation interval problem.
The RPM alert:
- alert: LiteLLM API Key RPM Rate Limit Low
  expr: |
    (
      sum by (api_key_alias, model) (litellm_remaining_api_key_requests_for_model)
      /
      sum by (api_key_alias, model) (max_over_time(litellm_remaining_api_key_requests_for_model[1h]))
    ) < 0.1
  for: 1s
  labels:
    component: devops
    environment: ops
    severity: warning
    ilert_routingkey: devops-ops-warning
  annotations:
    summary: LiteLLM API Key RPM Rate Limit Low
    description: |-
      LiteLLM API key rate limit is less than 10% of the limit for more than `{{ "{{" }} $for }}`
      *API key alias*: `{{ "{{" }} $labels.api_key_alias }}`
      *Model*: `{{ "{{" }} $labels.model }}`
      *Rate limit left percentage*: `{{ "{{" }} $value | humanizePercentage }}`%
And the TPM one:
    - alert: LiteLLM API Key TPM Rate Limit Low
      expr: |
        (
          sum by (api_key_alias, model) (litellm_remaining_api_key_tokens_for_model)
          /
          sum by (api_key_alias, model) (max_over_time(litellm_remaining_api_key_tokens_for_model[1h]))
        ) < 0.1
      for: 1s
...
Metrics and Alerts from VictoriaLogs
A couple of examples of how we can create metrics and alerts with Recording Rules. I wrote about Recording Rules in more detail in the post VictoriaLogs: creating Recording Rules with VMAlert.
They don’t make much sense right now – the ones described below I made at the very beginning, when we were just switching our Backend API, to have an alert on errors in the Backend API itself in addition to LiteLLM’s own metrics – but let them stay here as an example.
Here, the “LLM request failed” and “Invalid model name passed” errors are grepped from the Backend API’s logs, and the vmlogs:litellm:logs:kraken:llm_request_failed:rate and vmlogs:litellm:logs:kraken:invalid_model_name_passed:rate metrics are generated:
- name: LiteLLM.VictoriaLogs.Logs.rules
  type: vlogs
  interval: 1m

  rules:

    - record: vmlogs:litellm:logs:kraken:llm_request_failed:rate
      expr: |
        component:="backend" | "LLM request failed"
        | extract_regexp "Error code: (?P<error_code>\\d+).*"
        | extract_regexp "'message': '(?P<rate_error_msg>[^']+)'"
        | extract_regexp `'message': \\"(?P<auth_error_msg>[^":,]+)`
        | stats by (container, namespace, error_code, rate_error_msg, auth_error_msg) rate()

    - record: vmlogs:litellm:logs:kraken:invalid_model_name_passed:rate
      expr: |
        component:="backend" | "Invalid model name passed"
        | extract_regexp "Error code: (?P<error_code>\\d+).*"
        | extract_regexp "'message': '(?P<error_msg>[^']+)'"
        | stats by (container, namespace, error_code, error_msg) rate()
And then, with these metrics, we have two alerts:
    {{- range .Values.alerts.litellm.backend }}
    {{- $ns := . }}
    {{- range .severities }}
    - alert: LiteLLM Kraken LLM Error Rate High
      expr: avg(vmlogs:litellm:logs:kraken:llm_request_failed:rate{namespace="{{ $ns.namespace }}"}) by (container, namespace, error_code, rate_error_msg, auth_error_msg) > 0
      for: 1s
      labels:
        severity: {{ . }}
        component: backend
        environment: {{ $ns.env }}
        ilert_routingkey: backend-{{ $ns.env }}-{{ . }}
      annotations:
        summary: "LiteLLM Kraken LLM Error Rate High"
        description: |-
          LiteLLM Kraken LLM error rate has been above 0 for more than `{{ "{{" }} $for }}`
          *Error code*: `{{ "{{" }} $labels.error_code }}`
          *Error message*: {{ "{{" }} $labels.rate_error_msg }}
          *Auth error message*: `{{ "{{" }} $labels.auth_error_msg }}`
          *Container*: `{{ "{{" }} $labels.container }}`
          *Namespace*: `{{ "{{" }} $labels.namespace }}`
          <https://{{ $.Values.monitoring.root_url }}/d/adtt9jj/litellm-services-overview?orgId=1&from=now-2d&to=now&timezone=browser&var-datasource_vm=VictoriaMetrics|:grafana: Litellm Overview>
    {{- end }}
    {{- end }}

...

    - alert: LiteLLM Kraken Invalid Model Name Passed Error Rate High
      expr: avg(vmlogs:litellm:logs:kraken:invalid_model_name_passed:rate{namespace="{{ $ns.namespace }}"}) by (container, namespace, error_code, error_msg) > 0
      for: 1s
...
Grafana dashboards
This post has already turned out long – but I don’t see the point in splitting the Grafana dashboards into a separate one, so let it be here – just briefly.
The LiteLLM repository has its own dashboards – but they’re just… meh.
So, as I usually do, I created my own “overview dashboards”, two of them – one more “system-oriented”, about the state of the service itself, the other more product-oriented, with information on Costs by different services and clients.
Although in some recent upgrade Grafana added support for Tabs, when you can have two separate sets of visualizations on one board – I went old-school and made separate boards.
I will 100% be reworking them along the way – but for now it’s like this, minimally useful information.
The “LiteLLM System Overview” dashboard
Just general data on the usage and state of the system itself – this one is more for me, purely “technical”, so I didn’t even add any filters.
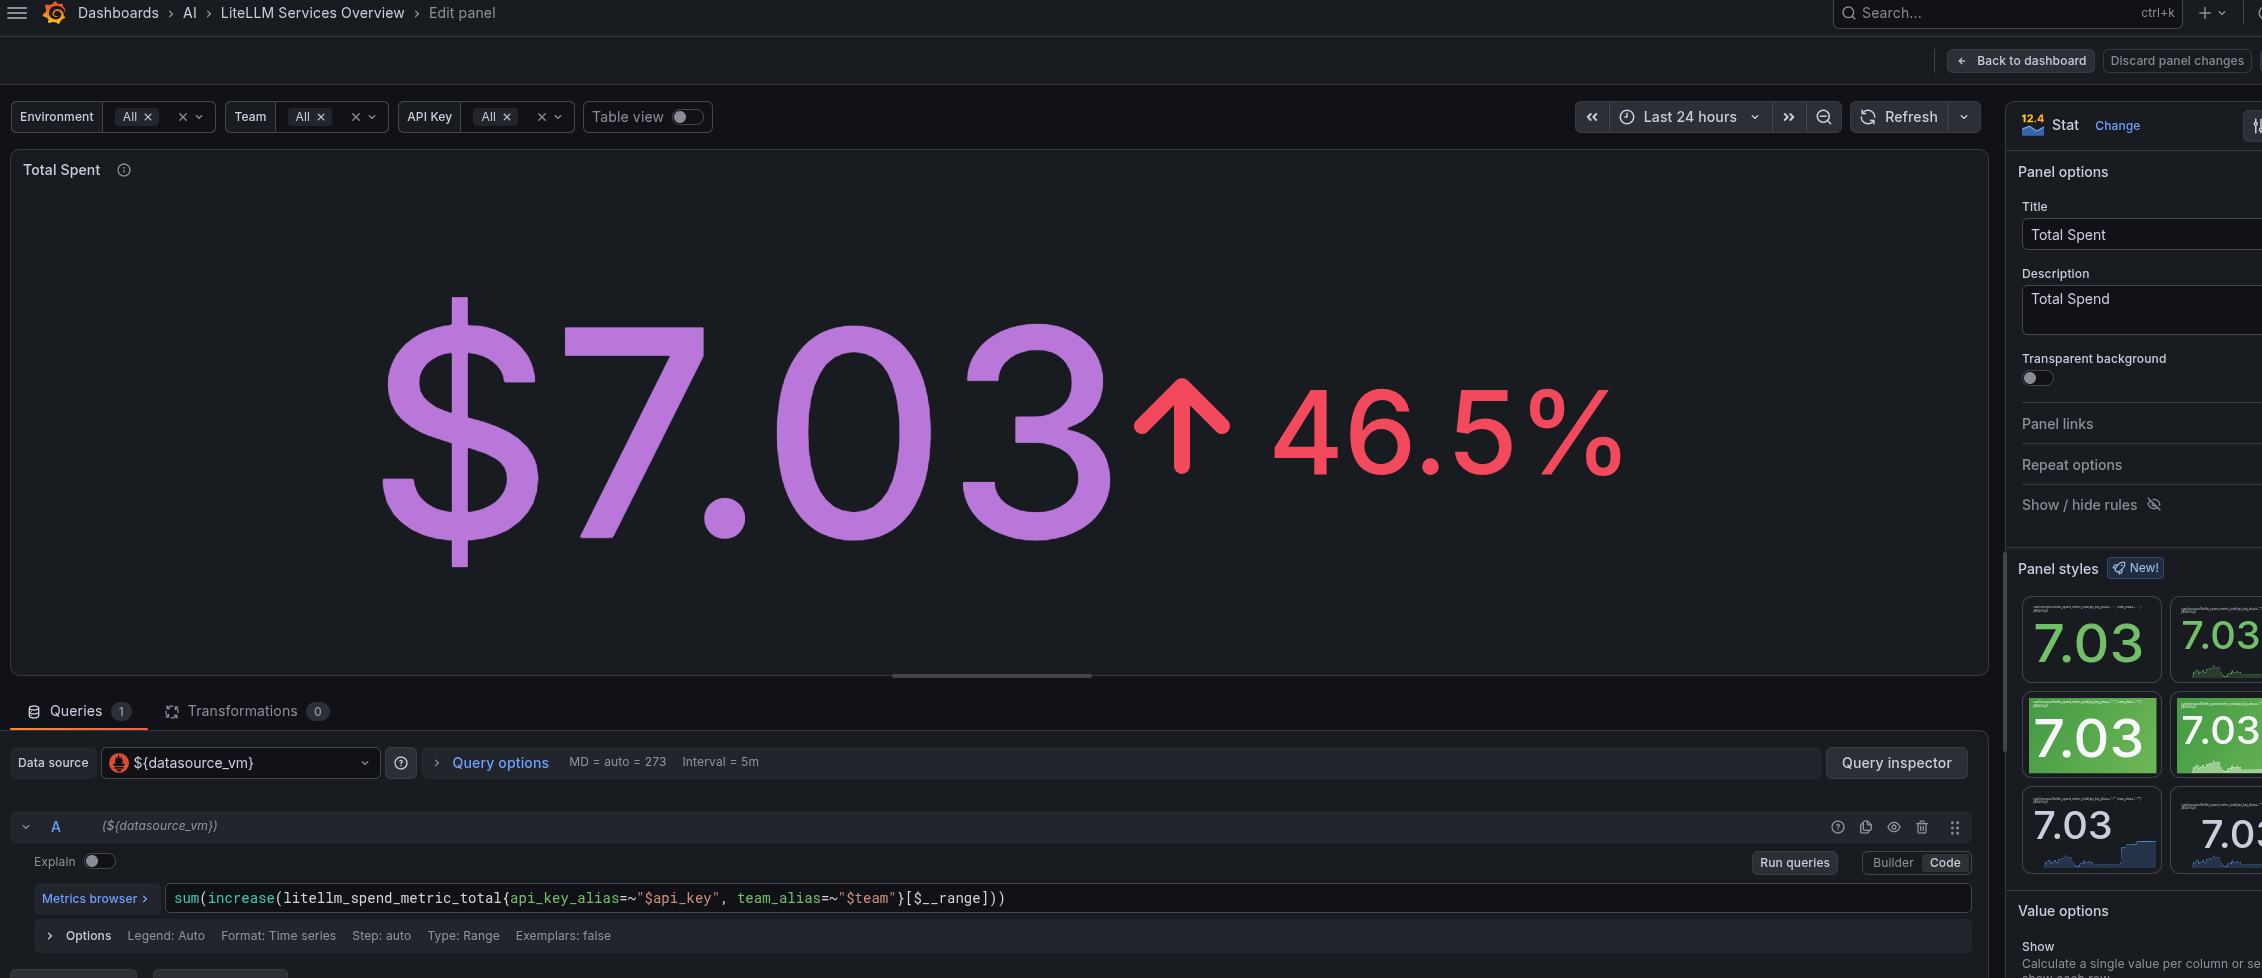
The “Total Spent” panel
A Stats panel with the spending information for the time range selected in Grafana:
sum(increase(litellm_spend_metric_total[$__range]))
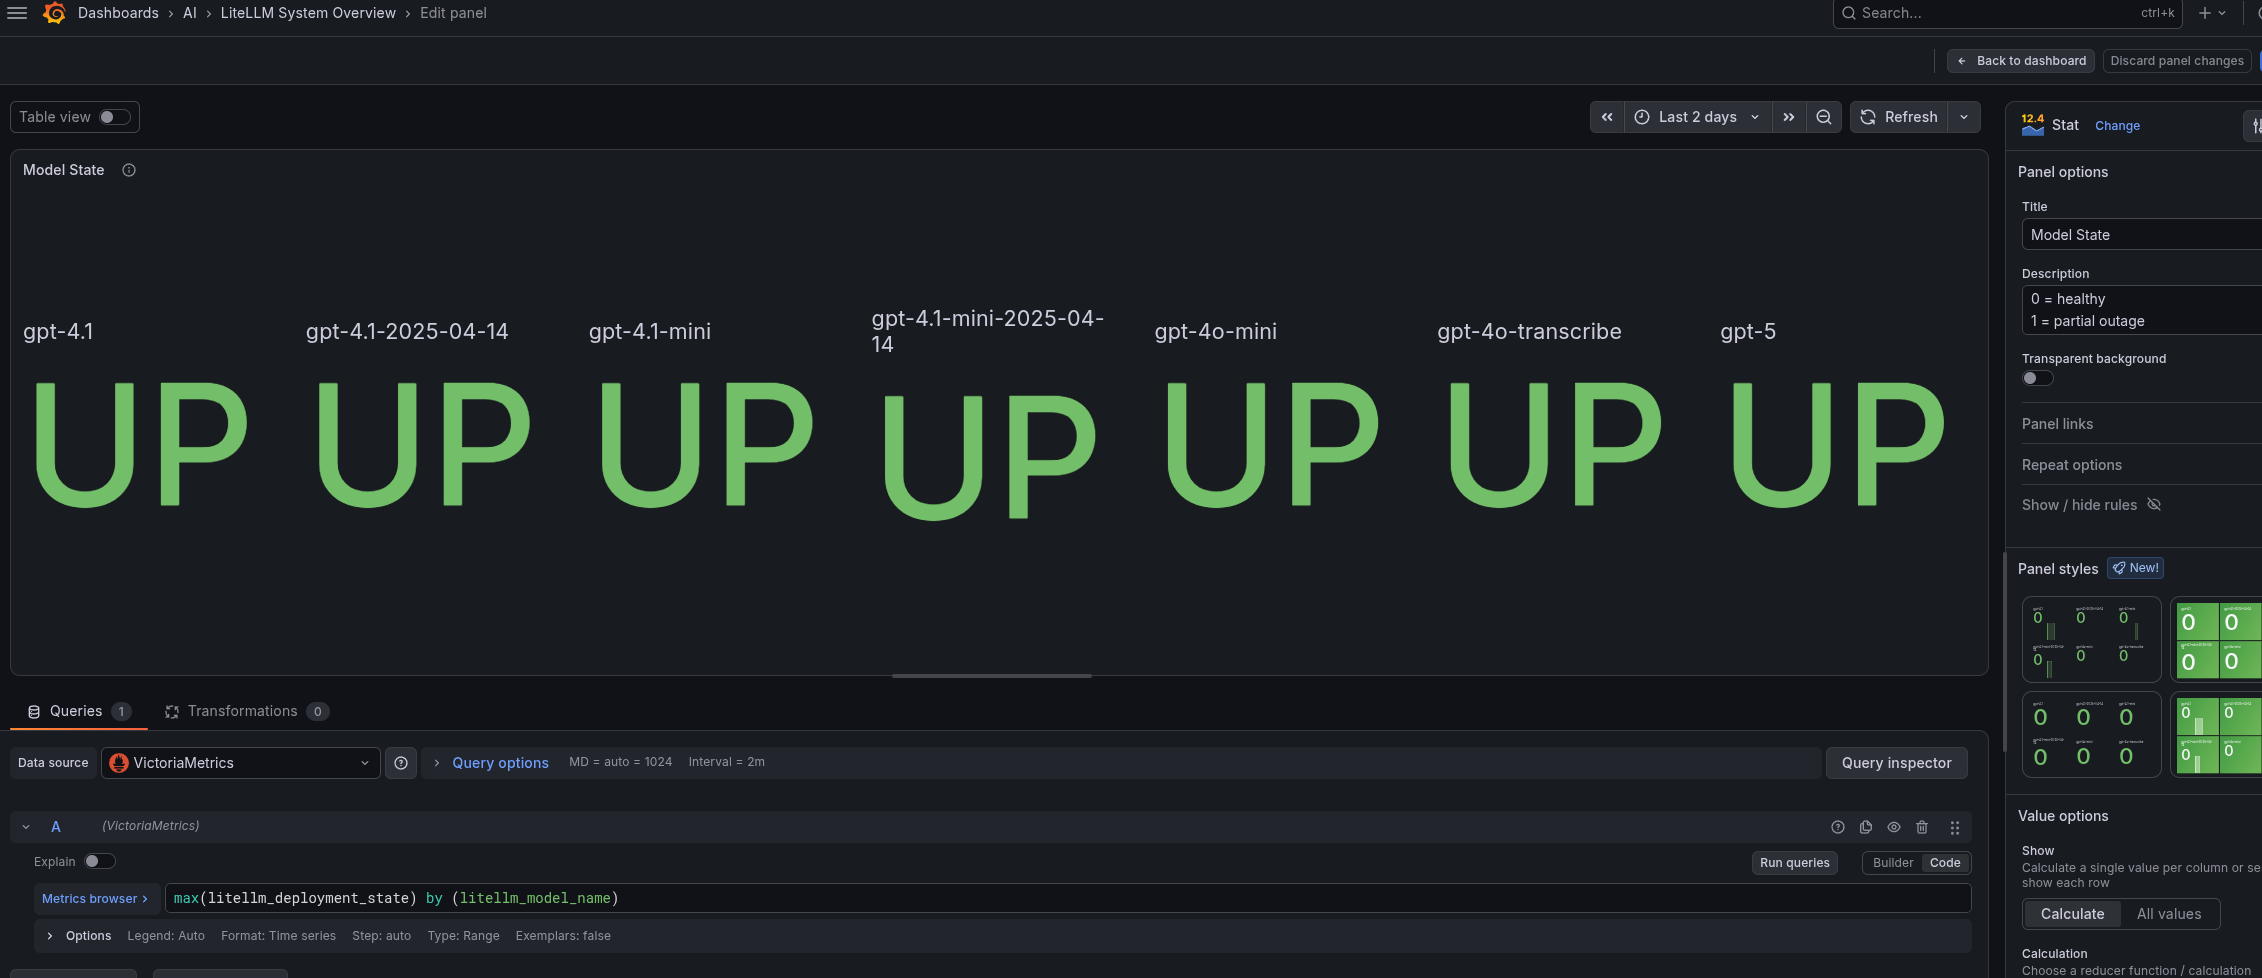
The “Model State” panel
Just the overall picture of errors from providers and models:
max(litellm_deployment_state) by (litellm_model_name)
Latency graphs
Here we have the general latency – and all the TTFT and TPOT/ITL
The general ones:
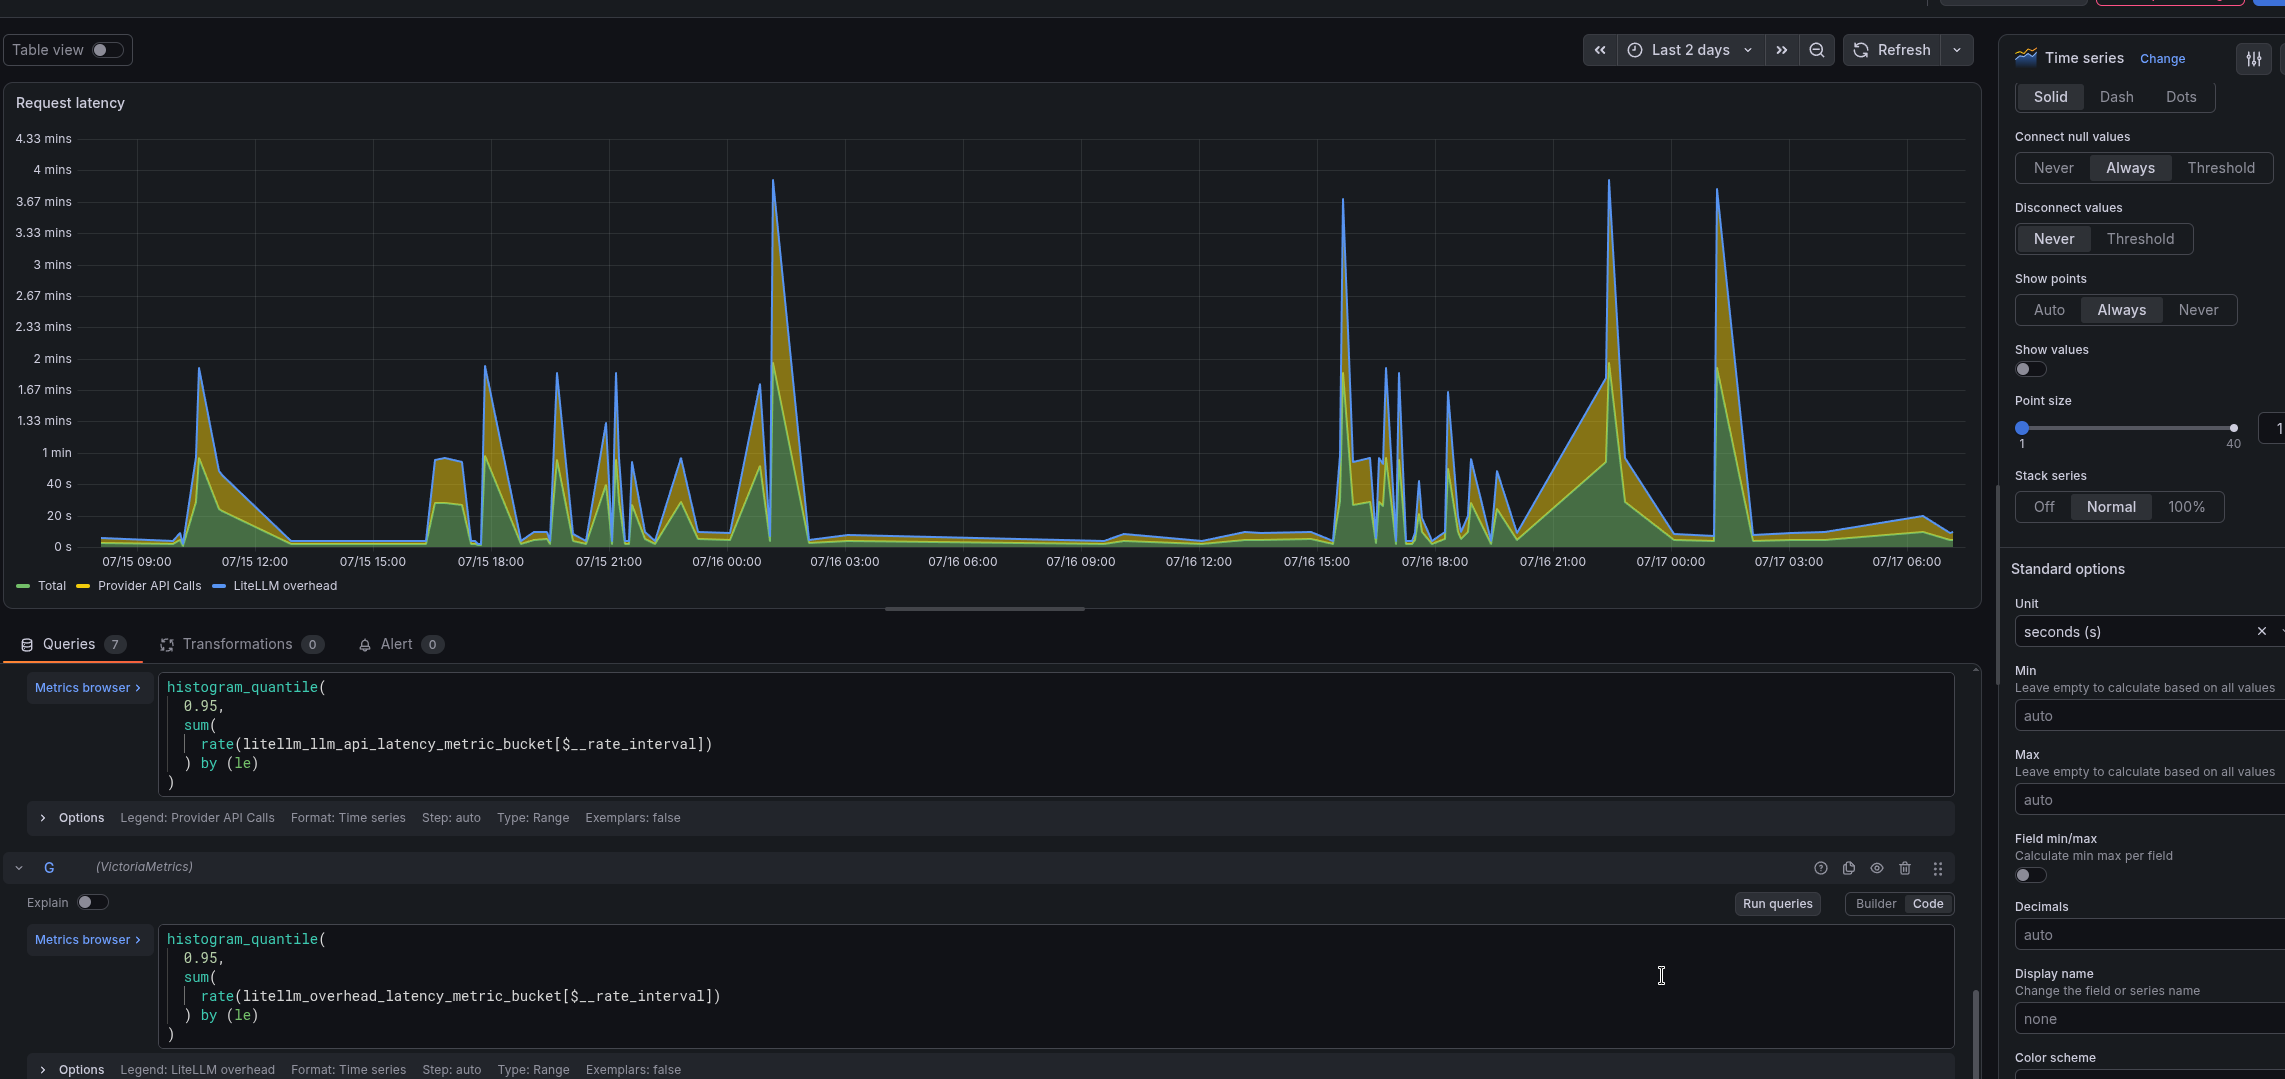
litellm_request_total_latency_metric_bucket: how long the client actually waited – the full request processing time from receiving it from the client + LiteLLM overhead + sending to the provider + waiting for the response + returning the response to the clientlitellm_llm_api_latency_metric_bucket: how long LiteLLM waited for the provider’s responselitellm_overhead_latency_metric_bucket: how much LiteLLM itself added on top oflitellm_llm_api_latency_metric_bucket
What we can see from them:
- Total and Provider growing, but Overhead stable: the problem is probably on the provider’s side (or the network)
- Total and Overhead growing, but Provider stable: the problem is on LiteLLM itself, need to check the Pods resources
Plus we have the Time To First Token (TTFT) and Time Per Output Token (TPOT) metrics:
litellm_llm_api_time_to_first_token_metric_bucket(TTFT): the wait time until the first token is received from the provider (only for streaming requests)litellm_deployment_latency_per_output_token(TPOT): latency per output token for a specific model – how long on average it takes to generate each token in the response
But with TPOT (litellm_deployment_latency_per_output_token) there’s a question of how it’s calculated, because the metric is populated as “latency_per_token = _latency_seconds / output_tokens” (see prometheus.py).
And so:
- for non-streaming: the model generated a 1000-token response in 10,000 ms – we get ~10 ms per token generation.
- for streaming: TTFT is captured at the moment of the first token in the stream, and it doesn’t depend on how many tokens end up in the response (
output_tokens) – those tokens don’t even exist yet at the moment of TTFT, and since the formula divides exactly the TTFT by the number of response tokens – calculating TPOT this way makes no sense for streaming
So for now I’ve made two visualizations – the first one for the “general” latency:
histogram_quantile(
  0.95,
  sum(
    rate(litellm_request_total_latency_metric_bucket[$__rate_interval])
  ) by (le)
)
And similar queries for litellm_llm_api_latency_metric_bucket and litellm_overhead_latency_metric_bucket:
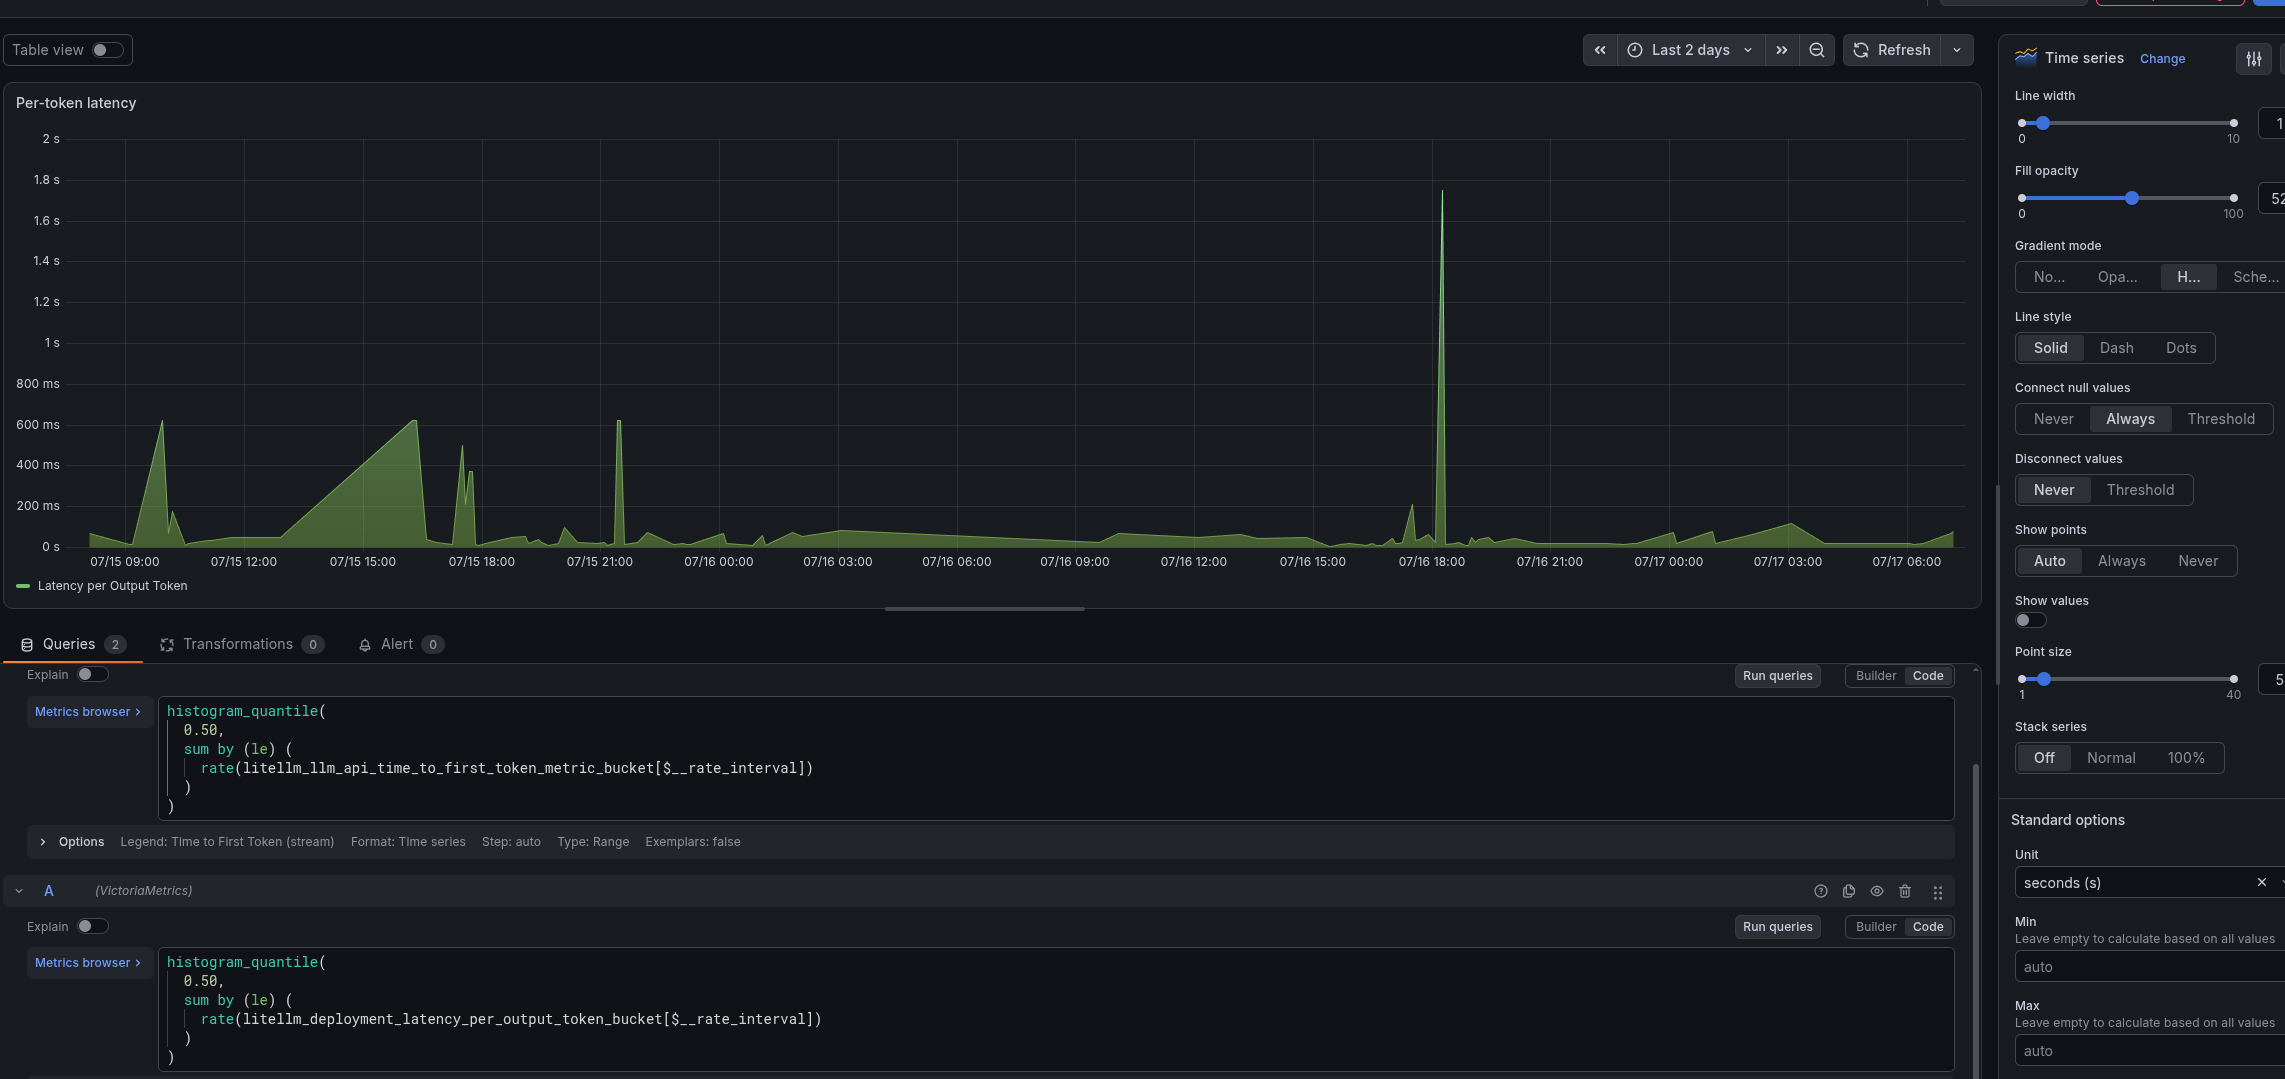
And the second panel – for TTFT/TPOT, but we don’t have streaming right now – so we only have the picture for TPOT:
histogram_quantile(
  0.50,
  sum by (le) (
    rate(litellm_llm_api_time_to_first_token_metric_bucket[$__rate_interval])
  )
)
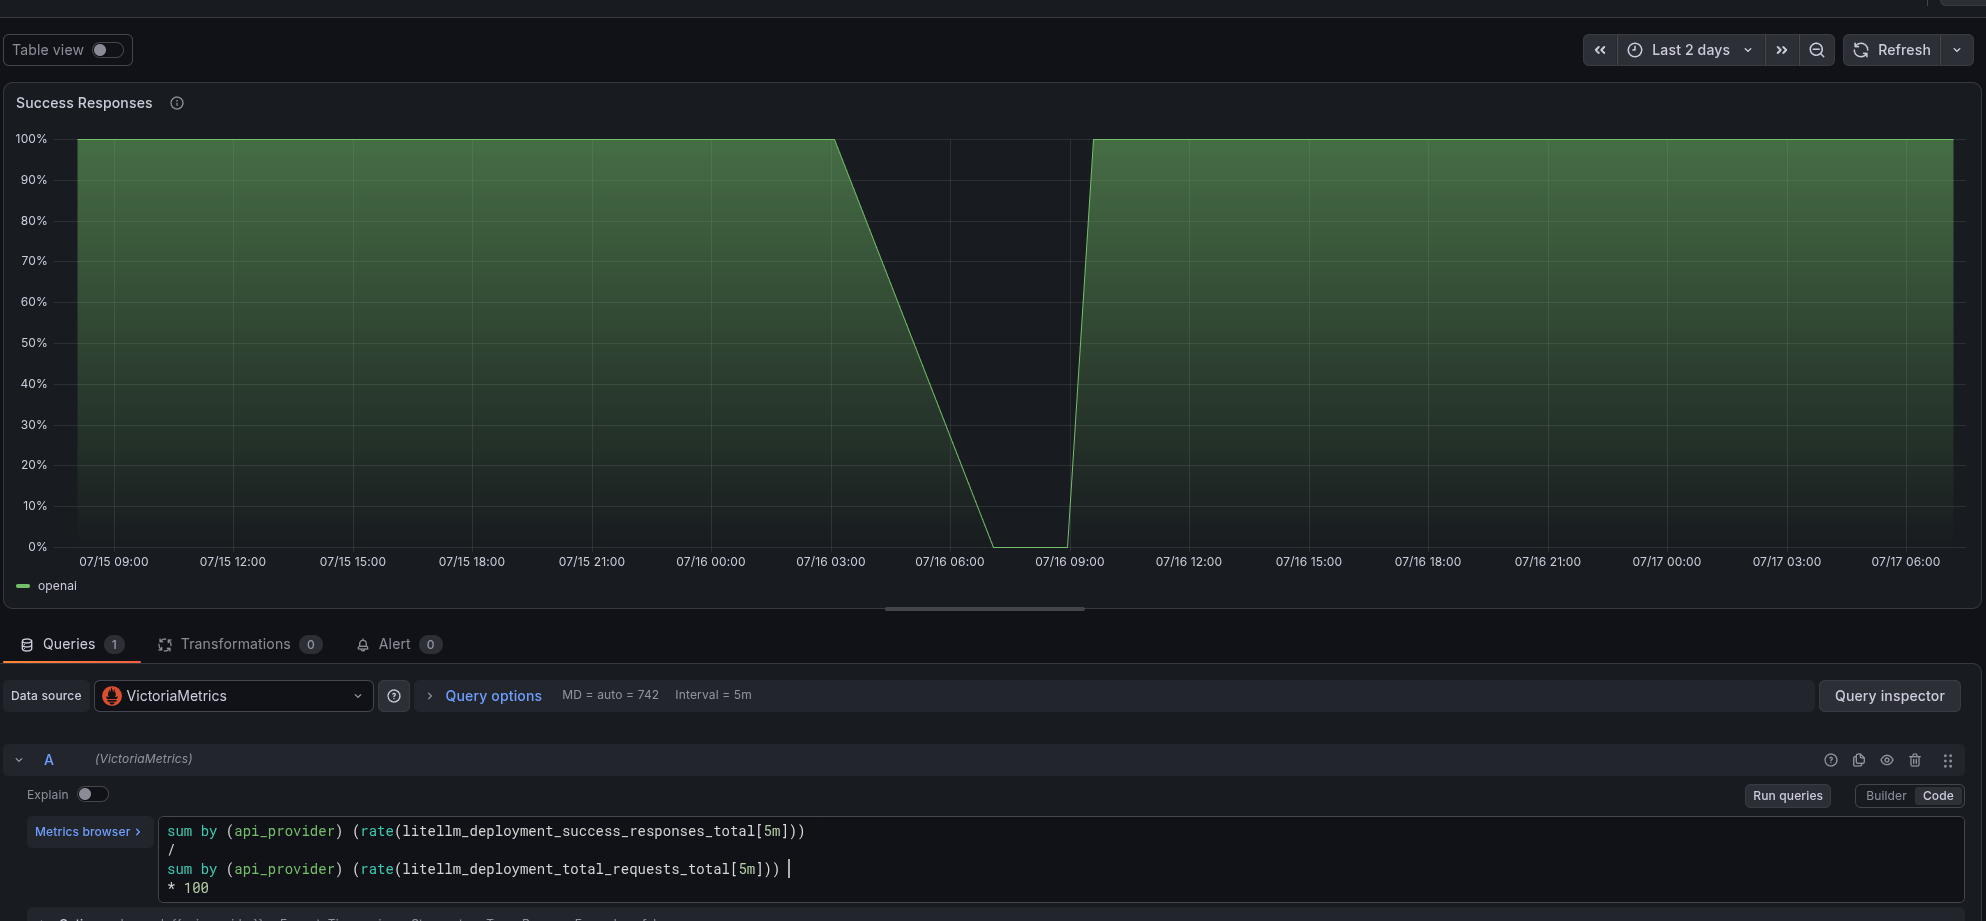
The “Success Responses” panel
Here we just calculate the % of successful responses out of the total number:
sum by (api_provider) (rate(litellm_deployment_success_responses_total[5m]))
/
sum by (api_provider) (rate(litellm_deployment_total_requests_total[5m]))
* 100
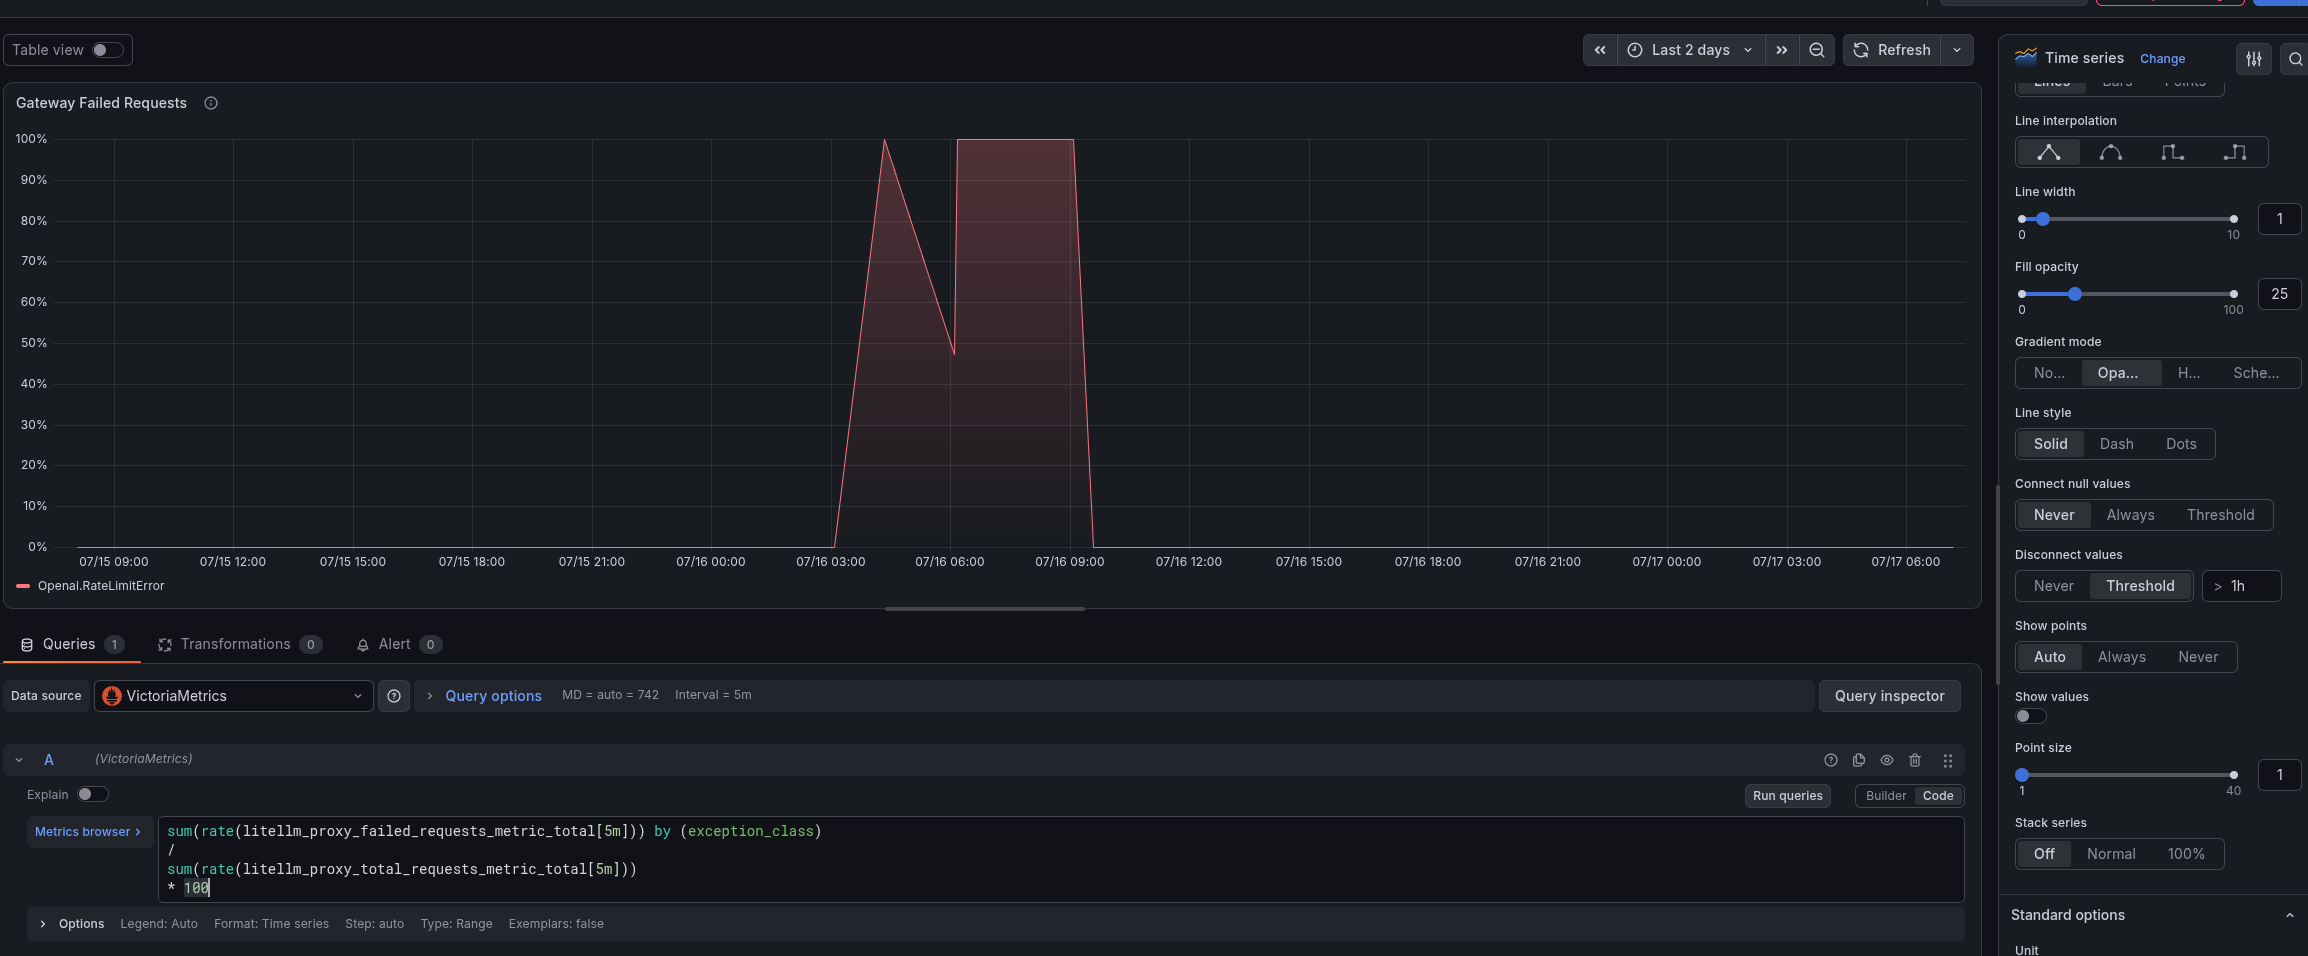
The “Gateway Failed Requests” panel
A graph of errors from LiteLLM to clients:
sum(rate(litellm_proxy_failed_requests_metric_total[5m])) by (exception_class)
/
sum(rate(litellm_proxy_total_requests_metric_total[5m]))
* 100
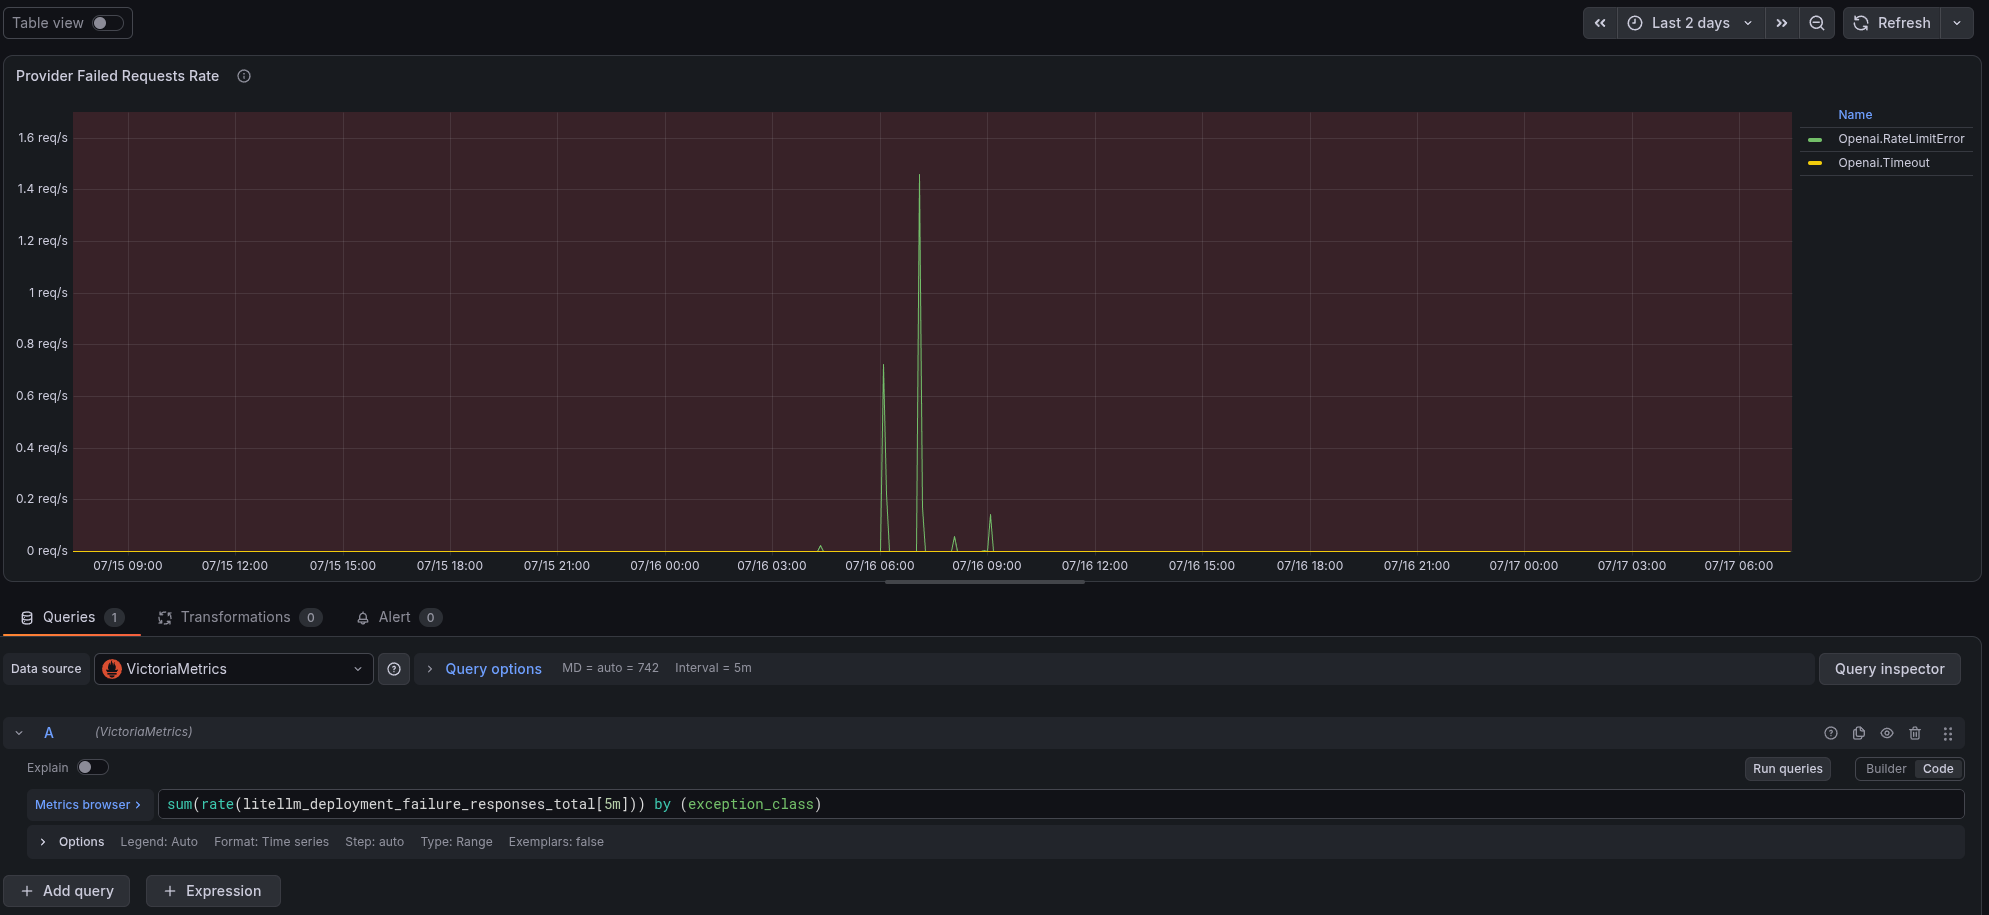
The “Provider Failed Requests Rate” panel
Errors from the provider separately (but remember that here Openai.RateLimitError also fires on the “out of money” case):
sum(rate(litellm_deployment_failure_responses_total[5m])) by (exception_class)
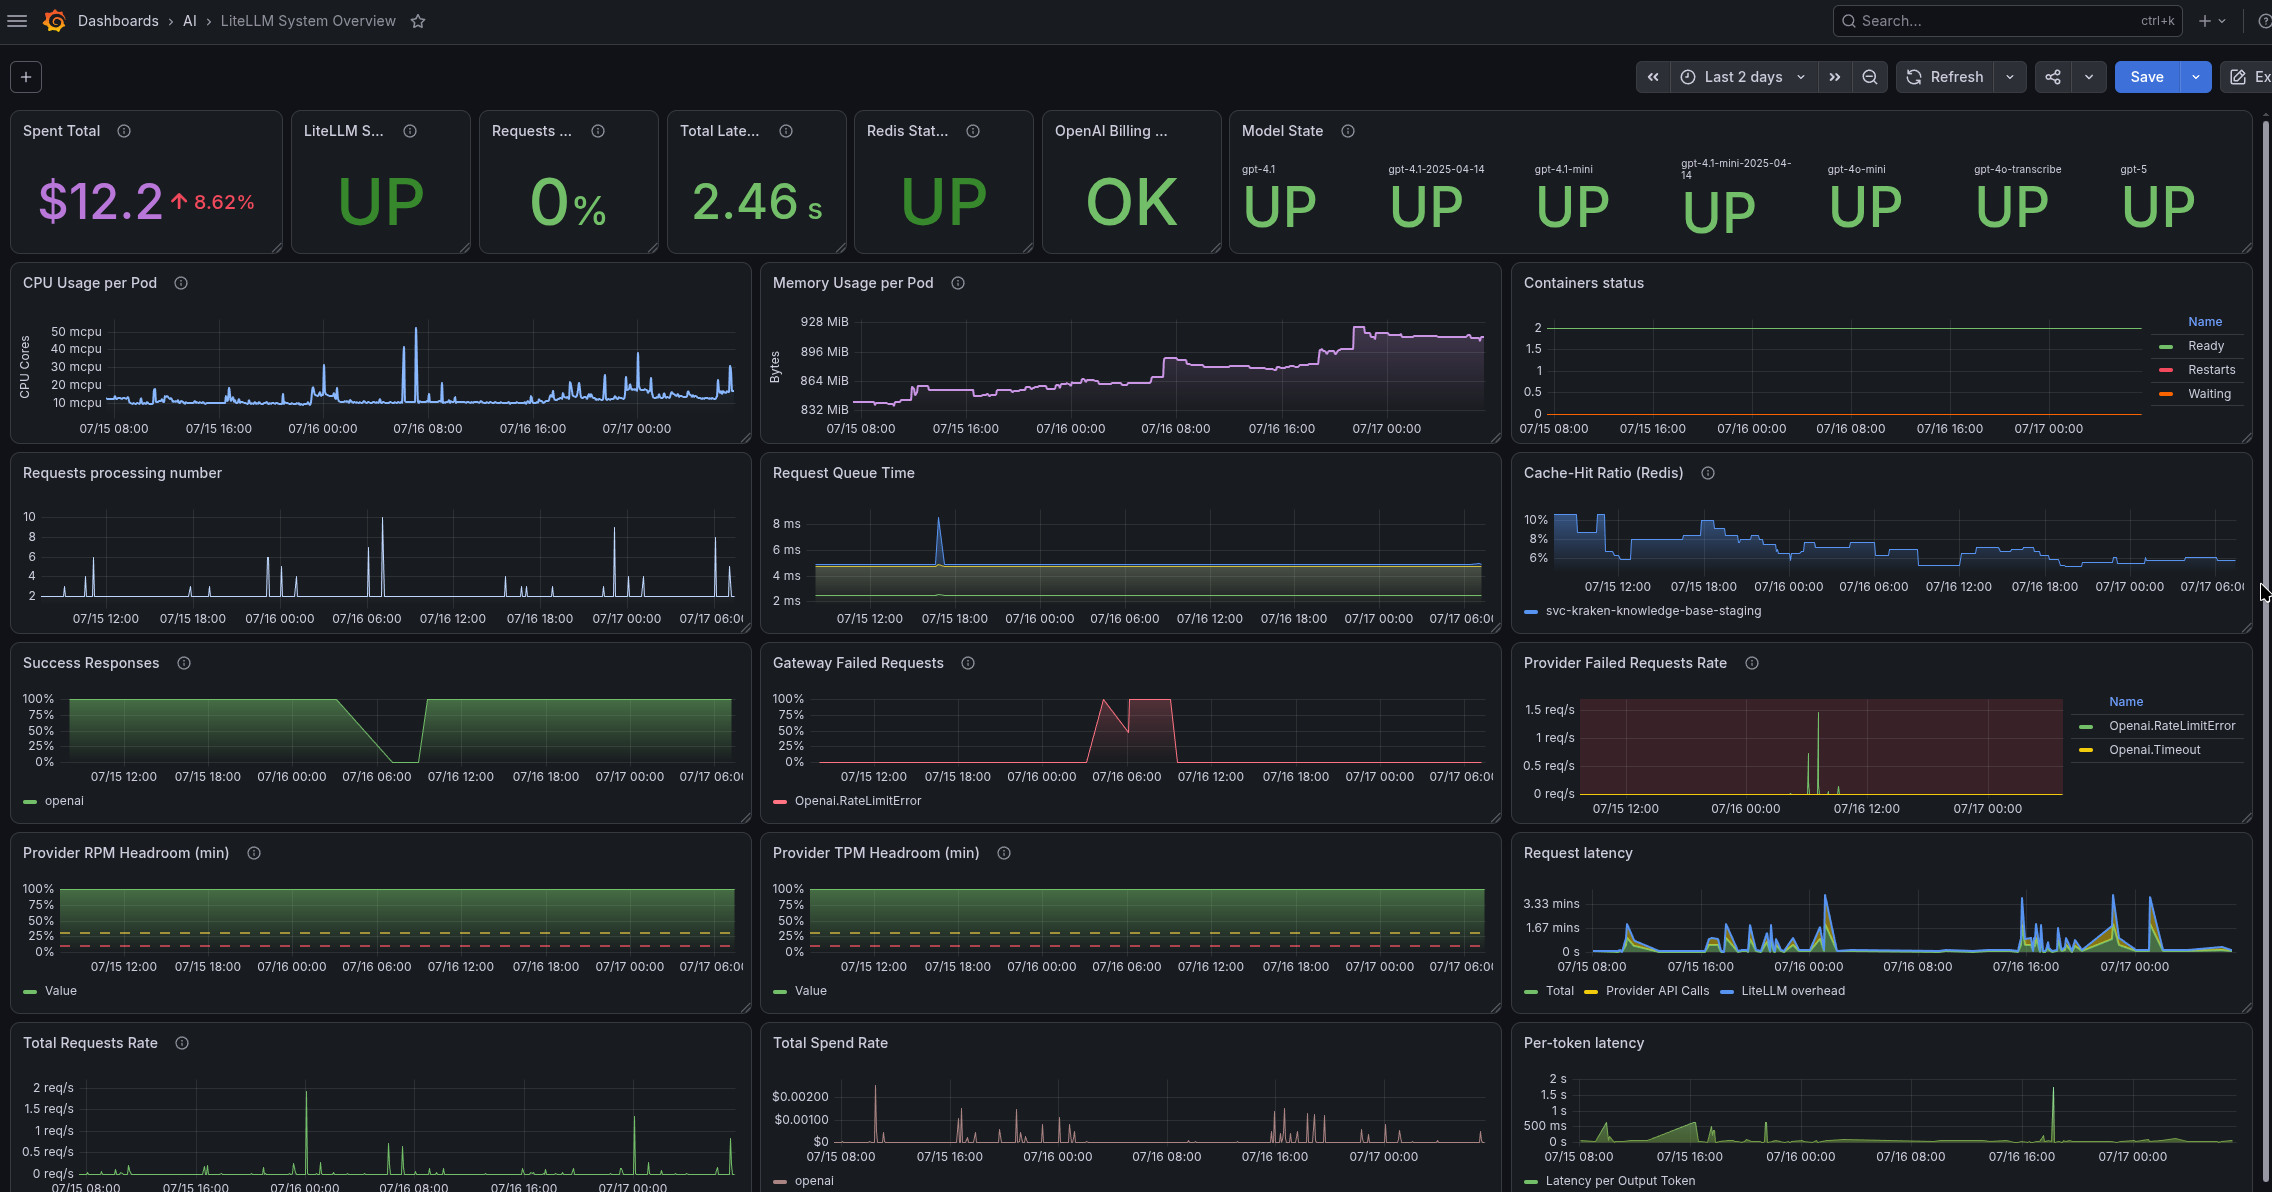
Resulted dashboard
As a result, the whole dashboard currently looks like this:
The “LiteLLM Services Overview” dashboard
This board is similar to the System dashboard in many ways – but it’s more tailored for managers and developers who are interested in LLM usage and money.
Dashboard variables
Here I added filters to be able to look at data for specific Teams or API Keys:
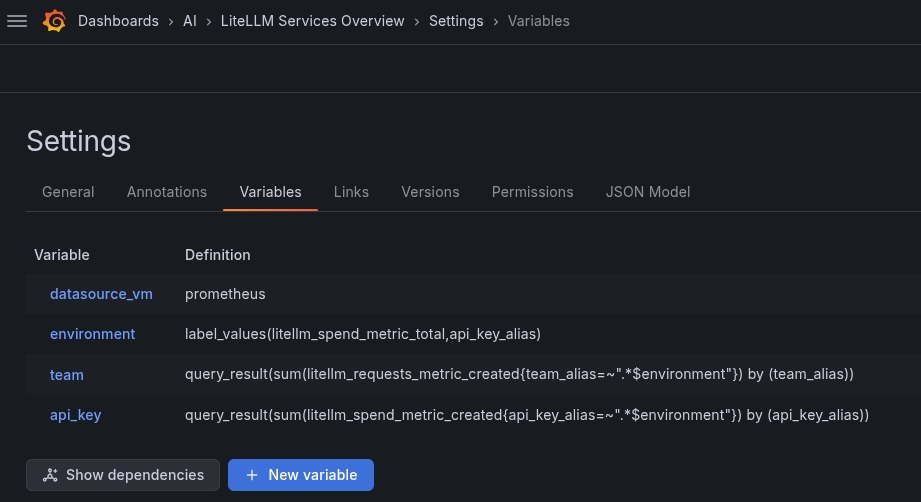
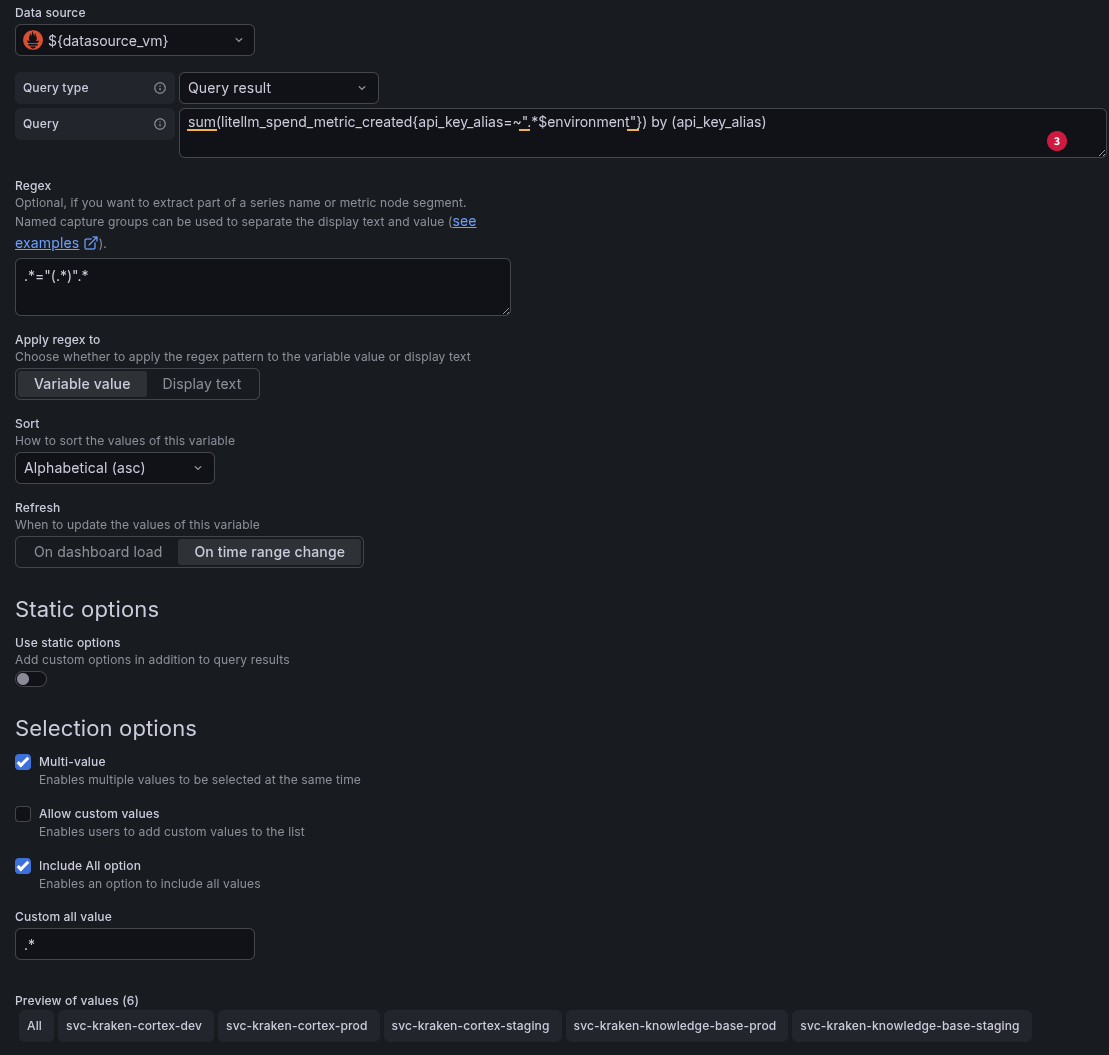
The query to get the list of API Keys:
sum(litellm_spend_metric_created{api_key_alias=~".*$environment"}) by (api_key_alias)
And with a regex we cut out the key name itself:
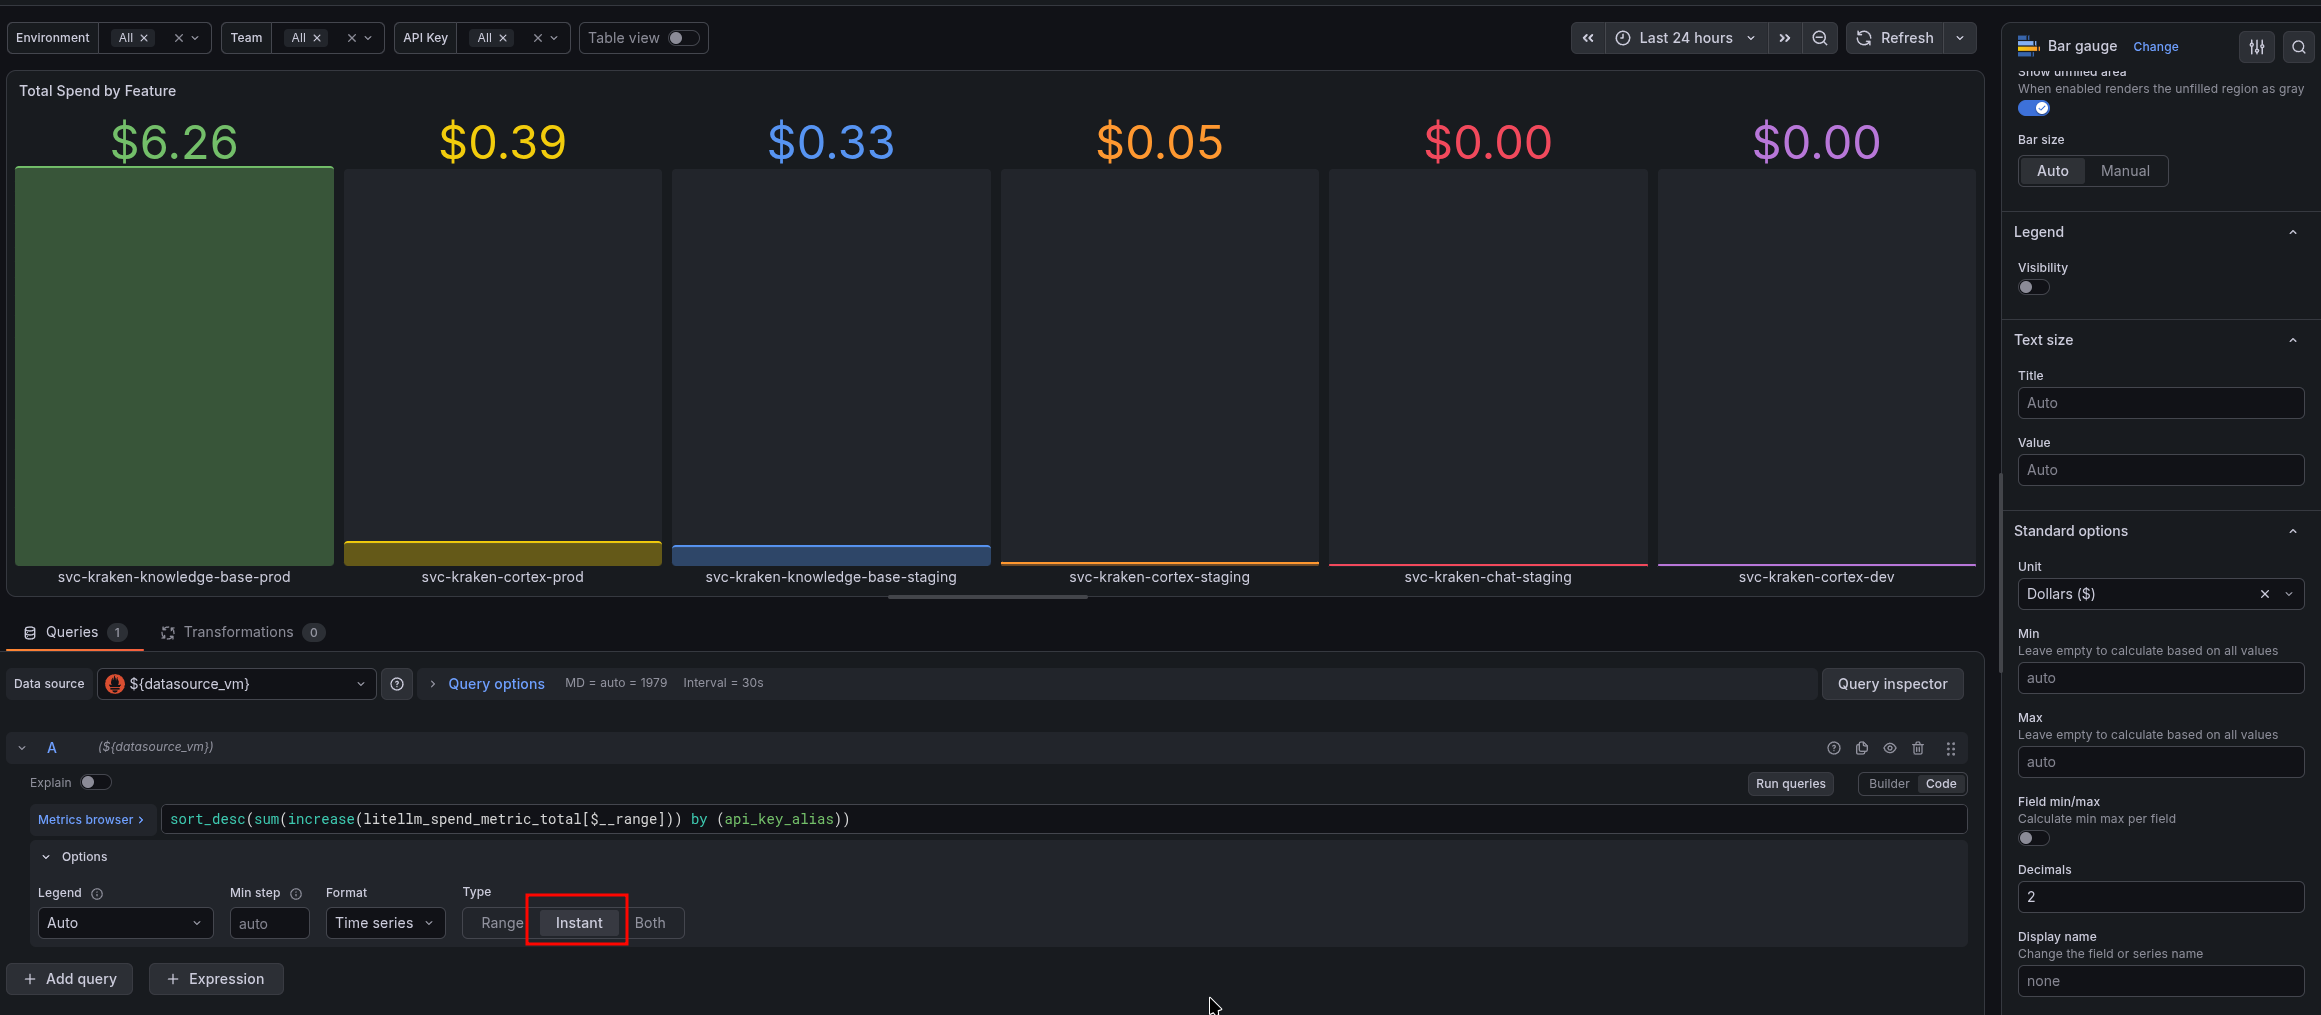
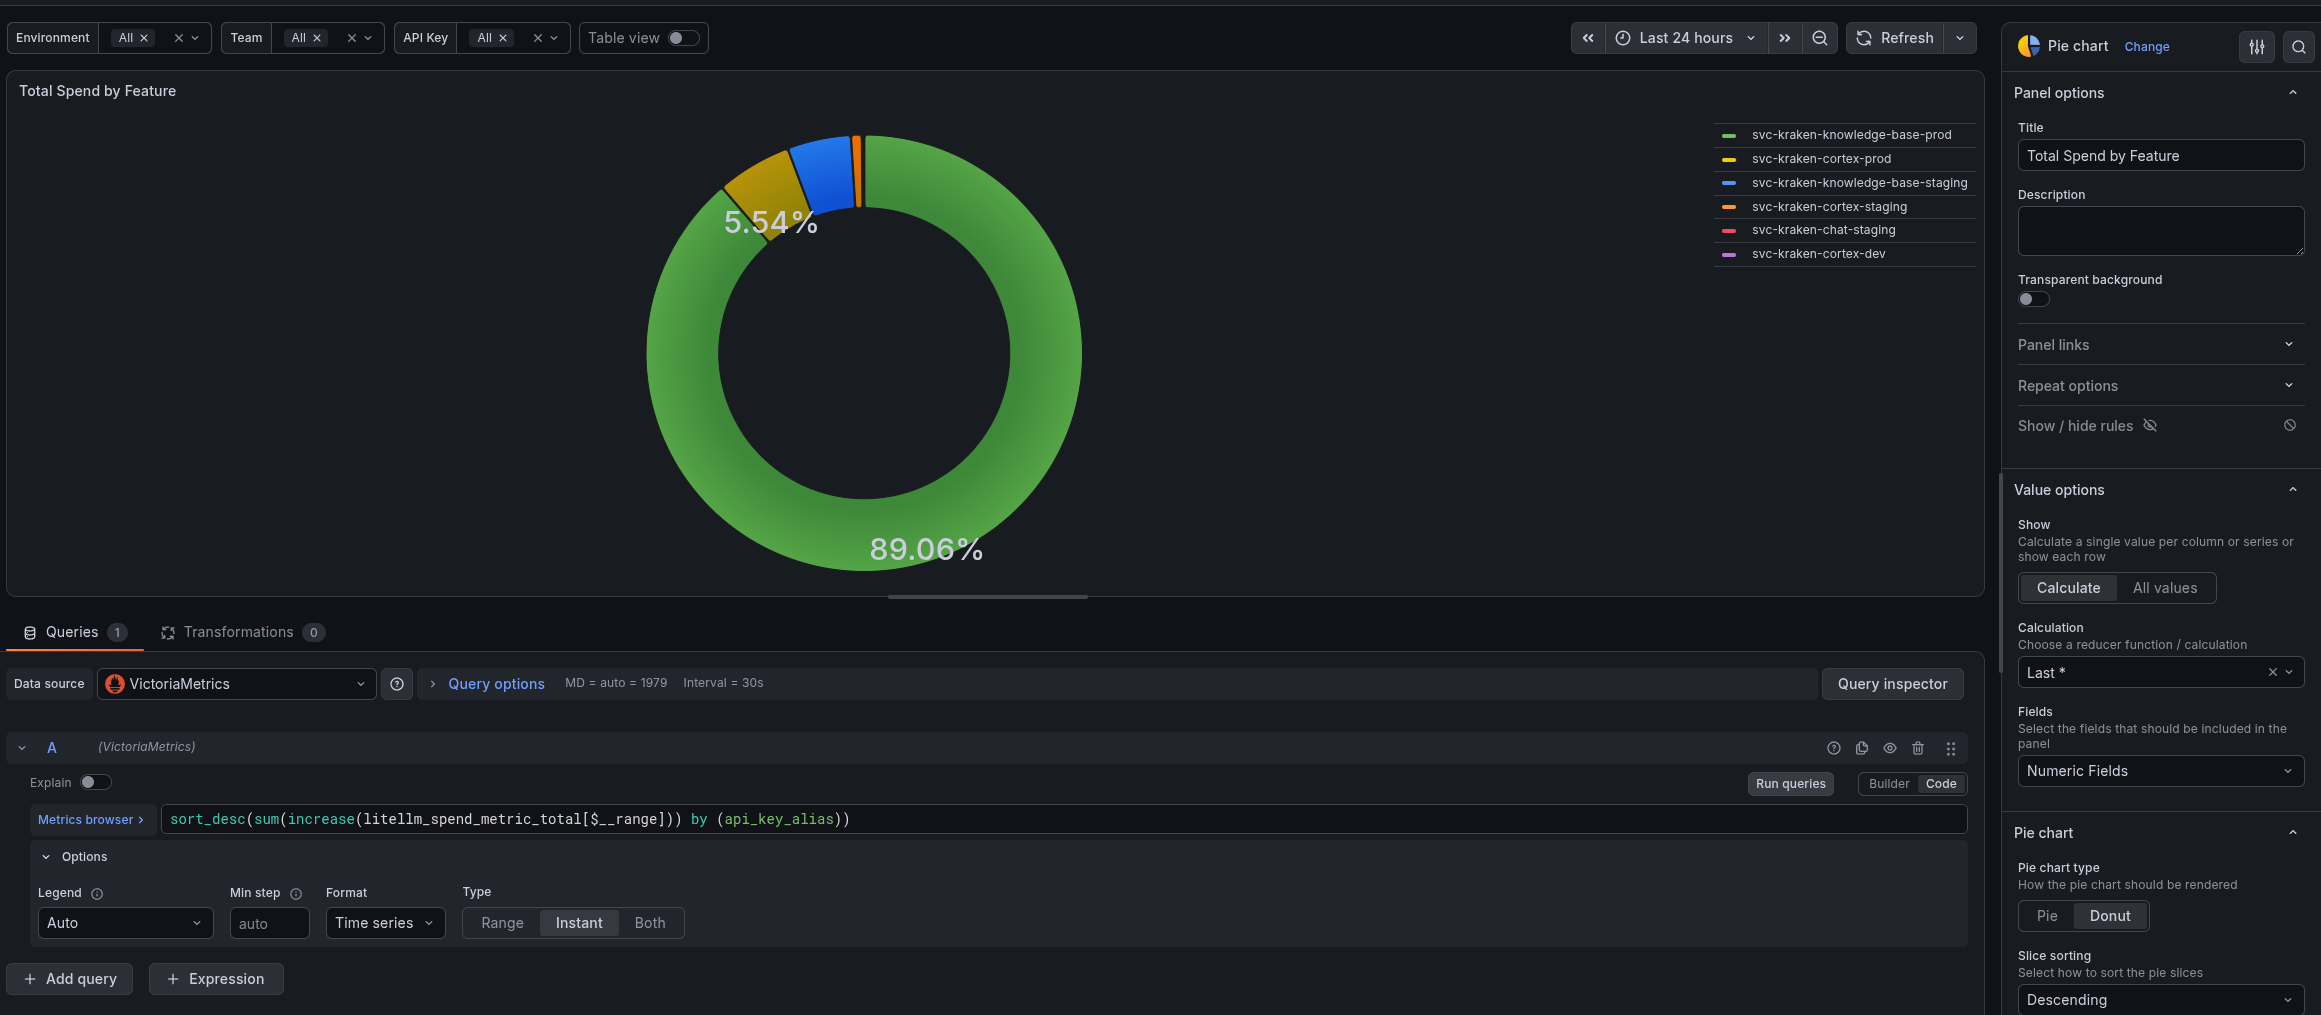
Total Spend by Feature
Here “Feature” is more for the managers, because in fact it’s “spent by API Key”:
sort_desc(sum(increase(litellm_spend_metric_total[$__range])) by (api_key_alias))
Here, with MetricsQL and the sort_desc() function, we sort the result so that the key with the highest spending comes first.
The visualization type is Bar gauge:
And a similar query for a Pie chart visualization – but here it’s the % of spending by each key out of the total spending:
The “Spent Rate by User” panel
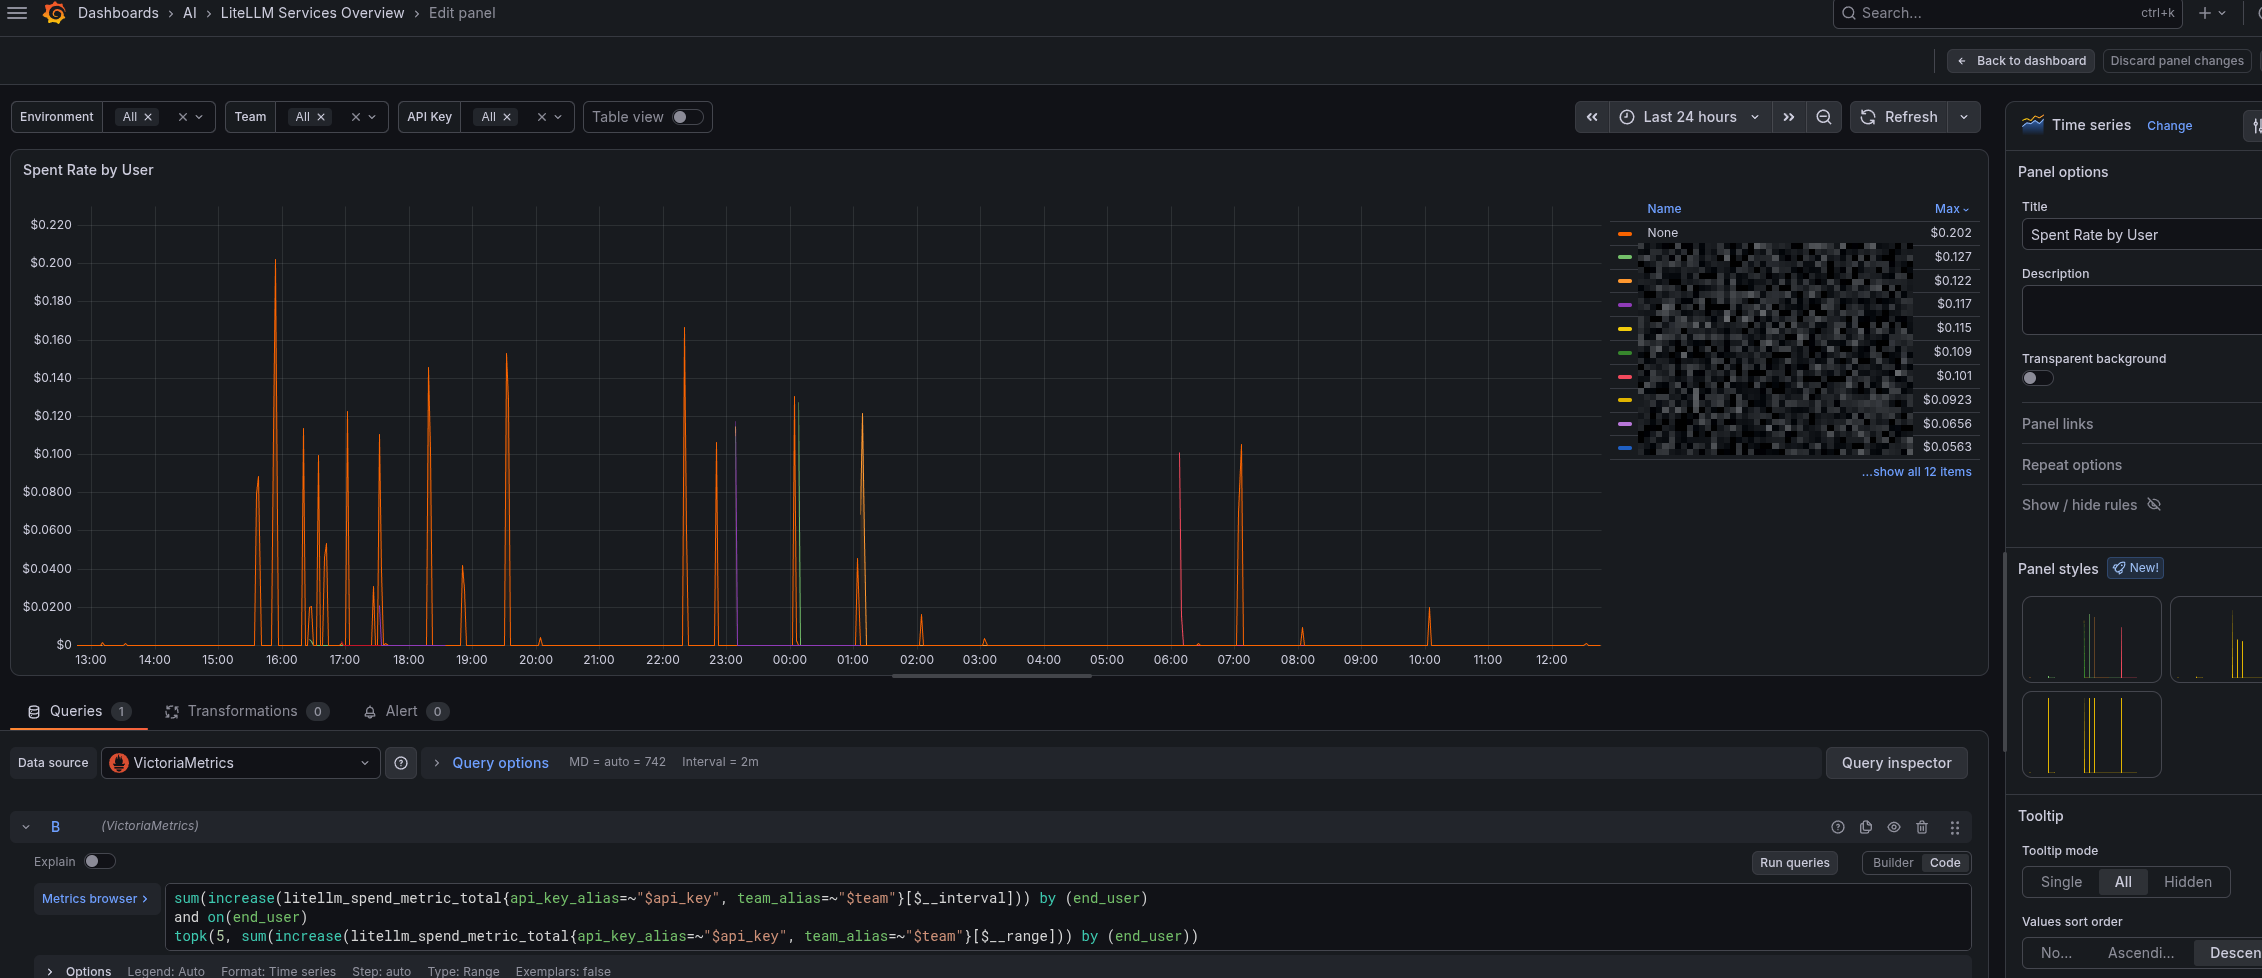
In our setup, end_user is added via metadata in the requests (see Customers / End-Users) – while the project is small, we can afford it.
And there’s a dedicated graph of usage by each user: we can see which user “costs us how much” per each feature/API Key:
sum(increase(litellm_spend_metric_total{api_key_alias=~"$api_key", team_alias=~"$team"}[$__interval])) by (end_user)
and on(end_user)
topk(5, sum(increase(litellm_spend_metric_total{api_key_alias=~"$api_key", team_alias=~"$team"}[$__range])) by (end_user))
The “Remaining Budget by Team and API Key” panel
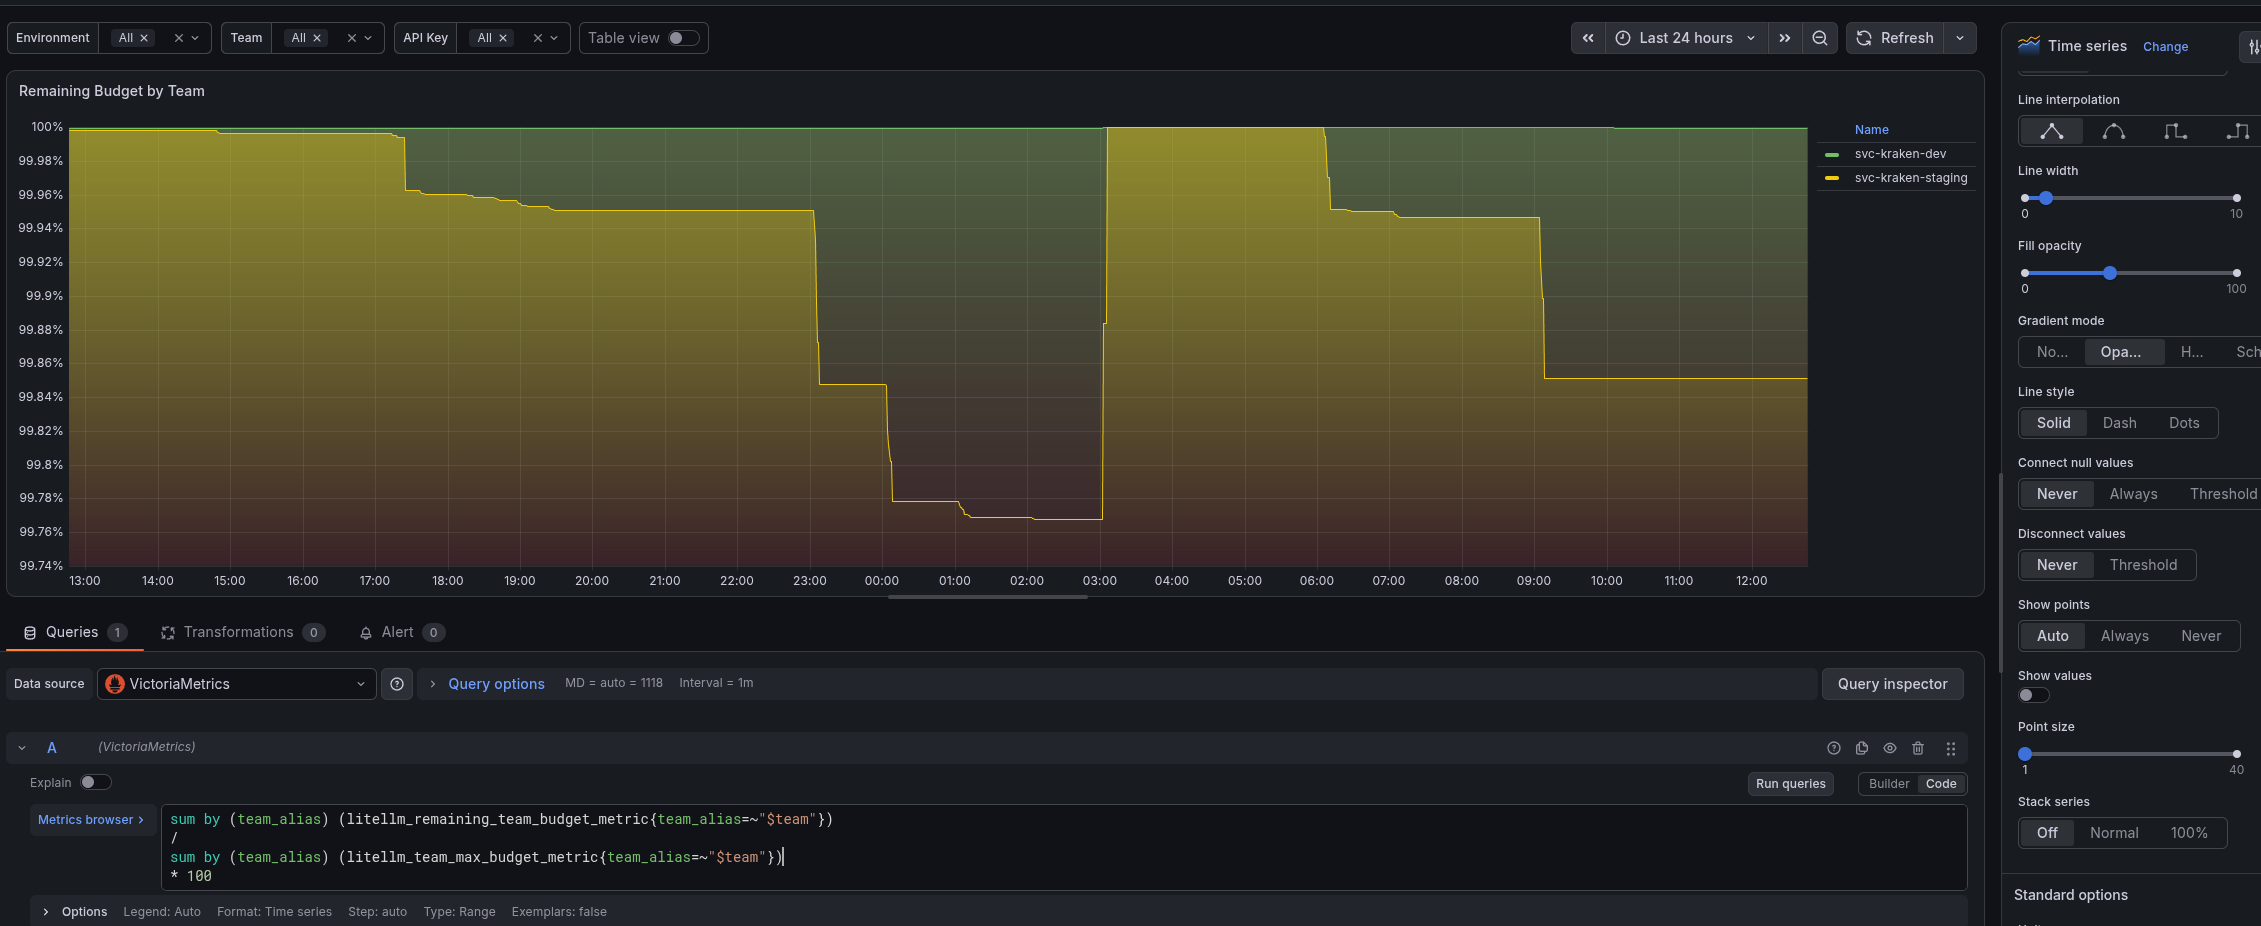
Calculating the % of budgets used by (team_alias):
sum by (team_alias) (litellm_remaining_team_budget_metric{team_alias=~"$team"})
/
sum by (team_alias) (litellm_team_max_budget_metric{team_alias=~"$team"})
* 100
And by (api_key_alias):
sum by (api_key_alias) (litellm_remaining_api_key_budget_metric)
/
sum by (api_key_alias) (litellm_api_key_max_budget_metric)
* 100
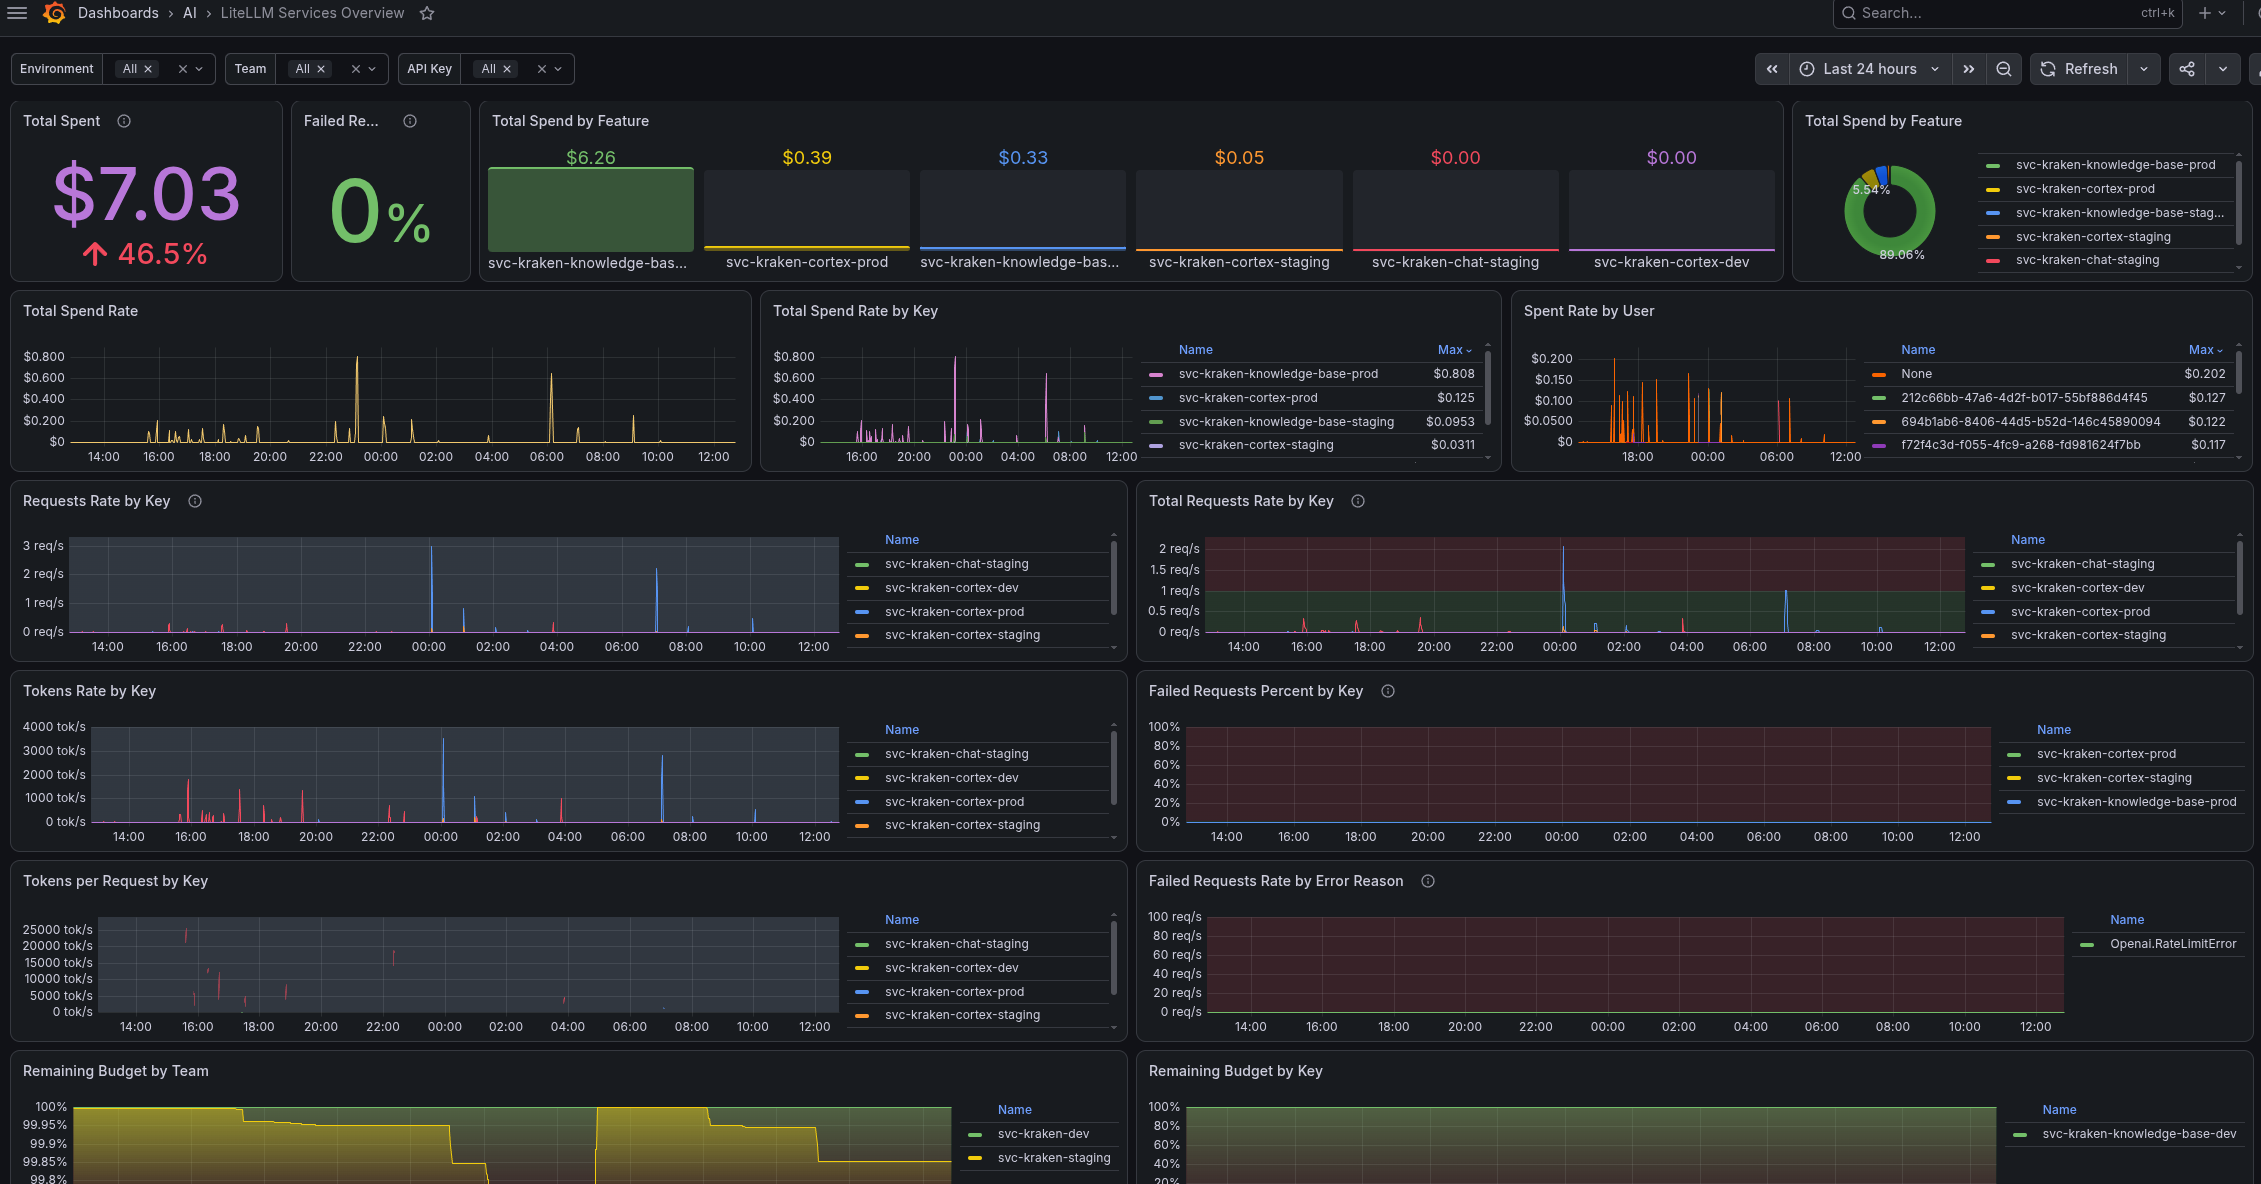
Resulted dashboard
And the whole board together looks like this:
That’s pretty much it for now.
We’re gradually switching services to LiteLLM, and there’s still a lot of interesting and useful stuff to do. The nearest plans are to test parallel requests to several providers at once (see Batch Completions – pass multiple models) – because we already want to have a self-hosted LLM, and we’ll need to compare OpenAI/Anthropic models with our own.
But that’s to be continued in the next posts.
