 Third part on running LiteLLM – AI Gateway or LLM Proxy, and finally we’re getting to monitoring.
In the first part we got familiar with LiteLLM in general (see LiteLLM: AI Gateway for LLMs – overview of features), and in the second one we deployed it in Kubernetes and hooked up VictoriaTraces and VictoriaMetrics to collect traces and metrics (see LiteLLM: AI Gateway in Kubernetes and metrics to VictoriaMetrics).
Now we have traces in VictoriaTraces and metrics in VictoriaMetrics – so we can build monitoring, and thankfully LiteLLM handles this really well.
What we’ll cover today:
- we’ll talk once more about LiteLLM’s integration with VictoriaStack – metrics and traces
- we’ll go through the main metrics LiteLLM exposes, and look at the key configuration options for what and how metrics are reported
- we’ll dig into traces and attributes a bit – there’s a lot going on, and at first it was hard to piece it all together
I decided to move the alert examples and Grafana dashboards into a separate post – this one is already pretty long as it is.
And there will probably be one more part – on SLI/SLA/SLO for LLMs using the metrics we get from LiteLLM.
About alerts: LiteLLM has native support for sending alerts to Slack – but in my case alerts go through the standard flow vmalert > Alertmanager > iLert > Slack.
All posts in this series:
- LiteLLM: AI Gateway for LLMs – Features Overview
- LiteLLM: AI Gateway on Kubernetes and Metrics in VictoriaMetrics
- (current) LiteLLM: Metrics, Traces, and VictoriaMetrics Stack Integration
And more are coming soon, so stay tuned for updates and follow my Telegram channel @rtfmcoua_en or LinkedIn group RTFM! DevOps[at]UA.
Contents
Integration with VictoriaStack
In the Monitoring and metrics to VictoriaMetrics section of the previous post I went over a few options for setting up metrics collection, but here’s a quick recap of how I’ve set it up now, since this post is entirely about monitoring.
Collecting metrics for VictoriaMetrics
Docs on metrics – Prometheus metrics.
I disabled authentication on /metrics entirely: we’re a small startup that’s not even in the market yet, so we’re not spending time on any serious security just now. Plus all endpoints are only accessible within the AWS VPC/Kubernetes, nothing is exposed to the “world” on bare ports – so services are reasonably covered by default.
In litellm_settings we enable callbacks with prometheus:
...

    litellm_settings:

      # Monitoring settings
      require_auth_for_metrics_endpoint: false
      callbacks:
      - prometheus

...
There are some other interesting metric options for LiteLLM itself – more on that a bit later.
Let’s open a local port to the LiteLLM service:
$ kk port-forward svc/litellm 4000
With curl we check that LiteLLM returns data (the metrics endpoint has a trailing slash, /metrics/):
$ curl -s http://localhost:4000/metrics/ | grep "^litellm_" | head -20
litellm_redis_latency_bucket{le="0.005",redis="redis"} 12778.0
litellm_redis_latency_bucket{le="0.01",redis="redis"} 13388.0
litellm_redis_latency_bucket{le="0.025",redis="redis"} 13676.0
litellm_redis_latency_bucket{le="0.05",redis="redis"} 13773.0
...
The LiteLLM Helm chart has an option to enable serviceMonitor – which makes the VictoriaMetrics Operator create a VMServiceScrape, and I’ll probably switch to that later – but for now I just went with VMPodScrape:
apiVersion: operator.victoriametrics.com/v1beta1
kind: VMPodScrape
metadata:
  name: litellm
  namespace: ops-litellm-ns
spec:
  selector:
    matchLabels:
      app.kubernetes.io/name: litellm
  podMetricsEndpoints:
    - port: http
      path: /metrics/
Let’s check that the metrics are showing up in VictoriaMetrics:
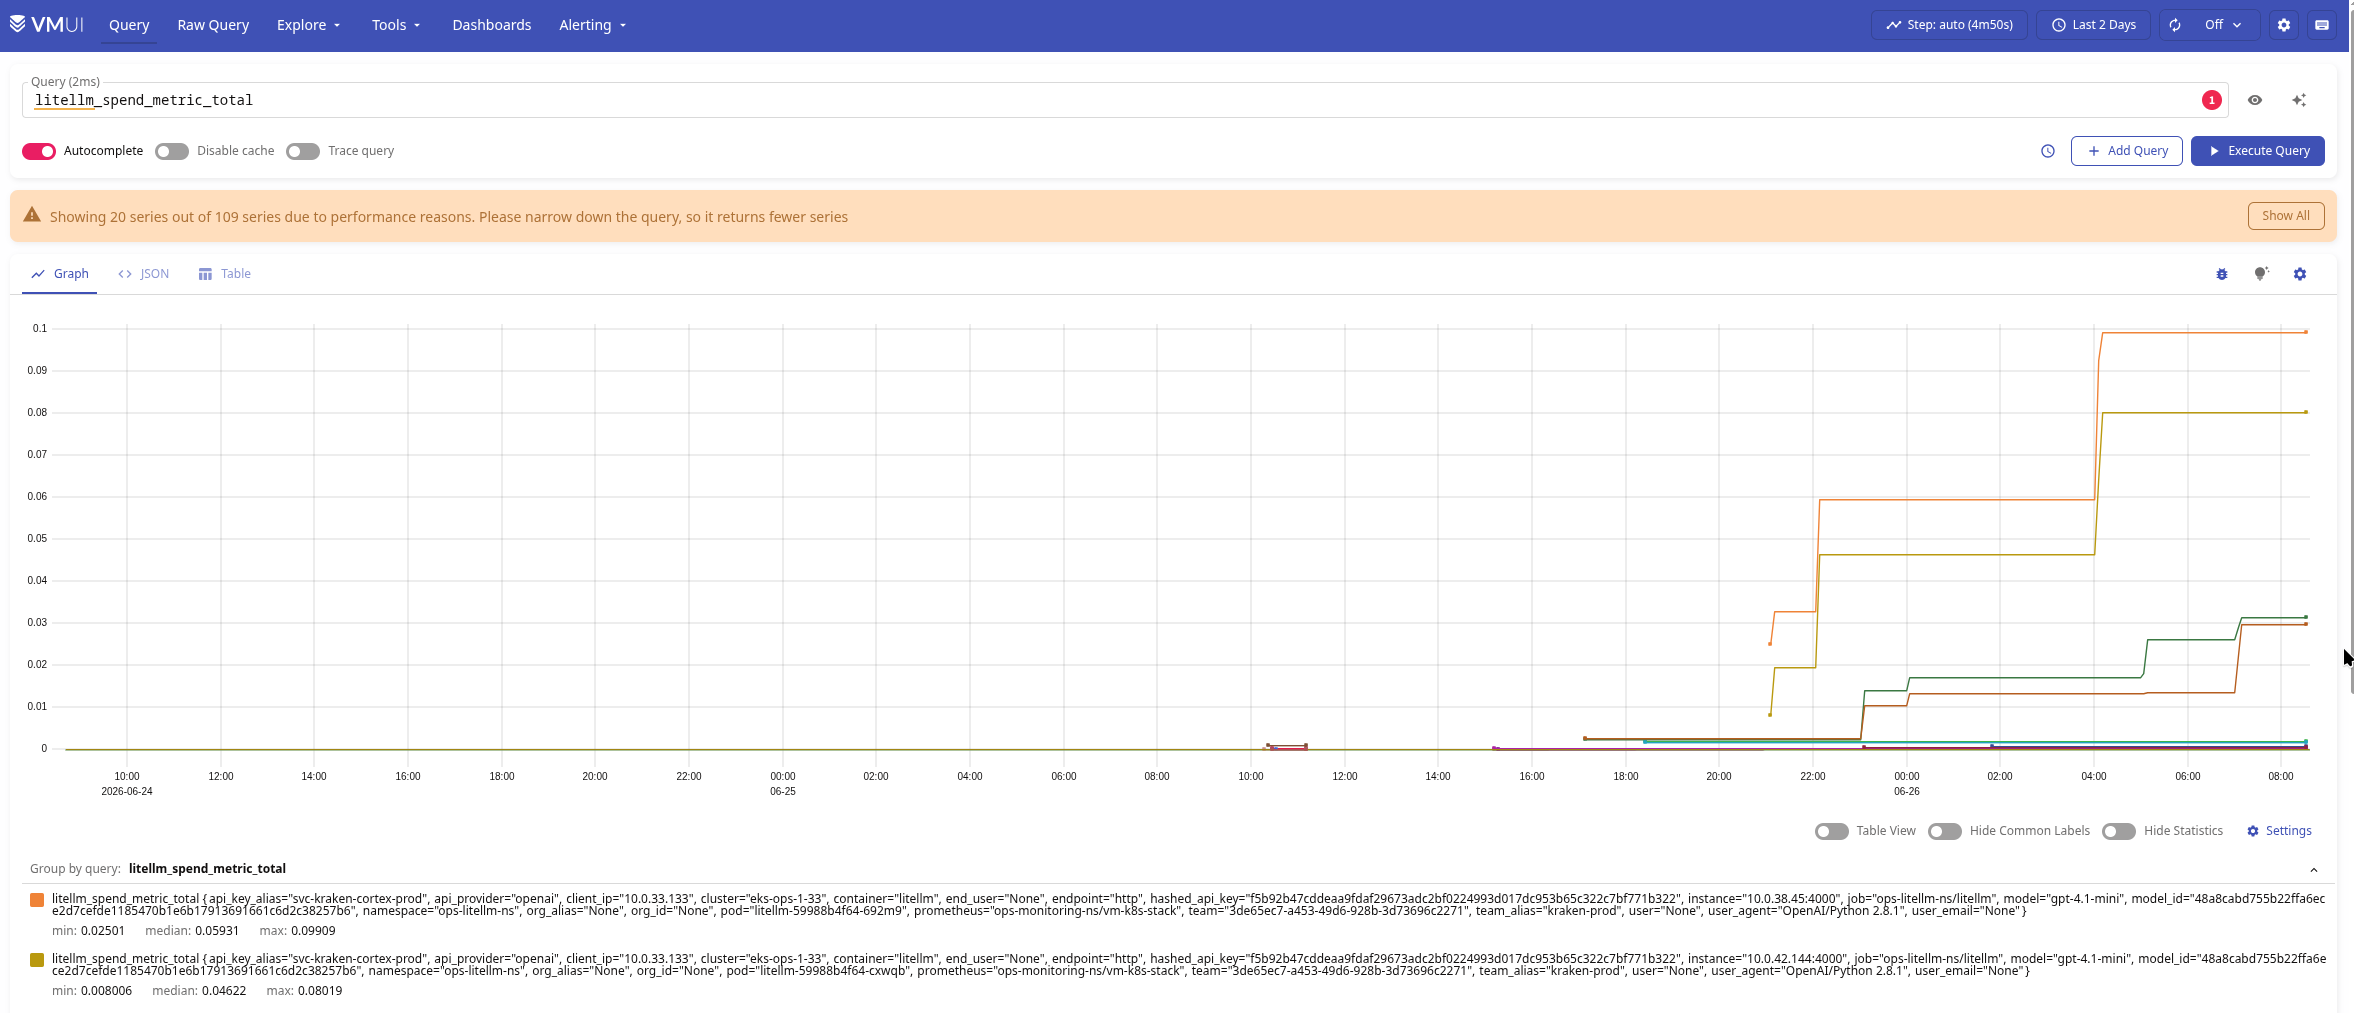
More on the available labels and metrics in general a bit further down.
Sending Traces to VictoriaTraces
Docs on traces – Logging.
The standard approach is to send traces to an OpenTelemetry Collector (see OpenTelemetry: OTel Collectors in Kubernetes and integration with the VictoriaMetrics stack), and then forward them to VictoriaTraces from there, but I don’t have an OTel stack yet, so I’m doing it directly – LiteLLM sends straight to VictoriaTraces, and we look at it in the VM UI and Grafana, see VictoriaTraces: Tracing, Observability and OpenTelemetry.
Let’s enable sending traces – add otel to callbacks:
...
    litellm_settings:
      # Monitoring settings
      require_auth_for_metrics_endpoint: false
      callbacks:
      - prometheus
      - otel
...
In the environment variables we add OTEL_EXPORTER_OTLP_TRACES_ENDPOINT and OTEL_EXPORTER_OTLP_PROTOCOL.
If you deployed with Helm – you can pass these through values and envVars:
...
  envVars:
    OTEL_EXPORTER_OTLP_TRACES_ENDPOINT: "http://atlas-victoriametrics-vt-single-server.ops-monitoring-ns.svc.cluster.local:10428/insert/opentelemetry/v1/traces"
    OTEL_EXPORTER_OTLP_PROTOCOL: "http/protobuf"
...
There are some interesting options here too, also covered later.
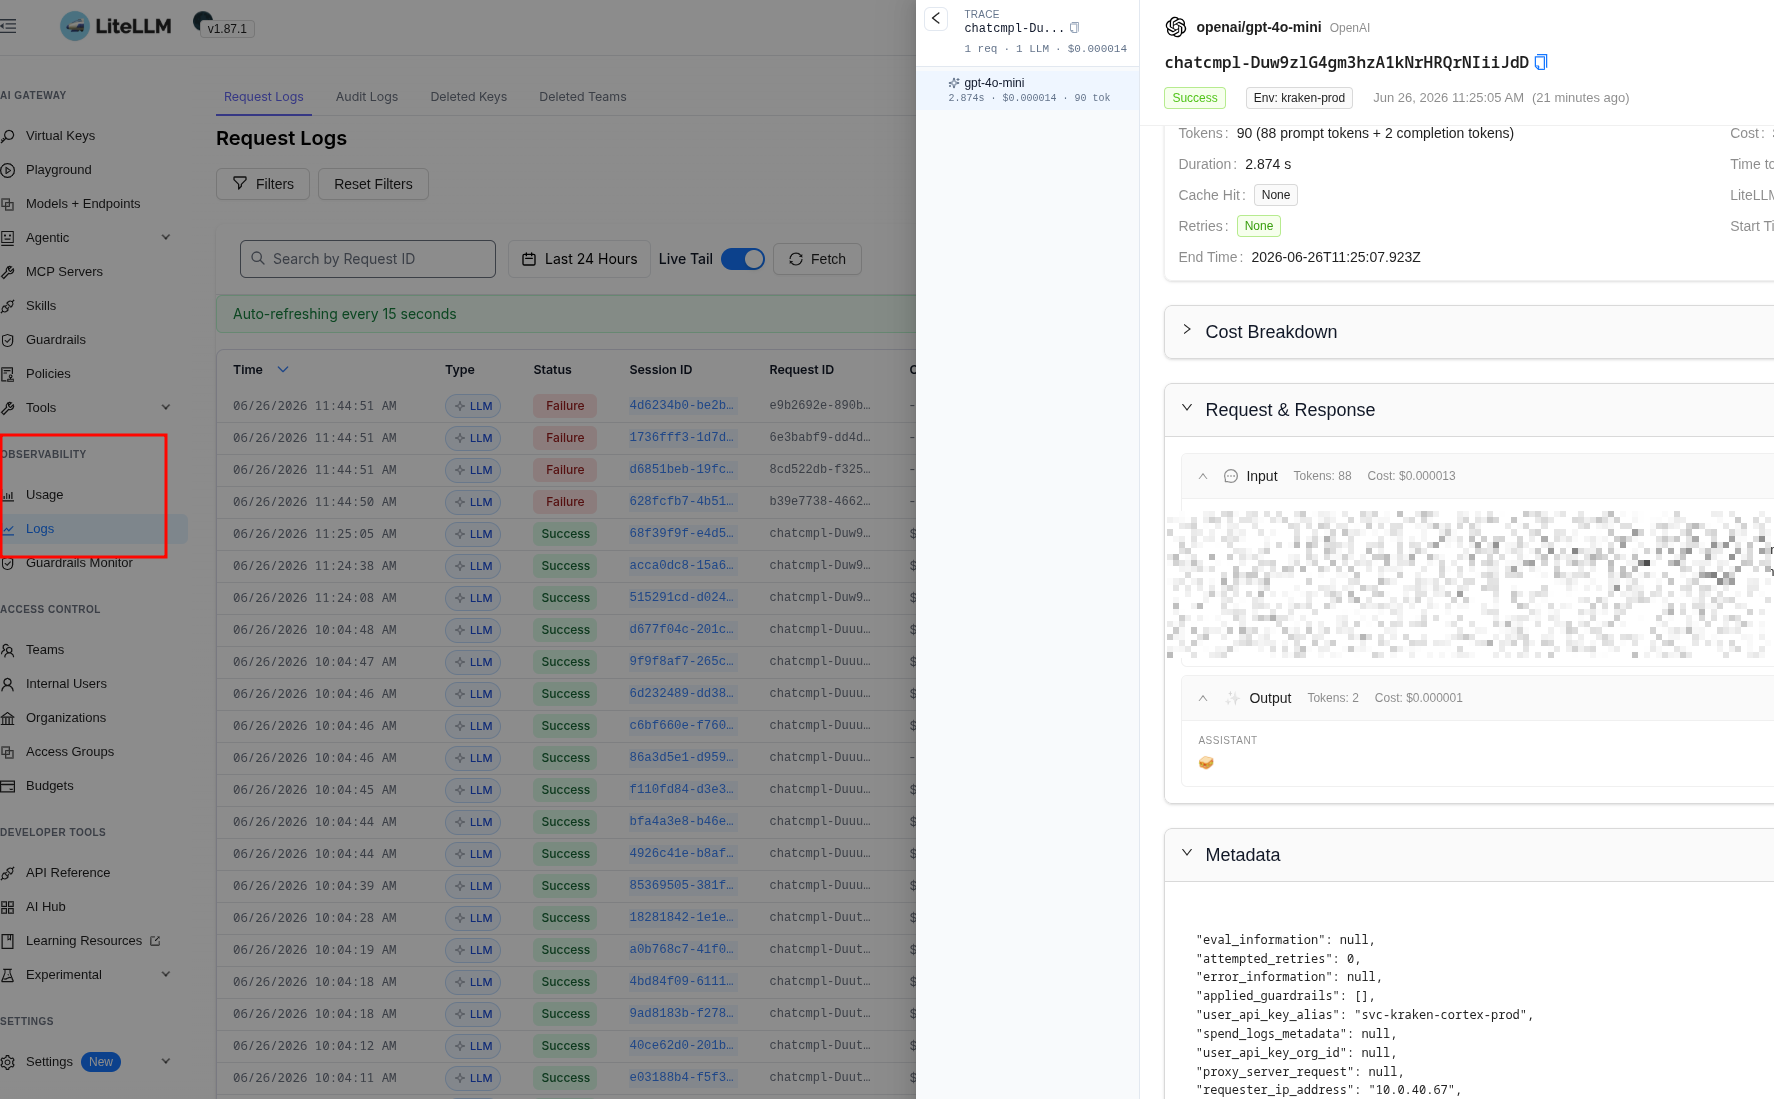
Let’s make a few requests through LiteLLM and check it out in LiteLLM itself – look at the Logs:
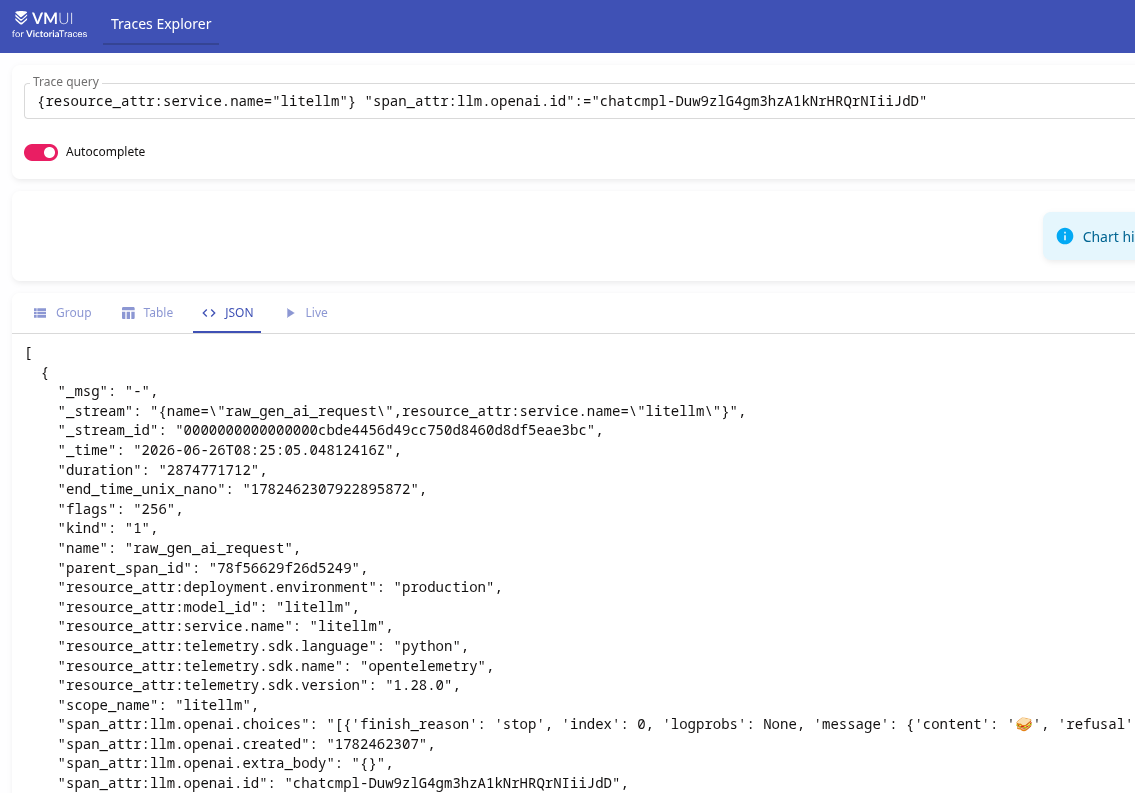
And we have that same trace in VictoriaTraces – search with {resource_attr:service.name="litellm"}, and you can add a filter "span_attr:llm.openai.id":="chatcmpl-NNN":
LiteLLM Prometheus Metrics
There are a lot of metrics, and they’re great.
Out of the box, the metrics cover pretty much 95% of what you need for basic monitoring.
The metrics code lives in the prometheus.py file.
Useful Metrics options
In LiteLLM’s settings you can choose which metrics get exported – see Enable Specific Metrics and Labels (the anchors on that docs page are broken, so Ctrl+F is your friend), but I haven’t set up any metric restrictions yet – collecting everything for now, and I’ll sort out what we don’t need later.
For monitoring Redis it’s worth enabling service_callback: ["prometheus_system"] in litellm_settings – this adds the litellm_redis_latency_bucket and litellm_redis_fails metrics, see Monitor System Health.
You can enable the end_user label – but that requires a bit of code changes. I already did this on our project – it’s a nice feature and useful for us. That said, keep cardinality in mind (see VictoriaMetrics: Churn Rate, High cardinality, metrics and IndexDB).
Metrics _created vs. _total
For the counter type, LiteLLM returns two different metrics – for example litellm_spend_metric_total and litellm_spend_metric_created.
The _created metrics are essentially internal, meant for Prometheus/VictoriaMetrics itself – we don’t care about them, see Start (Created) Timestamps Zero Injection and What are _created vs. _total metrics?
So we only use _total.
Main metrics
I’ve grouped the metrics into three main groups for myself:
- System Metrics and performance: pod status of LiteLLM itself, various latencies, queue size, Redis status, total token count, failed requests, per-model and per-provider data, LiteLLM’s own cache usage
- Costs and usage: everything about costs and token usage by clients, LLM provider cache usage
- Budgets and Limits: data on the limits we set for Teams and API Keys
Briefly on the most useful (imho) metrics.
System Metrics
litellm_in_flight_requests: a useful metric for system load – how many HTTP requests the unicorn workers are processing right now, see Pod Health Metricslitellm_proxy_failed_requests_metric: number of errors returned to LiteLLM clients after all retries/fallbacks (there’s a separate metric group per LLM/provider, see below)litellm_proxy_total_requests_metric: number of requests from clientslitellm_requests_metric: not mentioned in the docs, but this metric is deprecated – clearly stated in the code – it returns the same thing aslitellm_proxy_total_requests_metric- on latency:
litellm_request_total_latency_metric: total time to respond to the client, in secondslitellm_overhead_latency_metric: time spent processing the request by LiteLLM itselflitellm_llm_api_time_to_first_token_metric: time until the first response token is returned to the client (only for streaming requests, see LLM Streaming)
Latency is kind of its own topic, since there are some interesting nuances there – we’ll get into that in the Alerts/Grafana part, or possibly in the third LiteLLM monitoring post, the one about SLI/SLO/SLA.
Per Provider/LLM Metrics
litellm_deployment_success_responses: successful requests to a specific provider/modellitellm_deployment_failure_responses: same, but failures- unlike the “system” or “global” metric
litellm_proxy_failed_requests_metric–litellm_deployment_failure_responsescounts every failed request to a provider/model, and the set oflabelsis a bit different too – we’ll look at this in the next post about Alerts
- unlike the “system” or “global” metric
litellm_deployment_total_requests: total number of requests by provider/modellitellm_deployment_state: provider/LLM status – if a request to a model returned an error, it’ll show up herelitellm_remaining_requests_metricandlitellm_remaining_tokens_metric: a really interesting metric, since we often run into limits – the provider’s RPM and TPM limits, see Rate limits in headers, and we’ll set up alerts on these later (though there are some nuances there)
Costs && Usage Metrics
litellm_spend_metric: how much money has been spent, counter type, so we’ll calculate it withrate()orincrease()litellm_total_tokens_metric: input + output usage combinedlitellm_input_tokens_metricandlitellm_output_tokens_metric: and separately
Budgets && Limits
Very useful metrics for the budgets and limits we set for Teams or API Keys, see Team – Budget:
litellm_team_max_budget_metricandlitellm_remaining_team_budget_metric: total Team budget and how much is leftlitellm_api_key_max_budget_metricandlitellm_remaining_api_key_budget_metric: same, but per keylitellm_remaining_api_key_requests_for_modelandlitellm_remaining_api_key_tokens_for_model: same, but for RPM/TPM
Interestingly, there are no RPM/TPM limit metrics for Teams – even though you can set limits at the group level.
LiteLLM Traces
I actually thought I’d end up building metrics from traces – but as it turns out, the metrics really do cover most of the monitoring needs on their own.
Useful Traces options
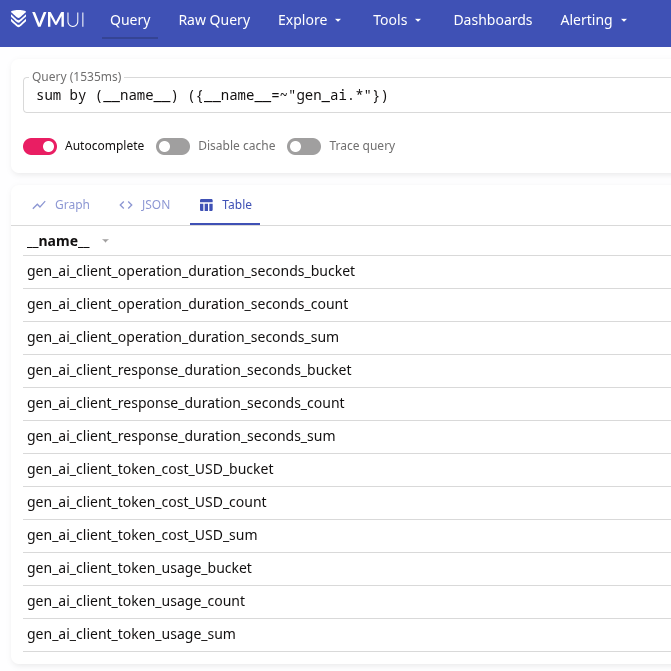
For traces you can enable LITELLM_OTEL_INTEGRATION_ENABLE_METRICS – this makes LiteLLM start writing a bunch of new metrics on top of the default ones (see Metrics Reference), with stats gathered from the traces.
But in practice it’s the same data we already have in the metrics:
Same as with labels in metrics – for spans you can limit the number of attributes that get added, see Control metric attribute cardinality.
There’s support for the Traceparent option (see Context propagation (W3C traceparent)) – which would attach LiteLLM’s spans to our own service’s spans, but I haven’t tested this yet, since I actually want to keep them as separate entities.
One fairly important setting – Capturing Message Content: you can enable storing user prompts and LLM responses in the traces (but keep privacy in mind).
There’s a USE_OTEL_LITELLM_REQUEST_SPAN variable that’s supposed to enable creating separate spans specifically for LLM requests, so they don’t get mixed up with LiteLLM’s own system spans (see Service-hook spans (a.k.a. “infrastructure” spans)), but there are some open questions about how this actually works, see below.
Trace structure
The root span for LLM requests from clients is always “Received Proxy Server Request”:
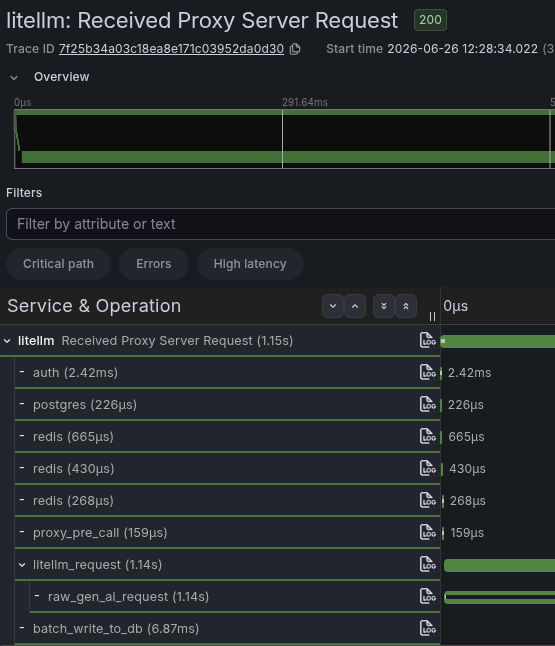
It includes system spans – database requests, the Redis cache, and so on.
With OTEL_SEMCONV_STABILITY_OPT_IN you can switch how span names are generated – instead of litellm_request you’ll get spans named after requests to specific models:
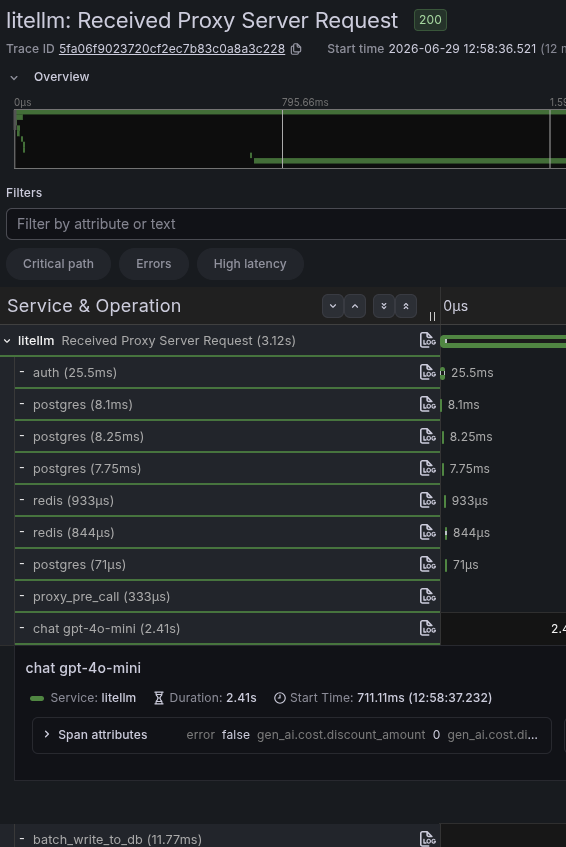
As for the litellm_request span itself: the docs, in the “Change in v1.81.0” section, explicitly say that starting from version 1.81.0 it shouldn’t exist (unless USE_OTEL_LITELLM_REQUEST_SPAN=true is explicitly set), but on my v1.87.1 it’s still there, even when I explicitly set USE_OTEL_LITELLM_REQUEST_SPAN=false.
Anyway, that’s not a big deal for now, and the overall span structure is pretty clear by default:
- “Received Proxy Server Request“: the root span, with the main attributes like
http.response.status_code,http.route,metadata.user_api_key_team_alias, etc.- “litellm_request“: the main span for data about the client’s request to LiteLLM (which supposedly shouldn’t exist – but does for me)
- “raw_gen_ai_request” – the request we build for the provider and its response, in OpenLLMetry format, see llm.{provider}.* (raw provider request/response, default mode only)
- “litellm_request“: the main span for data about the client’s request to LiteLLM (which supposedly shouldn’t exist – but does for me)
Spans “litellm_request” vs “raw_gen_ai_request”
While “Received Proxy Server Request” is fairly straightforward – it’s basically an “infrastructure span” holding HTTP request info, response code, and so on – litellm_request and raw_gen_ai_request are a different story, since they’re very similar to each other.
Again – let’s skip over the fact that litellm_request supposedly shouldn’t exist by default 🙂
Here’s how I personally understand it:
- litellm_request: this is “the view of the request from LiteLLM’s side” – what was received from the client, how much the request should cost, which Guardrails were applied on LiteLLM’s side, what was returned to the client in the response
- raw_gen_ai_request: this is “the view of the request from the LLM provider’s side” – what actually went to the provider, and what the provider returned in its response
So, for example, a request might look like this:
litellm_request(1 span) – received the request from the client, passing it to the providerraw_gen_ai_request: first attempt to call the provider’s API, but OpenAI returned 429raw_gen_ai_request: second attempt – LiteLLM does a retry/fallback, OpenAI returns a response with 200 – we return the response to the client
Also – I haven’t actually checked this, it’s purely a guess, but presumably it should work like this – the duration values will differ, because:
litellm_request.duration: LiteLLM overhead time + the time for the request to OpenAIraw_gen_ai_request.duration: only OpenAI’s time
Main span attributes
All attributes are listed in the Appendix: Spans, Metrics, and Attributes Reference, here’s the short version.
We search for traces with {resource_attr:service.name="litellm"} name:="litellm_request", and look at the JSON to see what’s actually in there:
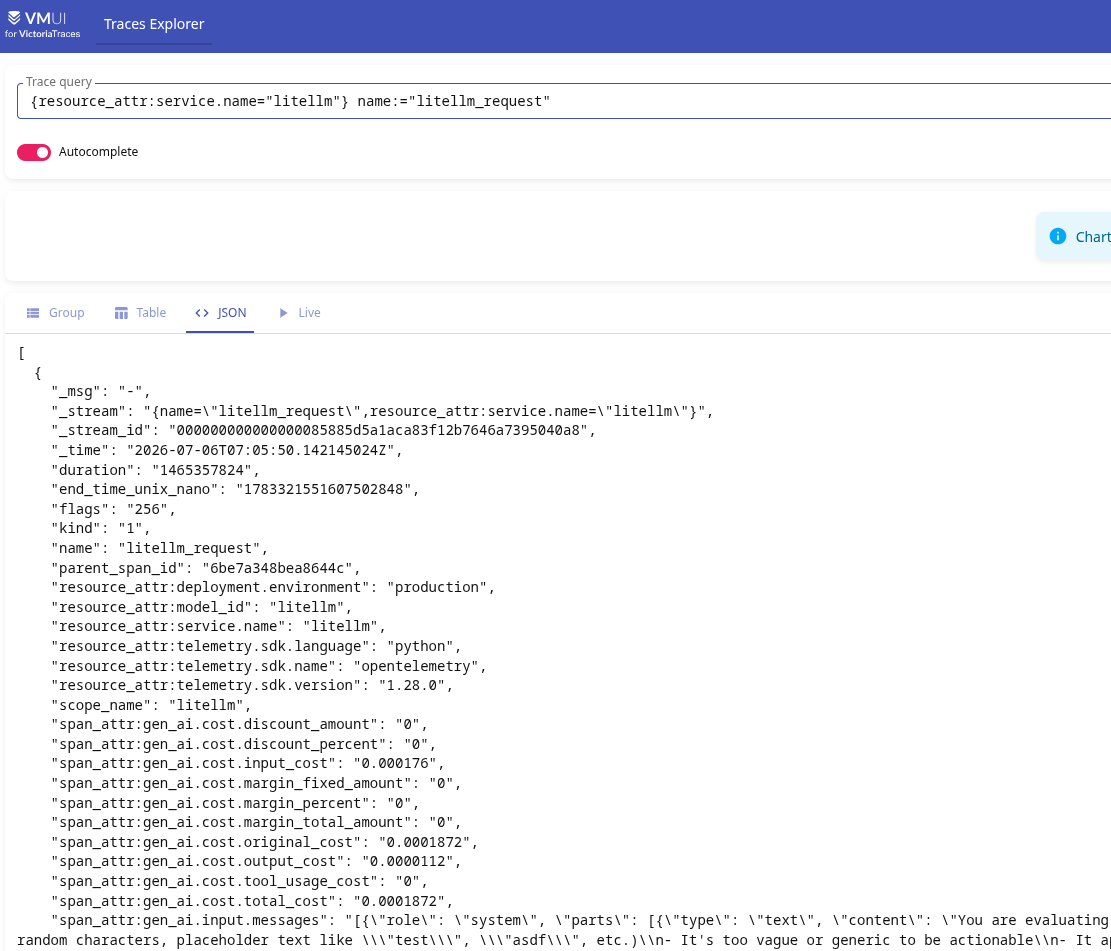
“litellm_request” attributes
These can be interesting:
gen_ai.*: attributes in the OTel Semantic Conventions format – holds data on the model, tokens, cost, messages (see the start of Attributes Reference):- examples:
gen_ai.cost.*,gen_ai.input.message,gen_ai.request.model,gen_ai.usage.input_tokens,gen_ai.usage.output_tokens
- examples:
metadata.*: what we add ourselves, plus additional data from LiteLLM itself, see metadata.* (proxy root, sometimes LLM span):- examples:
metadata.requester_ip_address,metadata.requester_metadata(ifend_useris done throughmetadata),metadata.user_api_key_alias
- examples:
hidden_params.*: added by LiteLLM itself, holds additional data about the request built for the provider:- examples:
hidden_params.api_base,hidden_params.api_key(the provider’s key, not the client’s, and it’s a hash of the key rather than the key itself),hidden_params.model, the samex_ratelimit_limit_requestsfor RPM/TPM,
- examples:
litellm.*: LiteLLM-specific data (spend, etc.)llm.request.type: request and API type (Completion, Responses, Embedding), see llm.* (proxy root and LLM span)
“raw_gen_ai_request” attributes
We search with {resource_attr:service.name="litellm"} name:="raw_gen_ai_request".
Here we have:
llm.openai.error,llm.openai.model- the value “openai“, i.e. the provider, only gets added for the Completions API – if the older Responses API is used, the value here will be None (haven’t used Anthropic models yet, not sure what shows up there)
llm.openai.id: the response ID from the provider – prefixed withchatcmpl_for the Completions API orresp_for the Responses APIspan_attr:llm.openai.messages– the prompt sent to the LLM (the equivalent of thegen_ai.input.messagesandgen_ai.output.messagesattributes in thelitellm_requestspan)- depends on
store_prompts_in_spend_logs, see UI Spend Log Settings
- depends on
span_attr:llm.openai.usage– token count
VictoriaTraces and query examples from LiteLLM Traces
In the VMAlert and Recording Rules from VictoriaTraces section of the traces-in-VictoriaTraces post I already wrote about building metrics from spans – here are just some examples of the interesting things we can pull from LiteLLM’s traces.
Most of the useful data is already available in the metrics – but sometimes you need to pull something directly from the spans.
Spans “Received Proxy Server Request”
Requests and Errors Rate
Number of requests by response code:
{resource_attr:service.name="litellm"} name:="Received Proxy Server Request"
| stats by ("span_attr:http.response.status_code") rate()
Or just errors – add the filter "span_attr:http.response.status_code":!="200":
{resource_attr:service.name="litellm"} name:="Received Proxy Server Request"
| "span_attr:http.response.status_code":!="200"
| stats by ("span_attr:http.response.status_code") rate()
Or by "span_attr:error.code" and "span_attr:error.type":
{resource_attr:service.name="litellm"} name:="Received Proxy Server Request"
| "span_attr:http.response.status_code":!="200"
| stats by ("span_attr:error.type", "span_attr:error.code") rate()
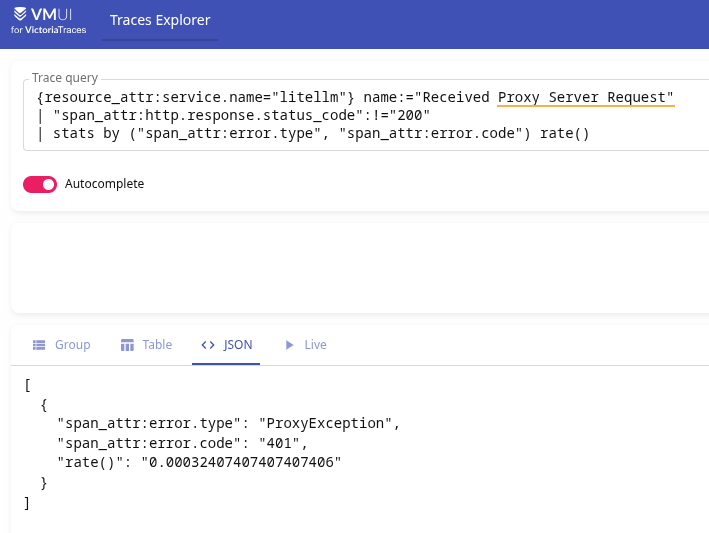
Keep in mind the default OTEL span attribute status_code:
- 0 (UNSET): status not set (default)
- 1 (OK): span completed successfully
- 2 (ERROR): span completed with an error
Requests Rate by Provider endpoints
To get stats by provider request endpoints – the span_attr:http.route attribute:
{resource_attr:service.name="litellm"} name:="Received Proxy Server Request"
| stats by ("span_attr:http.route") rate()
Stats by custom fields
One more example: our Backend API code has a json_schema for LLM requests:
class ChallengeSuitabilityResponse(BaseModel):
    """LLM response for whether a challenge is suitable for a user."""
    is_suitable: bool
This schema is used by a specific feature (a parent class in the code) called ChallengeWidgetGenerator – so we can get request stats per specific feature:
{resource_attr:service.name="litellm"}
    | extract "'name': '<schema_name>'" from "span_attr:llm.openai.response_format"
    | stats by (schema_name) count() as requests
    | sort by (requests desc)
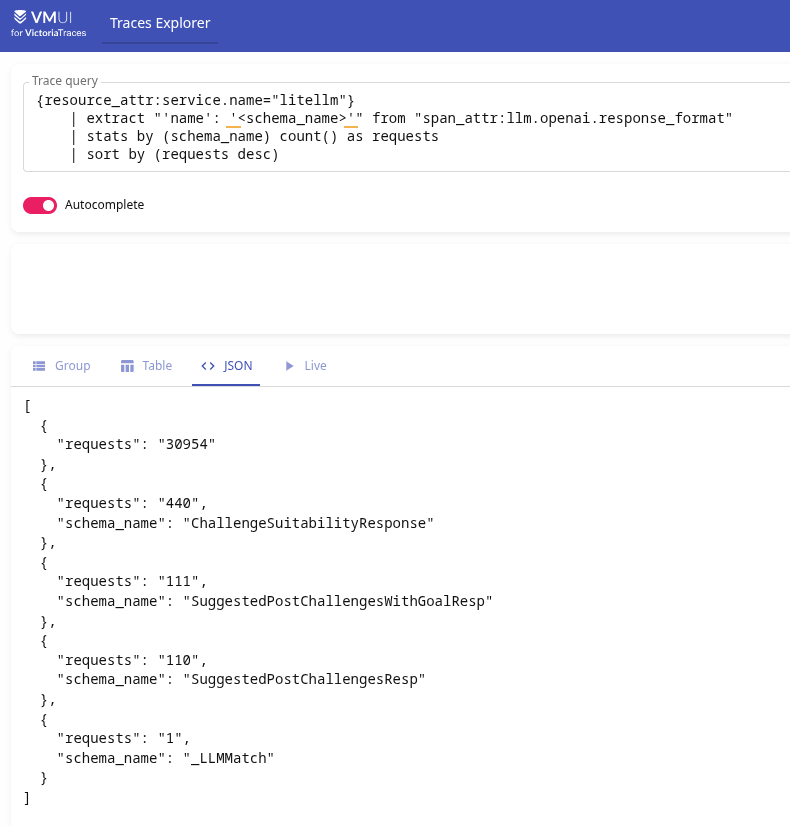
This is definitely a hack, but it’s just for the example.
Though it’s better to just pass extra data through metadata – which is what we did for end_user, see Track spend, set budgets and permissions for your customers:
resp = self.client.beta.chat.completions.parse(
    model=self.model,
    messages=messages,
    extra_body={"metadata": {"tags": ["ChallengeWidgetGenerator"]}},
    **kwargs,
)
Spans “litellm_request”
gen_ai.cost.total_cost and Spend/Tokens rate
To get the Per Second Spend Rate:
{resource_attr:service.name="litellm"} name:="litellm_request"
| stats by ("span_attr:gen_ai.cost.total_cost") rate()
Or token usage per second:
{resource_attr:service.name="litellm"} name:="litellm_request"
| stats by ("span_attr:gen_ai.usage.total_tokens") rate()
hidden_params and LogsQL unpack_json
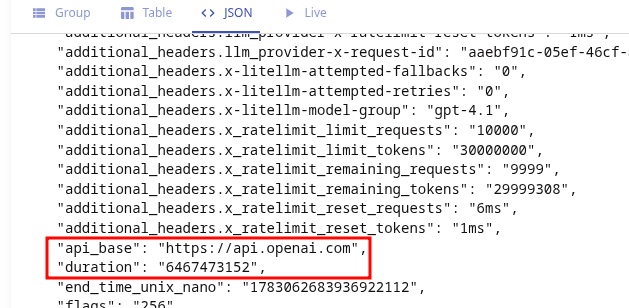
Another example with span_attr:hidden_params: it’s a nested JSON, so using unpack_json from VictoriaLogs LogsQL we can parse it into separate fields:
{resource_attr:service.name="litellm"} name:="litellm_request" "span_id":="6a6940892541b361"
| unpack_json from "span_attr:hidden_params"
And now we have api_base or model_id as regular labels:
Or, for convenience, you can add your own prefix:
{resource_attr:service.name="litellm"} name:="litellm_request" "span_id":="6a6940892541b361"
| unpack_json from "span_attr:hidden_params" result_prefix "hp_"
And we can build data for, say, the provider’s RPM and TPM:
{resource_attr:service.name="litellm"} name:="litellm_request" "span_id":="6a6940892541b361"
| unpack_json from "span_attr:hidden_params" result_prefix "hp_"
| stats min("hp_additional_headers.x_ratelimit_remaining_requests") as min_remaining_requests, min("hp_additional_headers.x_ratelimit_remaining_tokens") as min_remaining_tokens
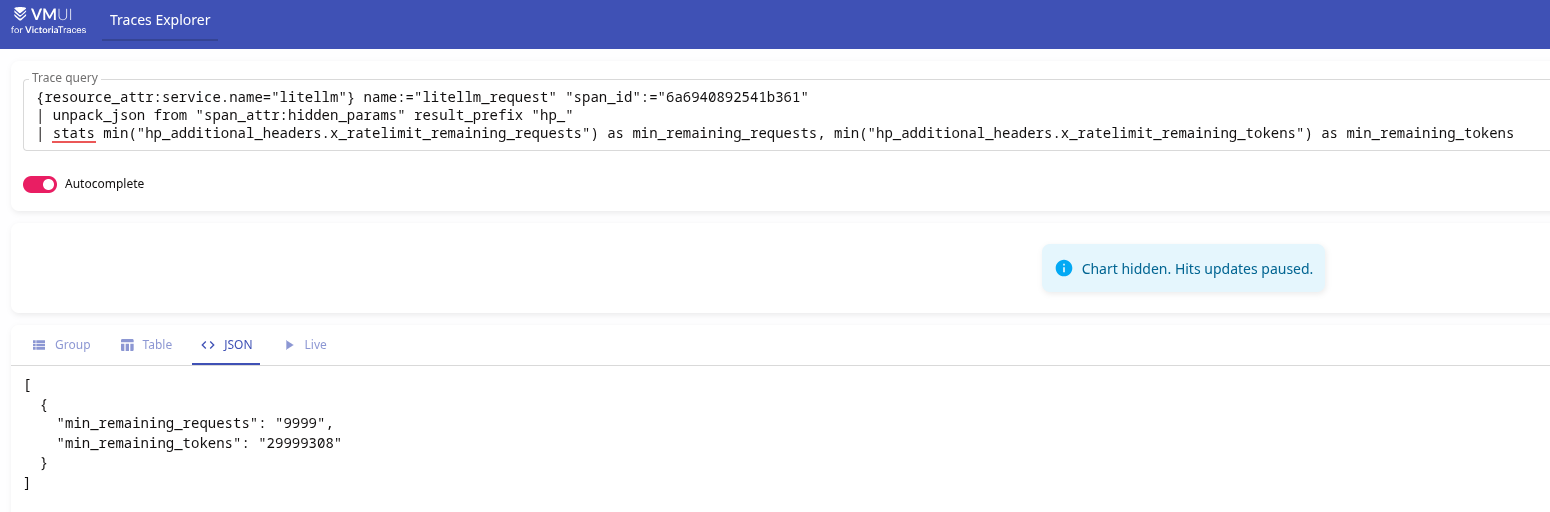
But this won’t work with "span_attr:gen_ai.input.messages" – since that’s not a JSON object, but an array [...].
Still, we can do something here with extract_regexp:
{resource_attr:service.name="litellm"} name:="litellm_request" "span_id":="6a6940892541b361"
| extract_regexp "\"content\": \"(?P<system_prompt>[^\"]+)\"" from "span_attr:gen_ai.input.messages"
And now we have the system prompt separately:

And that’s pretty much it for now: time to move on to the actual monitoring – building alerts and Grafana dashboards.
