![]() В пості Prometheus: запуск Pushgateway у Kubernetes з Helm та Terraform писав про те, як для Prometheus додати Pushgateway, який дозволяє використовувати Push-модель замість Pull, тобто – експортер може відправити метрики прямо в базу замість того, щоб чекати, коли до нього прийде сам Prometheus або VMAgent.
В пості Prometheus: запуск Pushgateway у Kubernetes з Helm та Terraform писав про те, як для Prometheus додати Pushgateway, який дозволяє використовувати Push-модель замість Pull, тобто – експортер може відправити метрики прямо в базу замість того, щоб чекати, коли до нього прийде сам Prometheus або VMAgent.
У VictoriaMetrics з цим набагато простіше, бо ніякого Pushgateway не потрібно – VictoriaMetrics “з коробки” вміє приймати метрики, і це одна з тих чудовіих фіч, чому я вибрав VictoriaMetrics, і досі їй радуюсь.
Отже, що є і треба зробити:
- в Kubernetes-кластері є VictoriaMetrics встановлена з VictoriaMetrics Operator – див. VictoriaMetrics: створення Kubernetes monitoring stack з власним Helm-чартом
- у нас є новий експортер для Notion, який буде запускатись в Kubernetes по крону раз на добу
- працювати він буде недовго, якісь секунди, тож “ходити” до нього з VMAgent ми не можемо
- тому замість Pull-моделі з VMAgent – використаємо Push-модель – експортер буде відправляти метрики прямо в VictoriaMetrics
Тож спочатку давайте глянемо, як в VictoriaMetrics пушити метрики взагалі, а потім спробуємо написати простий експортер.
Зміст
VictoriaMetrics API
Використовуємо ендпоінт /api/v1/import/prometheus.
Запускаємо тестовий под:
$ kubectl -n dev-monitoring-ns run pod --rm -i --tty --image ubuntu -- bash
Встановлюємо curl:
root@pod:/# apt update && apt -y install curl
Знаходимо Kubernetes Service для VMSingle:
$ kubectl -n dev-monitoring-ns get svc | grep vmsing
vmsingle-vm-k8s-stack                                  ClusterIP   172.20.45.38     <none>        8429/TCP                     35d
Виконуємо запит на ендпоінт http://vmsingle-vm-k8s-stack:8429/api/v1/import/prometheus:
root@pod:/# echo "some_metric 3.14" | curl --data-binary @- http://vmsingle-vm-k8s-stack:8429/api/v1/import/prometheus
І за півхвилини перевіряємо в VMui:
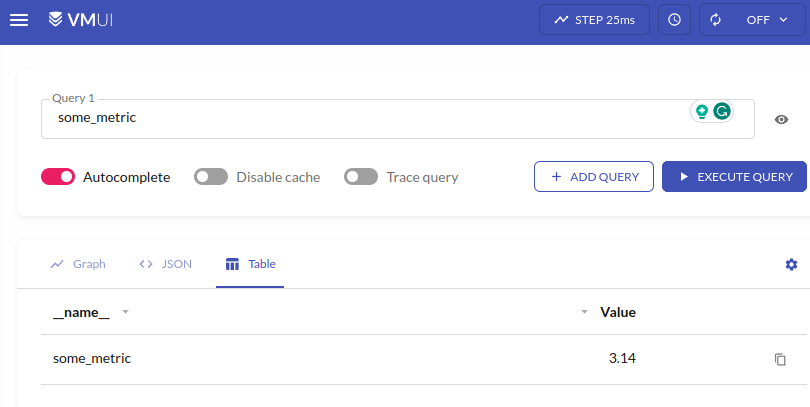
Все є, і ніяких тобі додаткових дій з Pushgateway!
Push метрик з експортера
Для тесту напишемо простий експортер:
#!/usr/bin/env python3

from time import sleep
from prometheus_client import Counter, CollectorRegistry, push_to_gateway

# local metrics "storage"
registry = CollectorRegistry()

# register a metric
counter = Counter('counter_metric', 'Example metric', ["label_name"], registry=registry)

while True:
  # increase metric's value to +1
  counter.labels(label_name="label_value").inc()
  # push to the VictoriaMetrics
  push_to_gateway('localhost:8428/api/v1/import/prometheus', job='test_job', registry=registry)
  # make sure this code is working :-)
  print("pushed")
  # wait before next run
  sleep(15)
Тут:
- реєструємо “локальне сховище” для метрик (див. Overall structure)
- реєструємо метрику
counter_metricз типом Counter - виконуємо її інкремент з
inc() - і відправляємо в
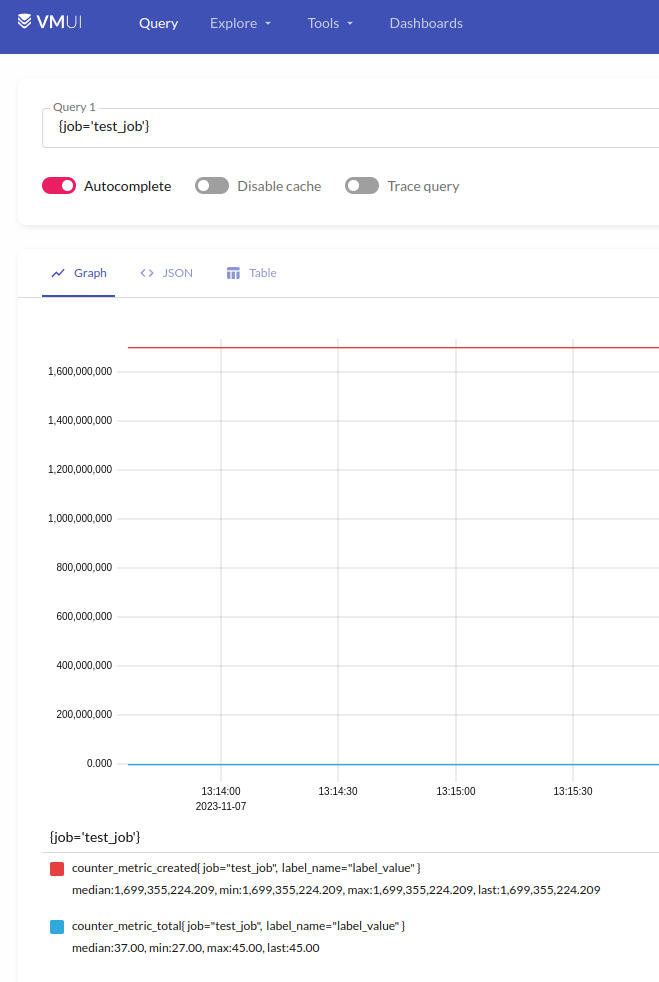
localhost:8428/api/v1/import/prometheus– це я перевіряв на тестовому інтансі, де VictoriaMetrics запущена з Docker Compose, тому тутlocalhost
Перевіряємо в самій VictoriaMetrics:
prometheus_client, функції та grouping key
Трохи про те, як працює сам prometheus_client:
push_to_gateway()вregistryбудуть перезаписані всі метрики з однаковим набором labels (grouping key)pushadd_to_gateway()перезапише метрики з однаковим іменем та grouping keydelete_from_gateway()видалить метрики з заданим job та grouping key
Див. Exporting to a Pushgateway та Prometheus Pushgateway.
Kubernetes CronJob та Prometheus Exporter
І приклад того, як воно все буде виглядати в Kubernetes.
Сам експортер, який буде ходити в Notion та збирати дані (код функцій не покажу, бо робочі моменти):
#!/usr/bin/env python3

import os
import requests

from datetime import datetime
from prometheus_client import Summary, CollectorRegistry, push_to_gateway

...

###################################################
### get_ios_ui_tests_status_and_failure_reasons ###
###################################################

registry = CollectorRegistry()

notion_ios_ui_test_last_100_results = Summary('notion_ios_ui_test_last_100_results',
                             'Status and failure reasons of last 100 iOS UI test runs',
                             labelnames=['reason'], registry=registry)

def get_last_ios_ui_test_results():
    print(f"\nStarted get_last_ios_ui_test_results() checks at {datetime.now()}")
    ...
    for reason in reasons.keys():
        notion_ios_ui_test_last_100_results.labels(reason=reason).observe(reasons[reason])
        print(f"collected reason: {reason} = {reasons[reason]} records")


def main():

    try:
        get_last_ios_ui_test_results()
        push_to_gateway('vmsingle-vm-k8s-stack:8429/api/v1/import/prometheus', job='notion-exporter', registry=registry)
    except Exception as e:
        print("Notion API error occurred:", str(e))


if __name__ == '__main__':
    print(f"\nStarting Notion Exporter at {datetime.now()}")
    main()
Kubernetes CronJob та Secret для нього – поки в тестуванні, тож запускається кожну хвилину:
apiVersion: batch/v1
kind: CronJob
metadata:
  name: notion-exporter-cronjob
spec:
  schedule: "*/1 * * * *"
  jobTemplate:
    spec:
      template:
        metadata:
          labels:
            app: notion-exporter
        spec:
          containers:
          - name: notion-exporter-container
            image: 492***148.dkr.ecr.us-east-1.amazonaws.com/notion-exporter:latest
            imagePullPolicy: Always
            env:
            - name: NOTION_REPORTS_DATABASE_ID
              value: "fc2***8e0"
            envFrom:
              - secretRef:
                  name: notion-exporter-secret
          restartPolicy: OnFailure
---
apiVersion: v1
kind: Secret
metadata:
  name: notion-exporter-secret
type: Opaque
stringData:
  NOTION_SECRET: "secret_SmX***ejH"
І дані в Grafana:
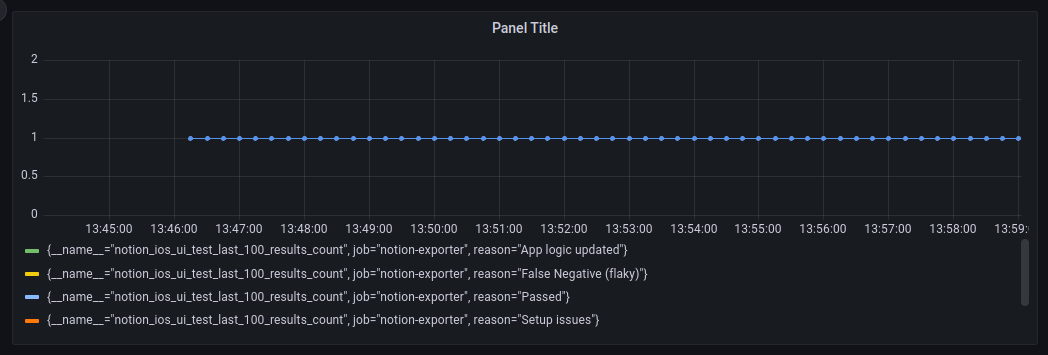
Готово.
![]()