![]() In the Prometheus: running Pushgateway on Kubernetes with Helm and Terraform post I wrote about how to add Pushgateway to Prometheus, which allows using the Push model instead of Pull, that is, an Exporter can send metrics directly to the database instead of waiting for Prometheus or VMAgent to come to it.
In the Prometheus: running Pushgateway on Kubernetes with Helm and Terraform post I wrote about how to add Pushgateway to Prometheus, which allows using the Push model instead of Pull, that is, an Exporter can send metrics directly to the database instead of waiting for Prometheus or VMAgent to come to it.
With VictoriaMetrics, it’s much easier because you don’t need any Pushgateway – VictoriaMetrics can accept metrics out of the box, and this is one of the great features that made me choose VictoriaMetrics, and why I’m still happy with it.
So, what do we have now, and what needs to be done:
- we have a Kubernetes cluster with VictoriaMetrics installed with VictoriaMetrics Operator – see VictoriaMetrics: deploying a Kubernetes monitoring stack
- we have a new Exporter for the Notion, that will run in Kubernetes CronJob once a day
- it will not work for long, just for a few seconds, so we cannot “go” to it with VMAgent
- therefore, instead of the Pull model with VMAgent, we will use the Push model – the Exporter will send metrics directly to VictoriaMetrics
So, first, let’s see how we can send metrics to VictoriaMetrics manually, and then will try to write a simple exporter.
Contents
VictoriaMetrics API
To push data to VictoriaMetrics we can use the /api/v1/import/prometheusendpoint.
Run a testing Pod:
$ kubectl -n dev-monitoring-ns run pod --rm -i --tty --image ubuntu -- bash
Install curl:
root@pod:/# apt update && apt -y install curl
Find a Kubernetes Service for VMSingle:
$ kubectl -n dev-monitoring-ns get svc | grep vmsing
vmsingle-vm-k8s-stack                                  ClusterIP   172.20.45.38     <none>        8429/TCP                     35d
Send a request to the http://vmsingle-vm-k8s-stack:8429/api/v1/import/prometheus:
root@pod:/# echo "some_metric 3.14" | curl --data-binary @- http://vmsingle-vm-k8s-stack:8429/api/v1/import/prometheus
And in half a minute, check it in the VMui:
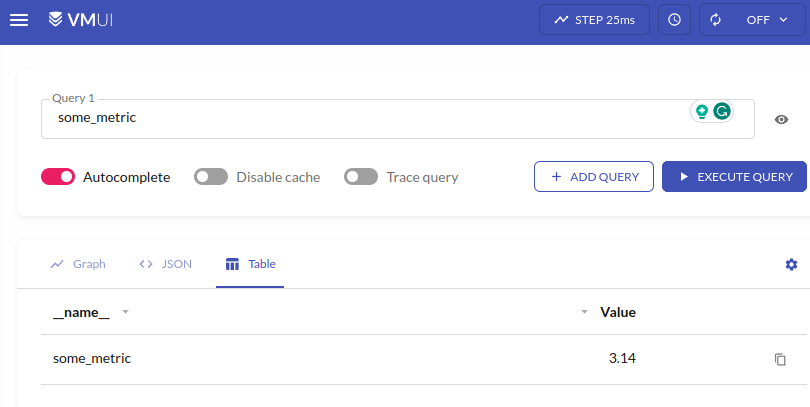
The new metric is there, and no need for any addition configuration for the Prometheus Pushgateway!
Push metrics from an Exporter
For the test, let’s write a simple exporter in Python using the prometheus_client module:
#!/usr/bin/env python3

from time import sleep
from prometheus_client import Counter, CollectorRegistry, push_to_gateway

# local metrics "storage"
registry = CollectorRegistry()

# register a metric
counter = Counter('counter_metric', 'Example metric', ["label_name"], registry=registry)

while True:
  # increase metric's value to +1
  counter.labels(label_name="label_value").inc()
  # push to the VictoriaMetrics
  push_to_gateway('localhost:8428/api/v1/import/prometheus', job='test_job', registry=registry)
  # make sure this code is working :-)
  print("pushed")
  # wait before next run
  sleep(15)
Here:
- register a “local storage” for metrics (see Overall structure)
- register a metric
counter_metricwith the Counter type - perform its increment with the
inc() - and send it to the
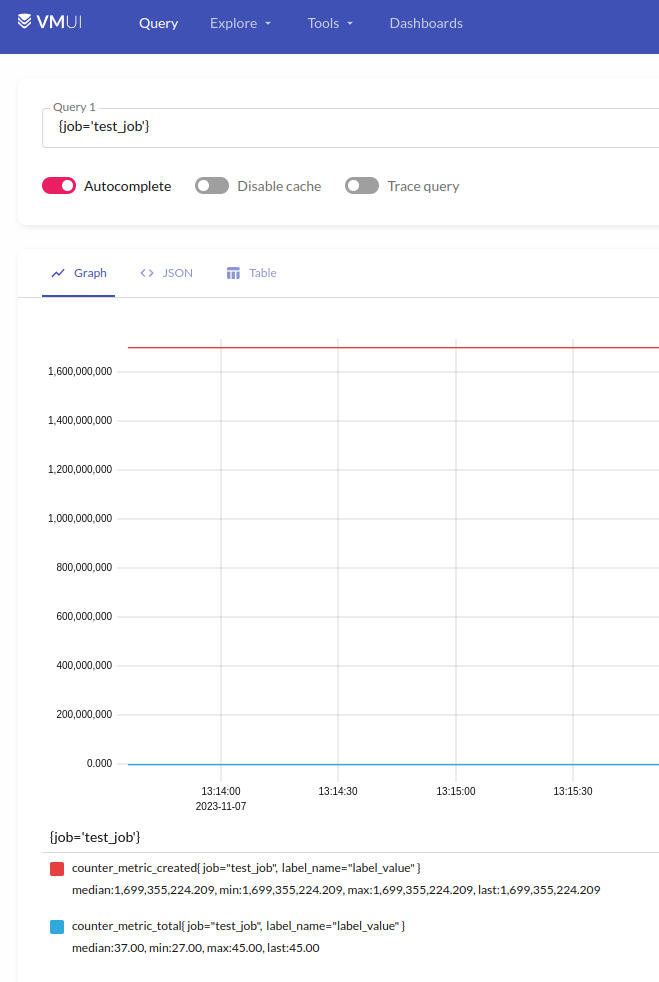
localhost:8428/api/v1/import/prometheus– I checked this on a test instance where VictoriaMetrics is running with Docker Compose, so here islocalhostused
Let’s check with VictoriaMetrics itself:
prometheus_client, functions and grouping key
A little bit about how we can use functions from the prometheus_client:
push_to_gateway(): in theregistryall metrics with the same set of labels (grouping key) will be overwrittenpushadd_to_gateway(): overwrites metrics with the same name and grouping keydelete_from_gateway(): delete metrics with the specified job and grouping key
See Exporting to a Pushgateway and Prometheus Pushgateway.
Kubernetes CronJob and Prometheus Exporter
And an example of how it will look like in Kubernetes.
The Exporter itself, which will go to the Notion and collect data (the code for the Notion itself is omitted here, as was written by a colleague):
#!/usr/bin/env python3

import os
import requests

from datetime import datetime
from prometheus_client import Summary, CollectorRegistry, push_to_gateway

...

###################################################
### get_ios_ui_tests_status_and_failure_reasons ###
###################################################

registry = CollectorRegistry()

notion_ios_ui_test_last_100_results = Summary('notion_ios_ui_test_last_100_results',
                             'Status and failure reasons of last 100 iOS UI test runs',
                             labelnames=['reason'], registry=registry)

def get_last_ios_ui_test_results():
    print(f"\nStarted get_last_ios_ui_test_results() checks at {datetime.now()}")
    ...
    for reason in reasons.keys():
        notion_ios_ui_test_last_100_results.labels(reason=reason).observe(reasons[reason])
        print(f"collected reason: {reason} = {reasons[reason]} records")


def main():

    try:
        get_last_ios_ui_test_results()
        push_to_gateway('vmsingle-vm-k8s-stack:8429/api/v1/import/prometheus', job='notion-exporter', registry=registry)
    except Exception as e:
        print("Notion API error occurred:", str(e))


if __name__ == '__main__':
    print(f"\nStarting Notion Exporter at {datetime.now()}")
    main()
Kubernetes CronJob and Secret for it are still in testing, so it runs every minute:
apiVersion: batch/v1
kind: CronJob
metadata:
  name: notion-exporter-cronjob
spec:
  schedule: "*/1 * * * *"
  jobTemplate:
    spec:
      template:
        metadata:
          labels:
            app: notion-exporter
        spec:
          containers:
          - name: notion-exporter-container
            image: 492***148.dkr.ecr.us-east-1.amazonaws.com/notion-exporter:latest
            imagePullPolicy: Always
            env:
            - name: NOTION_REPORTS_DATABASE_ID
              value: "fc2***8e0"
            envFrom:
              - secretRef:
                  name: notion-exporter-secret
          restartPolicy: OnFailure
---
apiVersion: v1
kind: Secret
metadata:
  name: notion-exporter-secret
type: Opaque
stringData:
  NOTION_SECRET: "secret_SmX***ejH"
And the data is in Grafana:
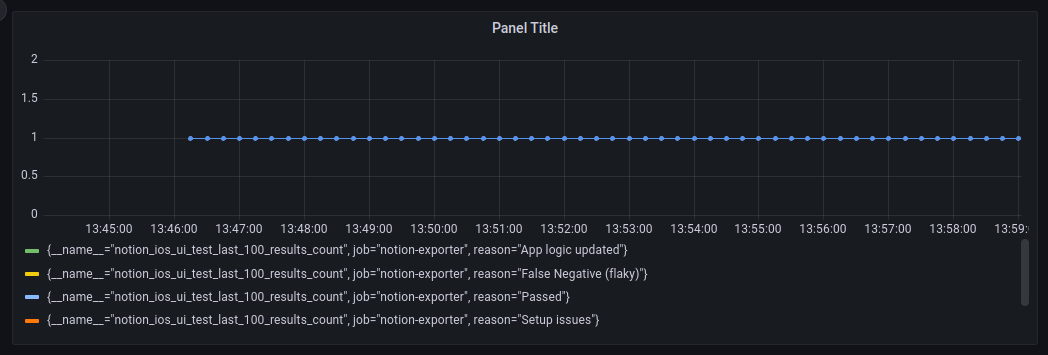
Done.
![]()