In Kubernetes, in addition to metrics and logs from containers, we can get information about the operation of components using Kubernetes Events.
Events usually store information about the status of Pods (creation, evict, kill, ready or not-ready status of pods), WorkerNodes (status of servers), Kubernetes Scheduler (inability to start a pod, etc.).
Contents
Kubernetes Events types
In general, all these events can be divided into the following types:
- Failed events: when there are problems with the manifest or image from which you want to create a container (
ImagePullBackOff,CrashLoopBackOff) - Eviction events: when a Pod is deleted because a WorkerNode has few resources (Node-pressure Eviction), or the Node needs to be deleted, and the autoscaler (for example, Karpenter) performs node drain (API-initiated Eviction)
- Scheduler events: problems with starting a Pod on a WorkerNode, for example, when the Scheduler cannot find a Node with sufficient resources to satisfy the Pod’s
requests - Volume events: problems with connecting a PersistentVolume to Pod (
FailedAttachVolume,FailedMount) - Node events: problems with WorkerNodes (
NodeNotReady)
Kubernetes Events and kubectl
We can get the events simply with kubectl, or by running kubectl describe pod <POD_NAME> or kubectl decsribe deploy <DEPLOY_NAME>:
Or with kubectl get events, to which you can add the --watch parameter:
There is also an interesting kubectl’s plugin podevents that adds event times.
You can install it using the krew plugin manager:
$ kubectl krew install podevents
And run it by passing a name of Pod:
Kubernetes Events, and Grafana Loki
There are many solutions for working with events:
sloop– active, event visualization system with filtering and searching capabilitieskspan– active, creates OpenTelemetry Spans from events, which can then be checked in systems like Jaegerkubernetes-event-exporter– active, able to send events to, probably, everything – AWS SQS/SNS, Opsgenie, Slack, Loki, and so on – maybe it will be the next in my Kubernetes cluster when the current solution becomes insufficient- Grafana Agent (Grafana Alloy) – also knows how to work with events, and write them in the form of logs in Loki
eventrouter– in the archive since 2022kubewatch– in the archive since 2022
But, as for me, the best way is to have events in the form of logs, and then use Loki RecordingRules to create metrics, and from them to have graphs in Grafana, and/or alerts in Alertmanager.
To do this, there is a simple system max-rocket-internet/k8s-event-logger that listens to the Kubernetes API, receives all events, and writes them as a log in JSON.
It can be installed from the Helm-chart:
$ helm repo add deliveryhero https://charts.deliveryhero.io/
$ helm -n monitoring install k8s-event-logger deliveryhero/k8s-event-logger
This will create a Pod that will actually read events:
$ kubectl -n ops-monitoring-ns get pods -l "app.kubernetes.io/name=k8s-event-logger"
NAME                                READY   STATUS    RESTARTS   AGE
k8s-event-logger-5b548d6cc4-r8wkl   1/1     Running   0          68s
And the Pod will write events to its output:
$ kubectl -n ops-monitoring-ns logs -l "app.kubernetes.io/name=k8s-event-logger"
{"metadata":{"name":"backend-api-deployment-7fdfbb755-tjv2j.17daa9e0264e6139","namespace":"prod-backend-api-ns","uid":"1fa06477-62c9-4324-8823-7f2801fc26af","resourceVersion":"110778929","creationTimestamp":"2024-06-20T08:43:07Z","managedFields":[{"manager":"kubelet","operation":"Update","apiVersion":"v1","time":"2024-06-20T08:43:07Z",
...
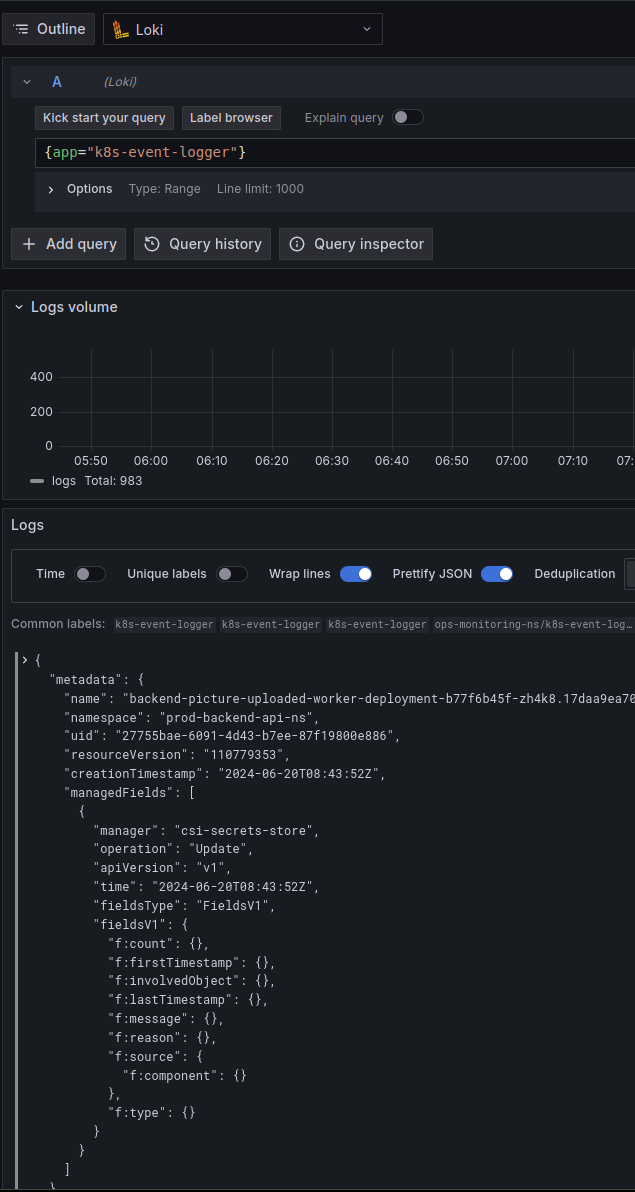
Which will then go to a Promtail instance, and from there to the Loki:
In general, that’s all.
Now, having the history of events, it will be much easier to debug any problems with Pods or WorkerNodes in Kubernetes.
![]()


