![]() In the previous posts on OpenTelemetry and VictoriaTraces (see OpenTelemetry: OTel Collectors in Kubernetes and integration with the VictoriaMetrics stack and VictoriaTraces: Tracing, Observability and OpenTelemetry) we covered the general concepts of what observability is and how to work with traces.
In the previous posts on OpenTelemetry and VictoriaTraces (see OpenTelemetry: OTel Collectors in Kubernetes and integration with the VictoriaMetrics stack and VictoriaTraces: Tracing, Observability and OpenTelemetry) we covered the general concepts of what observability is and how to work with traces.
But this topic actually came up on the project when we realized that using LLMs is becoming an important part of our product – but unlike the other components, I have no monitoring at all of how the LLM is actually used, how many tokens each service spends, how many errors we get.
So we started “wrapping” all of this in tracing to get data from our services. On top of that, we have a separate homegrown OpenAI Exporter that collects token and cost data from the OpenAI API.
That said, once we’d “wrapped” everything and started pulling data from different systems into a single backend – VictoriaMetrics/VictoriaTraces – and building dashboards in Grafana and metrics with VMAlert, one unpleasant thing turned up: different components use different libraries to work with LLMs, different libraries to create spans, create attributes differently – so we end up having to build different dashboards and different alerts.
There are options to solve this, of course: either rewrite the code of all the systems to use the same libraries – or create custom span attributes so they’re identical across all services.
But that’s, first – a lot of code changes, and second – I don’t want to restrict the developers with rules like “use only this library” or “always add these attributes to your spans”.
So I decided to look at a different approach: let everyone do whatever they want – but route all the requests from all the systems through a single gateway, an AI Gateway – and it will create the traces and metrics itself – and then everyone will share a common context in the form of common attributes/labels/metrics.
Besides, a common gateway solves a whole bunch of other tasks – centralized access management, budgets with limits, and failover between OpenAI/Anthropic if one system goes down.
Today we’ll take a look at what LiteLLM is in general, run it locally in Docker, and then, if I like it (and so far – I do, though a few questions came up) – we’ll launch it in Kubernetes and integrate it with our existing monitoring stack – VictoriaMetrics, VictoriaLogs, VictoriaTraces, Grafana.
This is the first post about running LiteLLM, all parts are:
- (current) LiteLLM: AI Gateway for LLMs – Features Overview
- LiteLLM: AI Gateway on Kubernetes and Metrics in VictoriaMetrics
- LiteLLM: Metrics, Traces, and VictoriaMetrics Stack Integration
And more are coming soon, so stay tuned for updates and follow my Telegram channel @rtfmcoua_en or LinkedIn group RTFM! DevOps[at]UA.
Contents
LiteLLM – main features
The project page is litellm.ai, all the documentation is at docs.litellm.ai, the project’s GitHub is BerriAI/litellm.
So, what LiteLLM is: it’s a system for building a single gateway that proxies all requests to LLMs and various providers through itself – the Backend API can send requests to AWS Bedrock for RAG, client AI Agents can send requests to OpenAI or Anthropic, and you can even route the developers’ Claude Code through this gateway and get a picture of who uses how many tokens (although in the Claude Code case there’s the matter of API usage, since LiteLLM apparently can’t work through a subscription – only the API).
At the same time, we calmly keep the existing metrics and traces that are already generated by the services – because they’re already familiar to the developers and somewhat integrated into our monitoring. And on top of them – we get new ones, with a common context for our whole project and the AI/LLM in it.
There’s also a LiteLLM Python SDK – you can have all of LiteLLM’s features right from your code without needing to spin up a separate proxy service.
Some of LiteLLM’s interesting features:
- Admin Web UI: a single web interface for monitoring and configuration
- Alerting & Monitoring: out of the box we get logs, metrics, alerts, and integration with Prometheus/VictoriaMetrics and systems like Phoenix/Langfuse
- Cost tracking: out of the box it automatically monitors model usage costs, returns metrics and traces with cost data, and you can configure budgets for different keys, teams, and users
- Centralized authentication: a single system for managing access – groups, users, keys, separate budgets and limits, and even restricting access to LiteLLM by IP
- Budgets, Rate Limits: lots of settings for controlling provider usage
- Skills Registry: keep all your skills in one place – but this seems to be only for Claude Code
- MCP Gateway: you can have all your configured MCP servers on LiteLLM – and clients like VSCode, Cursor, Claude Code just talk to it
- Agent Gateway: you can have a proxy for agent-to-agent communication and monitor all that activity
- LLM Response caching: LiteLLM can keep a cache of responses from the LLM – for the same request from a client it returns a cached response instead of making a new request to the LLM
- see also Prompt Caching
- Memory: storing settings and context between sessions
- Vector Store: LiteLLM can act as a proxy to various Vector Stores and record additional data for monitoring
- Guardrails: protecting sensitive data – prompt injection, masking user data
- Policies: there’s a set of ready-made policies, and you can create your own
- Load Balancing: automatic balancing between different providers and/or models depending on load or priorities
- Model Health Status: checking the LLM status and excluding from routing the providers that are unavailable
- Fallbacks: automatic request routing if a model or provider is unavailable
- Traffic Mirroring: an interesting feature – sending requests to two different models at once so you can compare the results of their work
Why do we need this?
Every time you want to spin up something new – you have to ask yourself “And what problem, exactly, are we solving?”
In our specific case it’s:
- access management: instead of a gazillion API keys in OpenAI/Anthropic – having configured groups in LiteLLM, each with its own budgets and limits
- monitoring: having common metrics, logs, and traces with common labels/attributes
- failover: being able to automatically switch to another provider if we hit the limits on the current one (or if Claude goes down again)
Running LiteLLM with Docker
For Lite to work properly it needs a database – it’ll store all the users and groups, model settings, budgets, and LLM spend, see What is stored in the DB.
So with Docker we’ll create two containers – the Gateway itself and a PostgreSQL for it.
Documentation – Getting Started Tutorial.
For a Production setup it’s also worth adding Redis – but we’ll talk about that in the next part. See Deployment Options and High Availability Setup (Resolve DB Deadlocks).
For running in Kubernetes there’s a Helm chart (beta) and an unofficial litellm-operator.
Config.yaml – LiteLLM configuration
Before launching LiteLLM we need a config for how it’ll work – see the documentation Config.yaml, and all the parameters in All settings.
We create a litellm_config.yaml file with minimal settings:
model_list:
  - model_name: gpt-4o-mini
    litellm_params:
      model: openai/gpt-4o-mini
      api_key: os.environ/OPENAI_API_KEY

general_settings:
  master_key: os.environ/LITELLM_MASTER_KEY

litellm_settings:
  callbacks:
  - prometheus
Here:
model_list: the list of models that will be available to clients – see LLM configs model_listmodel_name: the name we get in the request from the client (how we’ll specify it in the code, e.g.client.chat.completions.create(model="gpt-4o-mini"))- each model in this list is a separate deployment in LiteLLM terminology – see Quick Start and Proxy – Load Balancing
litellm_params: the provider parameters for this model
general_settings: see General Settings general_settingsmaster_key: the main key for authentication and for the admin in the Web UI- you can also pass the database parameters here, but for now we’ll do it via environment variables
litellm_settings: settings for LiteLLM itself – monitoring, logging, caching, see litellm_settings – Referencecallbacks: we expose metrics (the/metrics/endpoint), later we’ll add trace sending here, see Prometheus metrics
We create a docker-compose.yml – describing how to run LiteLLM itself and the PostgreSQL for it:
services:
  postgres:
    image: postgres:16-alpine
    environment:
      POSTGRES_USER: litellm
      POSTGRES_PASSWORD: litellm
      POSTGRES_DB: litellm
    volumes:
      - postgres_data:/var/lib/postgresql/data
    healthcheck:
      test: ["CMD-SHELL", "pg_isready -U litellm"]
      interval: 5s
      timeout: 5s
      retries: 5

  litellm:
    image: ghcr.io/berriai/litellm:main-latest
    ports:
      - "4000:4000"
    volumes:
      - ./litellm_config.yaml:/app/config.yaml
    env_file:
      - .env
    environment:
      DATABASE_URL: postgresql://litellm:litellm@postgres:5432/litellm
      LITELLM_LOG: DEBUG
    command: ["--config", "/app/config.yaml", "--port", "4000"]
    depends_on:
      postgres:
        condition: service_healthy

volumes:
  postgres_data:
Here we have PostgreSQL with a health check used by the LiteLLM instance, and through the DATABASE_URL environment variable we pass LiteLLM the connection string to connect to the database.
We generate a key for $LITELLM_MASTER_KEY – in OpenAI format, with the sk- prefix (“secret key“):
$ echo "sk-$(openssl rand -hex 16)"
sk-db69761228204509fa80f934bff6e0f5
We set it in an environment variable:
$ export LITELLM_MASTER_KEY=sk-db69761228204509fa80f934bff6e0f5
We create a .env file with the API key for OpenAI and for LiteLLM itself:
$ echo "OPENAI_API_KEY=$OPENAI_API_KEY" > .env
$ echo "LITELLM_MASTER_KEY=$LITELLM_MASTER_KEY" >> .env
We launch it – the first run will take a few minutes while all the migrations roll into the database.
We wait for the messages “Application startup complete” and “Uvicorn running on“:
$ docker compose up
...
litellm-1   | INFO:     Waiting for application startup.
litellm-1   |
litellm-1   |    ██╗     ██╗████████╗███████╗██╗     ██╗     ███╗   ███╗
litellm-1   |    ██║     ██║╚══██╔══╝██╔════╝██║     ██║     ████╗ ████║
litellm-1   |    ██║     ██║   ██║   █████╗  ██║     ██║     ██╔████╔██║
litellm-1   |    ██║     ██║   ██║   ██╔══╝  ██║     ██║     ██║╚██╔╝██║
litellm-1   |    ███████╗██║   ██║   ███████╗███████╗███████╗██║ ╚═╝ ██║
litellm-1   |    ╚══════╝╚═╝   ╚═╝   ╚══════╝╚══════╝╚══════╝╚═╝     ╚═╝
litellm-1   |
litellm-1   | query-engine ac9d7041ed77bcc8a8dbd2ab6616b39013829574
litellm-1   | INFO:     Application startup complete.
litellm-1   | INFO:     Uvicorn running on http://0.0.0.0:4000 (Press CTRL+C to quit)
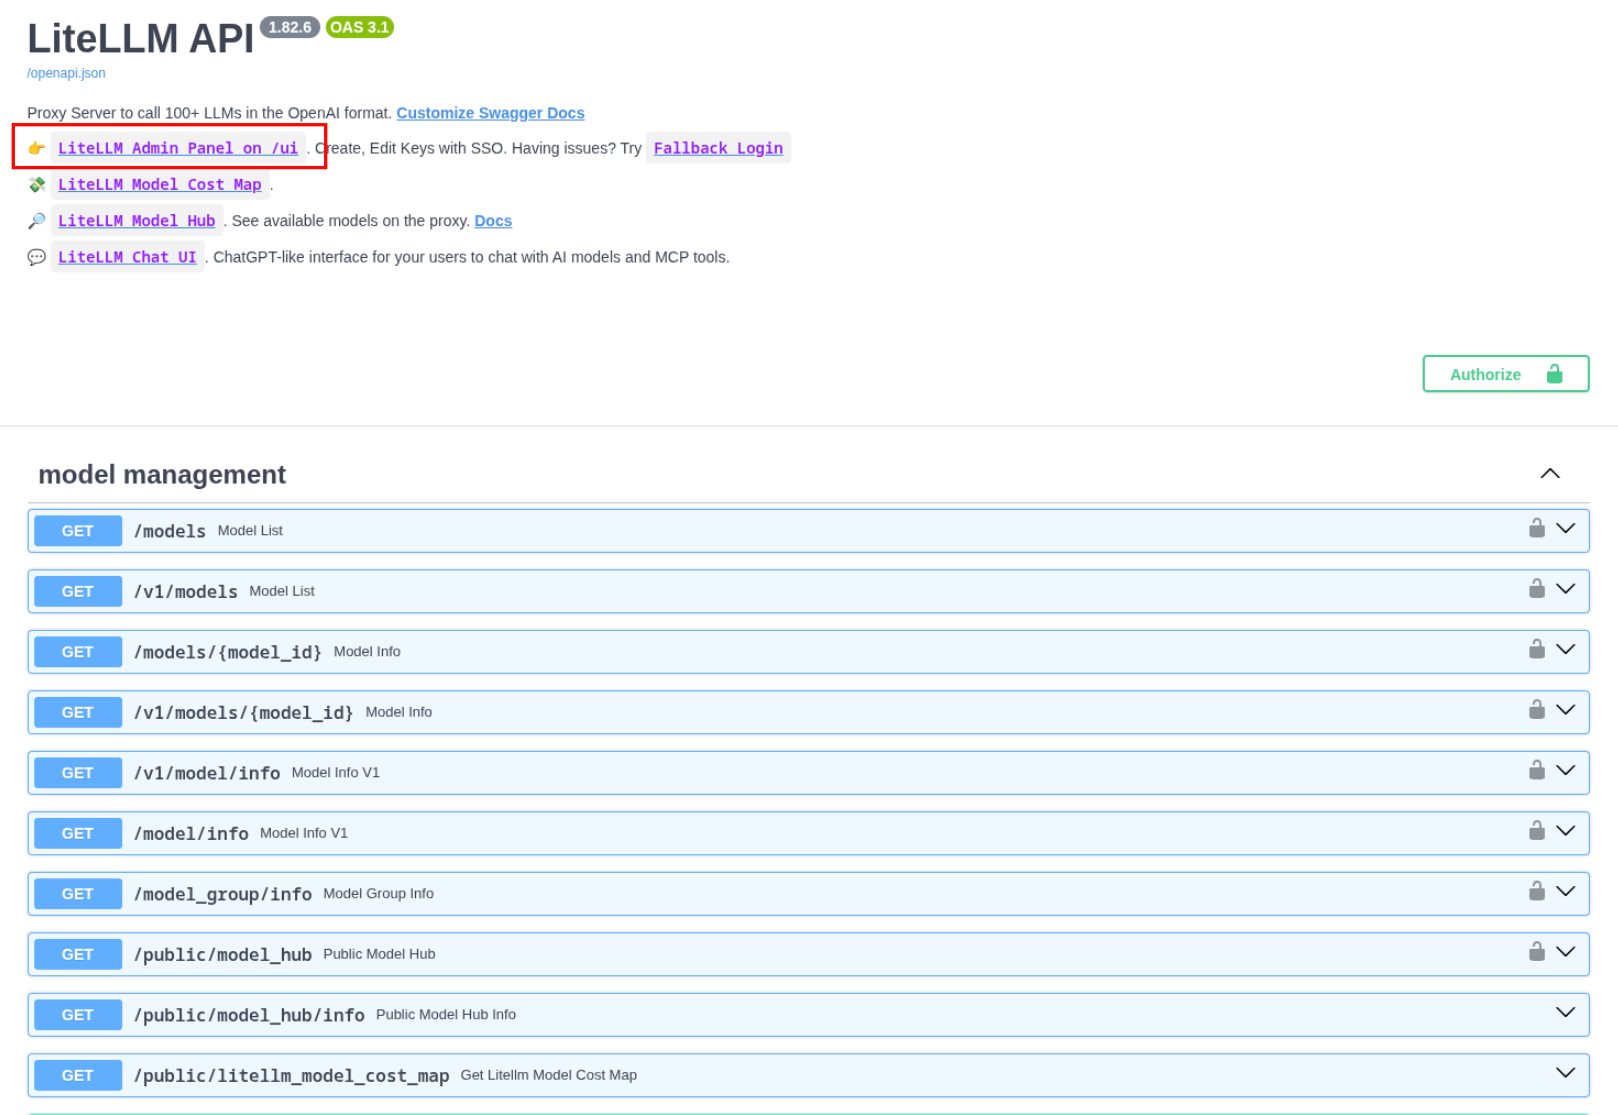
We go to http://0.0.0.0:4000 – here there’s a link to the Admin UI and the documentation for the LiteLLM API itself (the Swagger Docs can be disabled with NO_DOCS=true, see environment variables – Reference, but overall it’s worth a look – because the API has a ton of features):
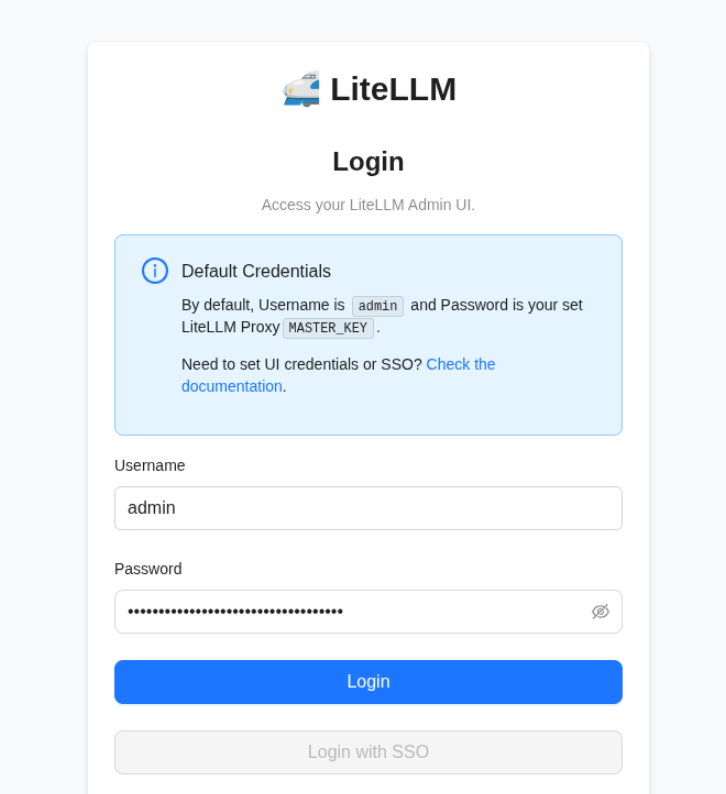
We log into the admin panel – the default login is “admin“, the password is $LITELLM_MASTER_KEY, which we created above:
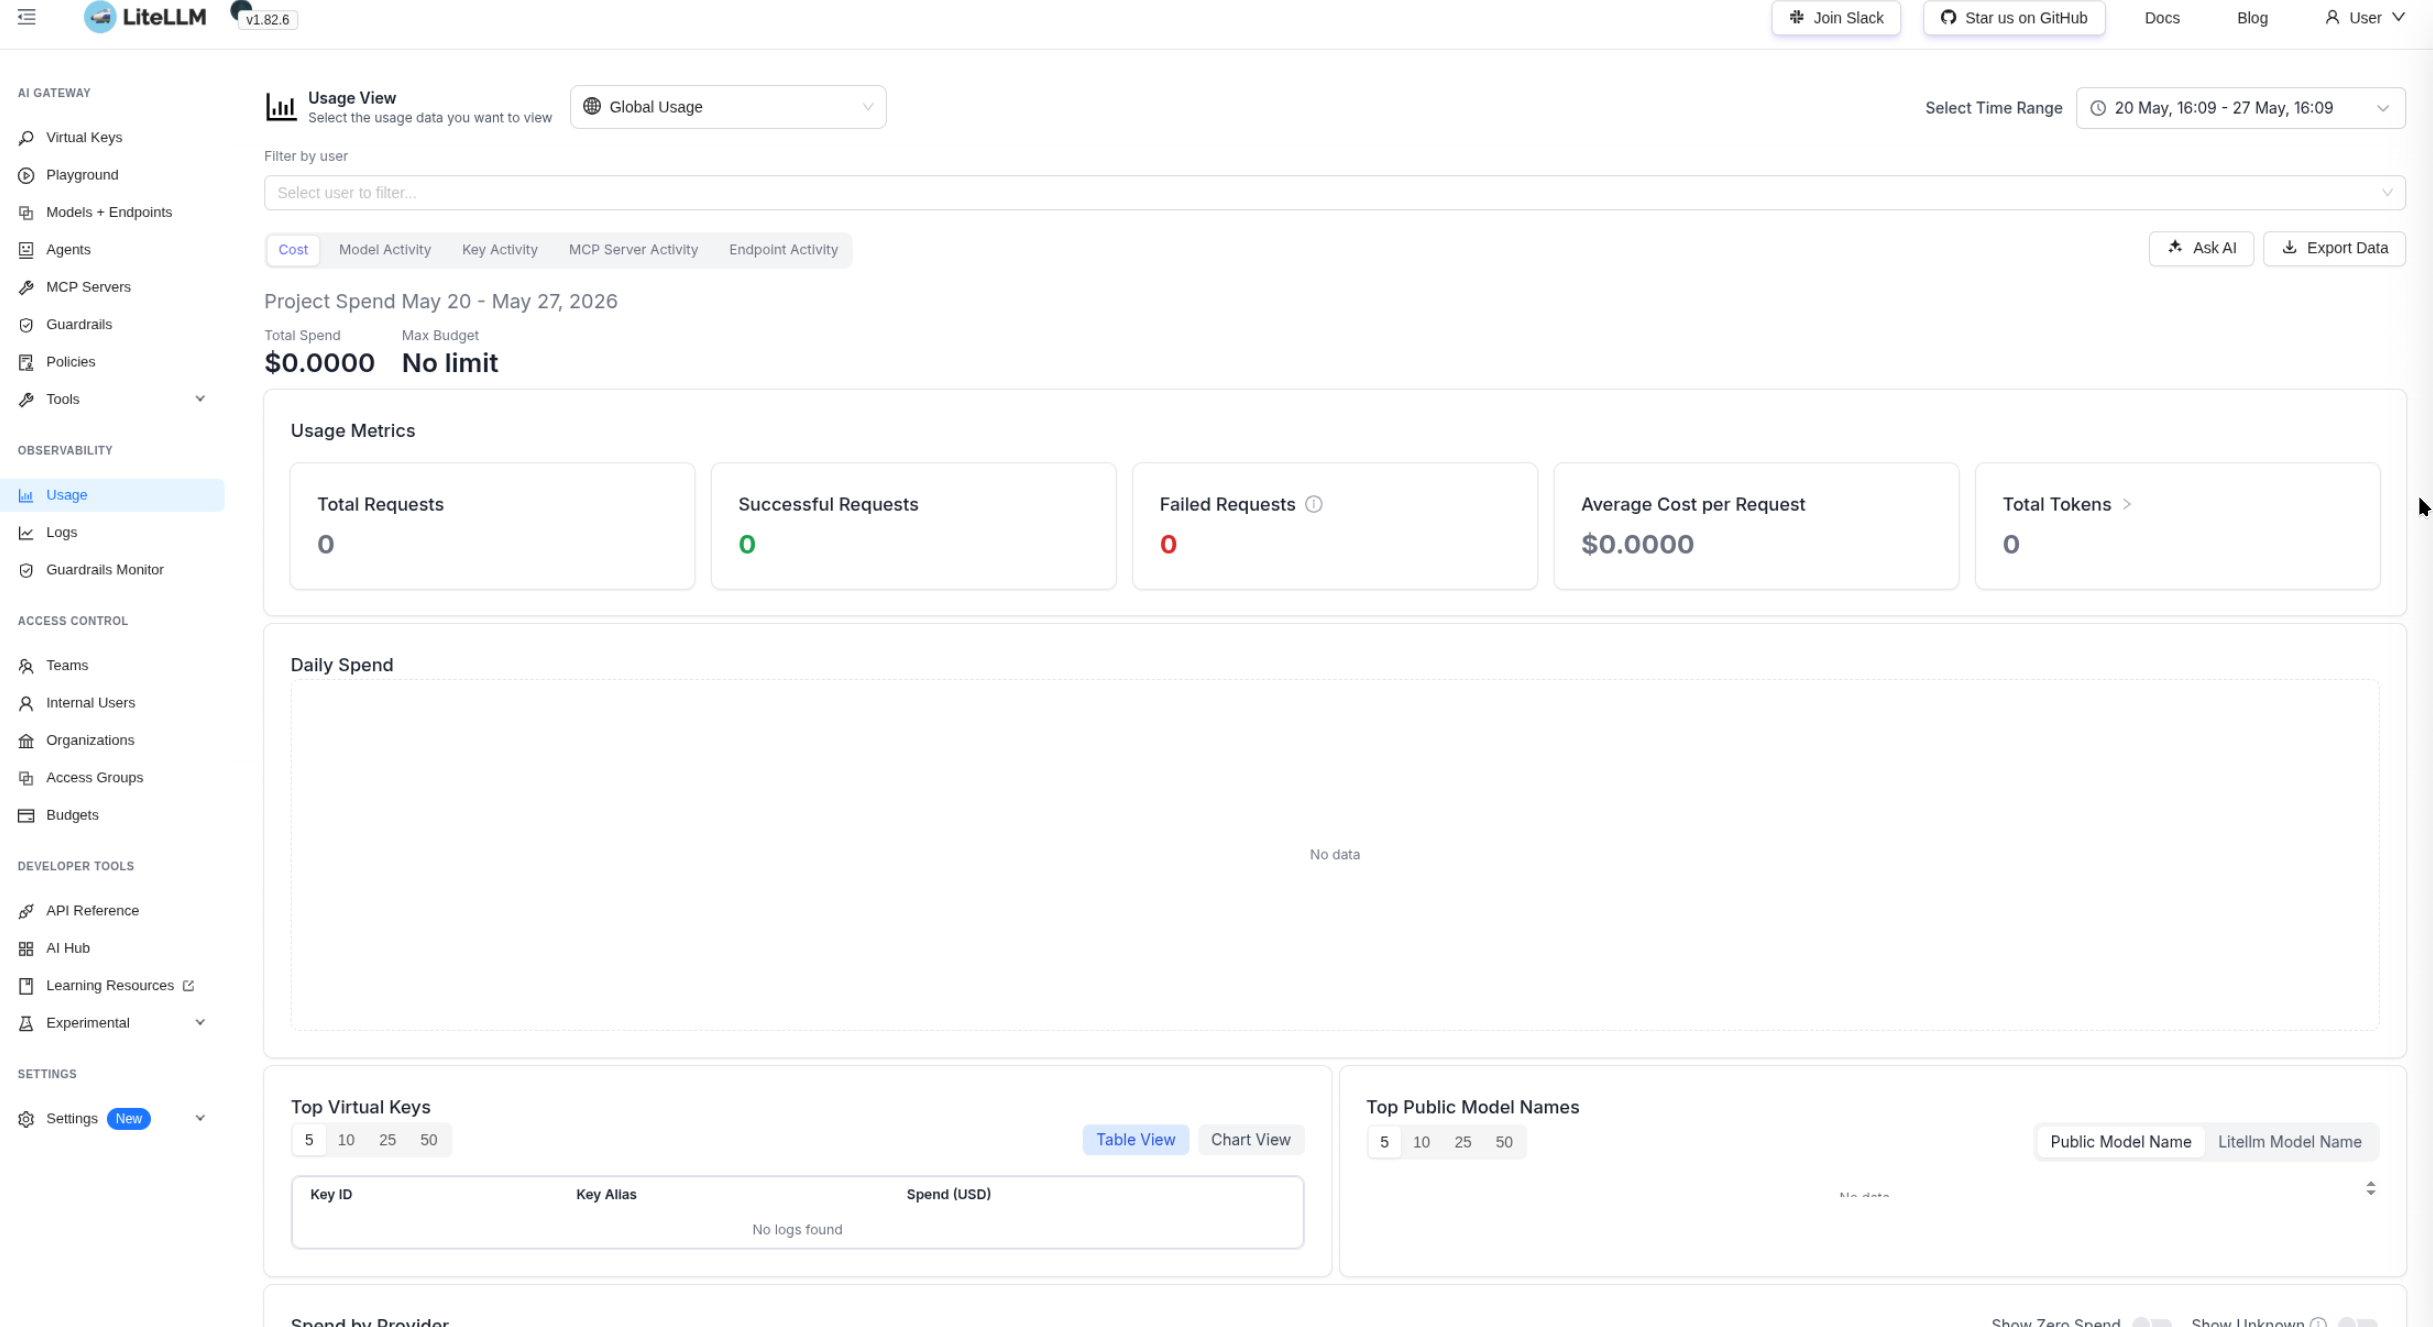
And we land in a really nice interface:
We already have metrics, but the endpoint is exactly /metrics/ – with a trailing slash (even though the documentation lists it as /metrics):
$ curl -s http://localhost:4000/metrics/
...
# HELP litellm_in_flight_requests Number of HTTP requests currently in-flight on this uvicorn worker
# TYPE litellm_in_flight_requests gauge
litellm_in_flight_requests 1.0
We’ll go through the various settings later – for now let’s create a “client” – a simple script that talks to OpenAI through LiteLLM.
Demo Python App – AI Client
We write a script that uses OpenAI and passes a single prompt:
#!/usr/bin/env python

import os
from openai import OpenAI

client = OpenAI(
    base_url="http://localhost:4000",
    api_key=os.getenv("LITELLM_MASTER_KEY"),
)

response = client.chat.completions.create(
    model="gpt-4o-mini",
    messages=[{"role": "user", "content": "Say hello in one sentence"}],
)

print(response.choices[0].message.content)
print(f"Tokens: {response.usage}")
Here:
base_urlfor OpenAI: instead of the default OpenAI endpoint api.openai.com we override it with our LiteLLM instance’s endpointmodel: the model name as we set it in the LiteLLM parameters –model_list.model_name
We install the dependencies:
$ python3 -m venv .venv
$ source .venv/bin/activate
$ pip install openai
We run the script:
$ ./demo-llm.py
Hello! How can I assist you today?
Tokens: CompletionUsage(completion_tokens=9, prompt_tokens=12, total_tokens=21, completion_tokens_details=CompletionTokensDetails(accepted_prediction_tokens=0, audio_tokens=0, reasoning_tokens=0, rejected_prediction_tokens=0), prompt_tokens_details=PromptTokensDetails(audio_tokens=0, cached_tokens=0))
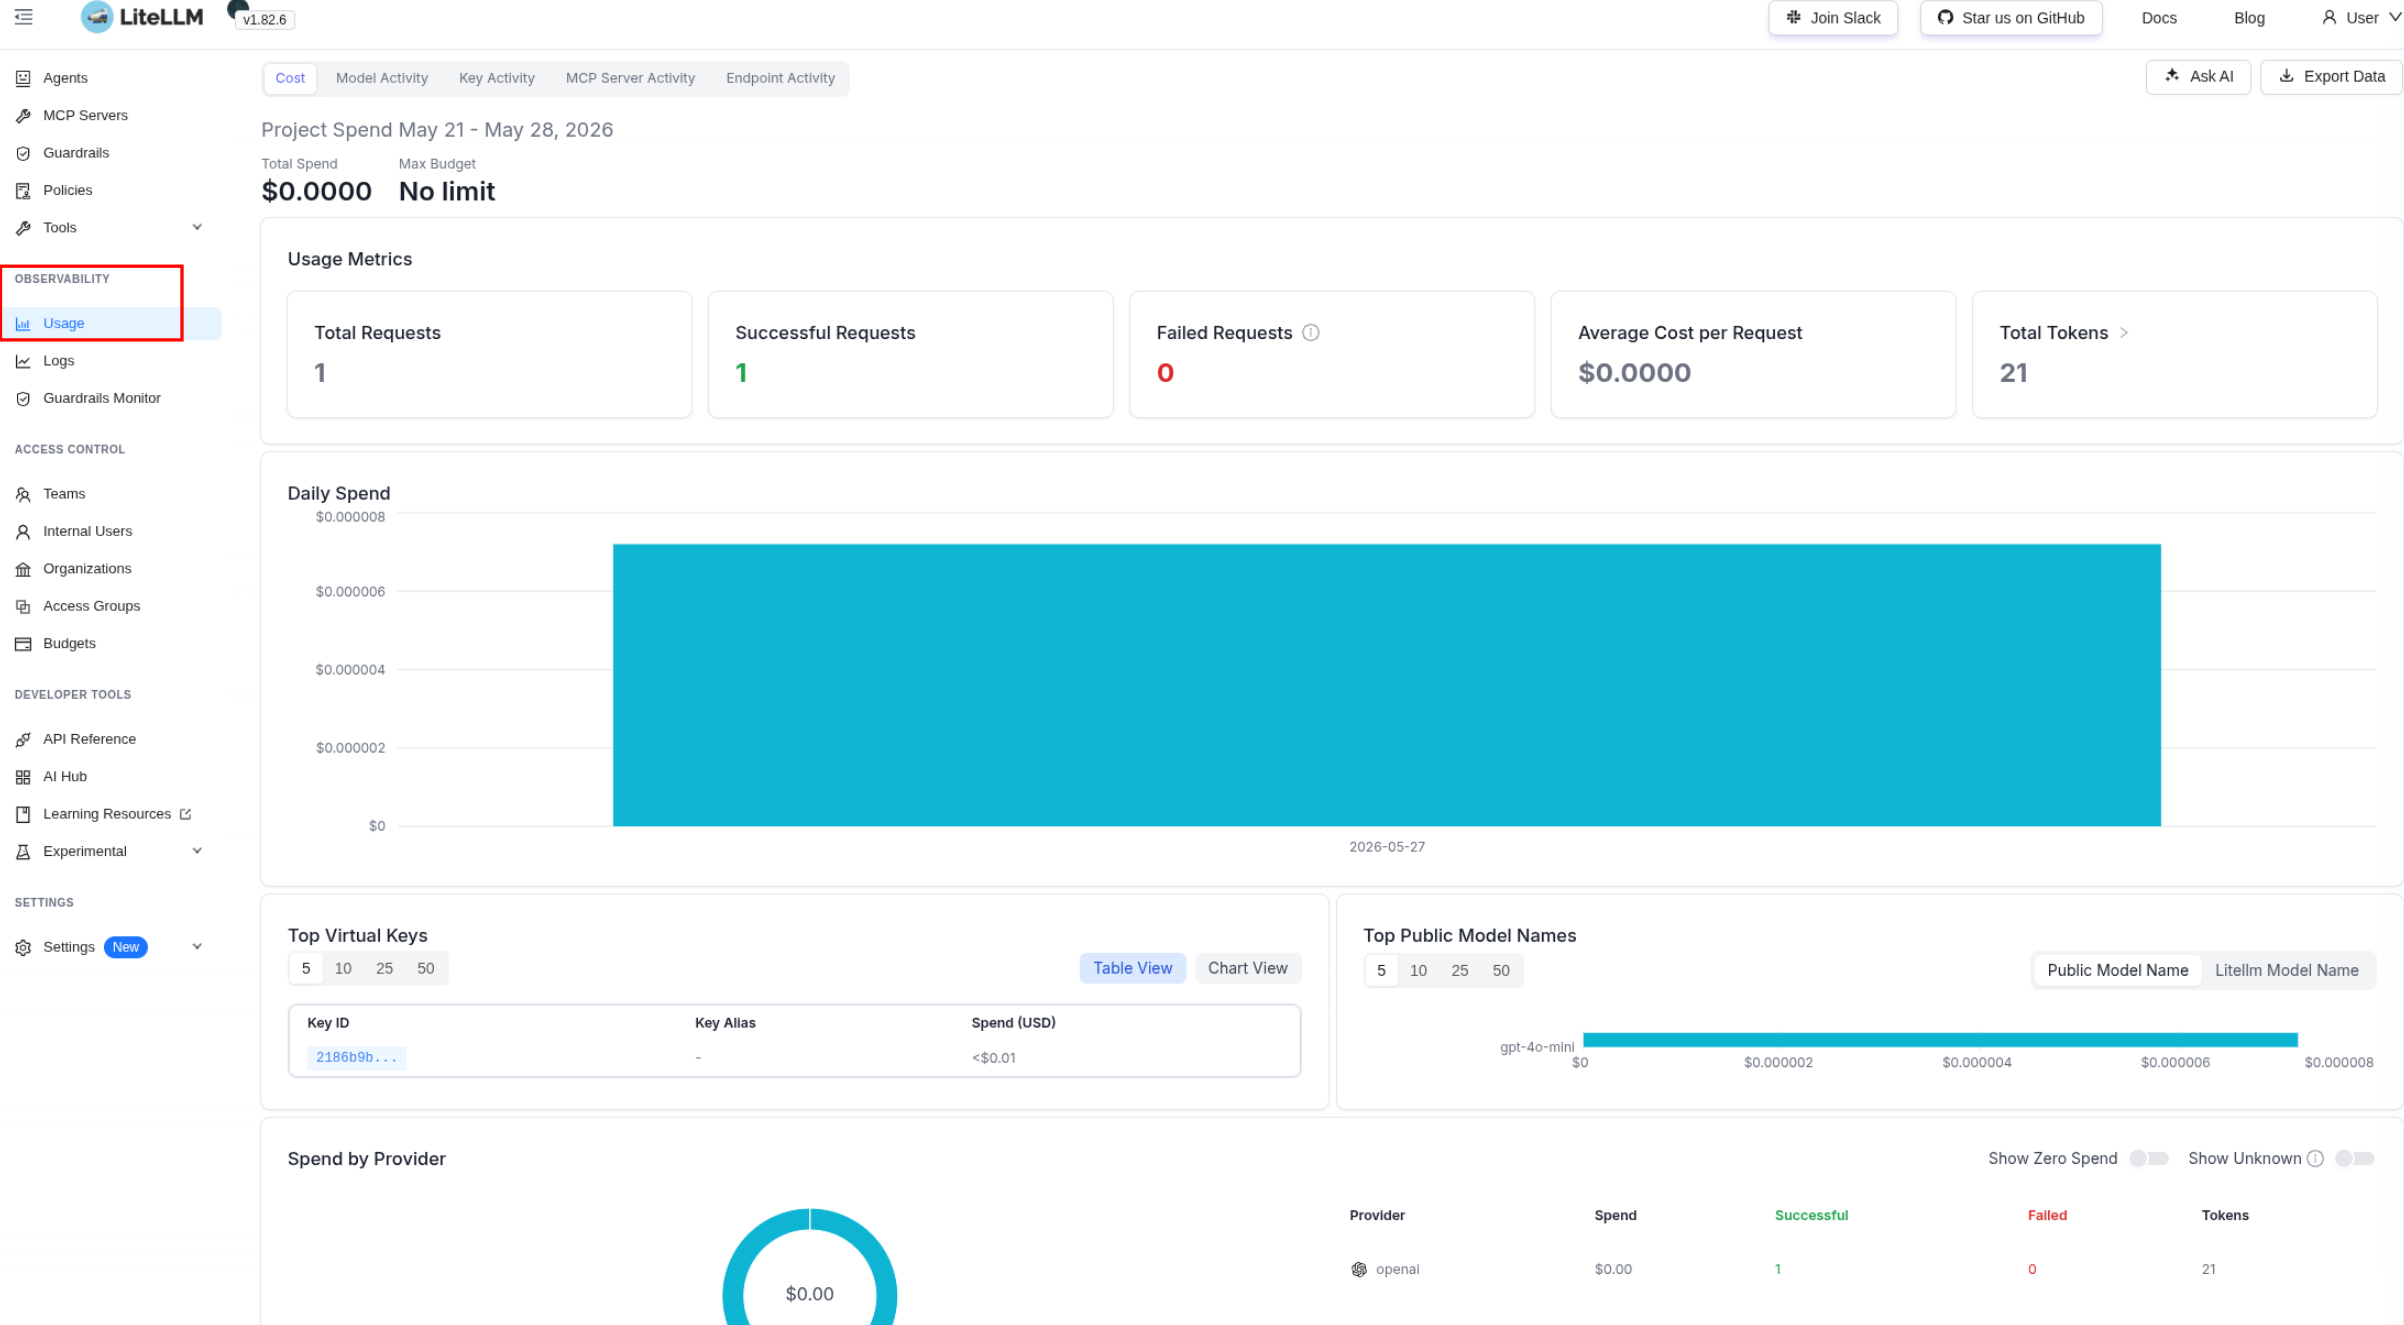
We go to the admin panel > Usage – and we already have data on the requests:
We look at the traces in Logs:
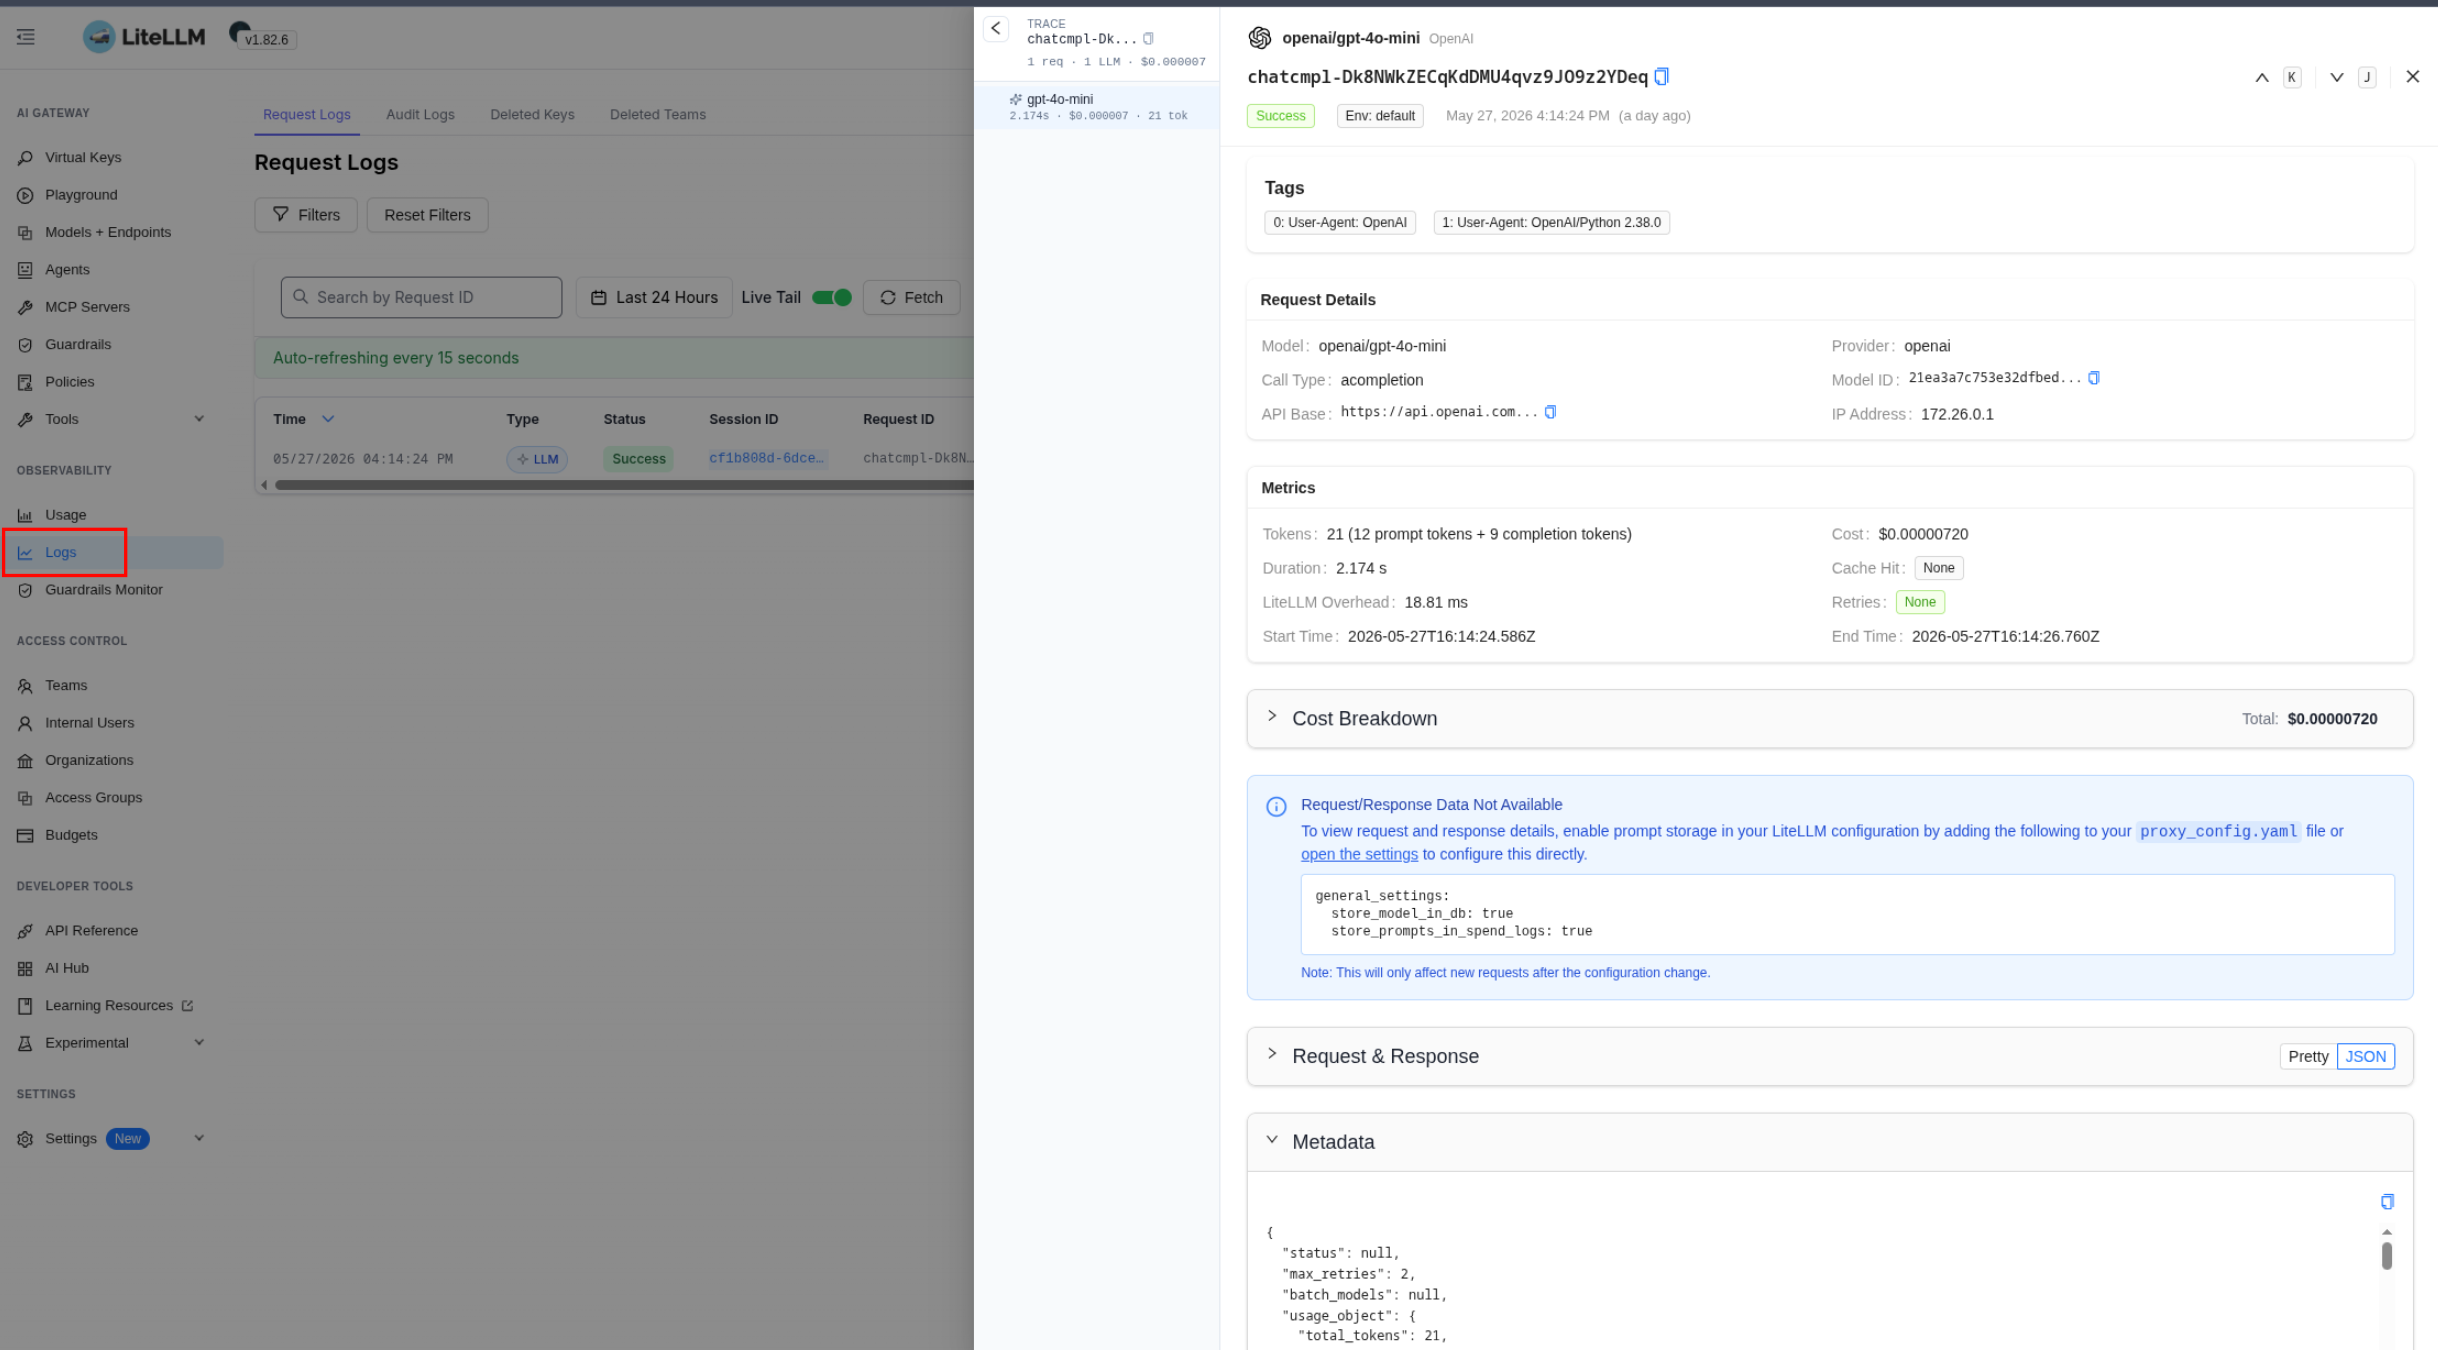
And the new metrics:
 $ curl -s http://localhost:4000/metrics/ | grep "# HELP lite"
# HELP litellm_in_flight_requests Number of HTTP requests currently in-flight on this uvicorn worker
# HELP litellm_proxy_failed_requests_metric_total Total number of failed responses from proxy - the client did not get a success response from litellm proxy
# HELP litellm_proxy_total_requests_metric_total Total number of requests made to the proxy server - track number of client side requests
# HELP litellm_proxy_total_requests_metric_created Total number of requests made to the proxy server - track number of client side requests
...
# HELP litellm_total_users Total number of users in LiteLLM
# HELP litellm_teams_count Total number of teams in LiteLLM
Now that we have LiteLLM itself and a client – we can look at the interesting things we can do with LiteLLM, and the first thing I personally care about is monitoring.
Monitoring, OpenTelemetry and Traces
We’ll collect metrics with VMAgent or the OTel Collector, the logs are just the output, which – if it’s in Kubernetes – we collect with Promtail, vlagent, the OTel filelog, whatever.
We’ll go over the interesting metrics later, but we won’t collect them today – because everything’s local in Docker right now, the documentation on all the available metrics is Prometheus metrics.
But we can take a look at how to write traces to VictoriaTraces.
Documentation – OpenTelemetry and OpenTelemetry – Tracing LLMs with any observability tool.
OpenTelemetry and VictoriaTraces
LiteLLM can write data using the OpenTelemetry Protocol. For VictoriaTraces we use the /insert/opentelemetry/v1/traces endpoint, see Data ingestion.
We open a local port to the VictoriaTraces instance in Kubernetes to get access from the Docker container with LiteLLM – we add --address=0.0.0.0:
$ kk port-forward svc/atlas-victoriametrics-vt-single-server 10428 --address=0.0.0.0
In docker-compose.yaml we add the extra_hosts parameter:
litellm:
  image: ghcr.io/berriai/litellm:main-latest
  ...
  extra_hosts:
    - "host.docker.internal:host-gateway"
In LiteLLM’s .env we add the variables for sending traces:
OTEL_EXPORTER_OTLP_TRACES_ENDPOINT=http://host.docker.internal:10428/insert/opentelemetry/v1/traces
OTEL_EXPORTER_OTLP_PROTOCOL=http/protobuf
You can set it via LiteLLM’s own variables – OTEL_EXPORTER and OTEL_ENDPOINT:
OTEL_ENDPOINT=http://host.docker.internal:10428/insert/opentelemetry/v1/traces
OTEL_EXPORTER=otlp_http
A bit of a mess in the documentation (though the documentation is great overall) – but both options work. See also Exporter & resource.
In the litellm_config.yaml config we add “otel” to callbacks – turning on trace sending:
...
litellm_settings:
  callbacks:
  - prometheus
  - otel
Instead of, or in addition to, “otel” you can specify “langfuse” or “arize” for Phoenix (see Arize Phoenix: an LLM monitoring service – running it in Kubernetes) – then the traces will be sent to several services at once – tested it, works, handy, neat.
We restart the containers, and in the logs we should see that the exporters are active:
...
 11:31:57 - LiteLLM Proxy:DEBUG: callback_utils.py:34 - initializing callbacks=['prometheus', 'otel'] on proxy
...
litellm-1 | self.OTEL_EXPORTER: otlp_http
litellm-1 | self.OTEL_ENDPOINT: http://host.docker.internal:10428/insert/opentelemetry/v1/traces
litellm-1 | self.OTEL_HEADERS: None
...
We check that the environment variables from .env were applied – on the first run I had to debug a bit:
$ docker compose exec litellm env | grep OTEL
OTEL_EXPORTER_OTLP_TRACES_ENDPOINT=http://host.docker.internal:10428/insert/opentelemetry/v1/traces
OTEL_EXPORTER_OTLP_PROTOCOL=http/protobuf
We run our client script one more time:
$ ./demo-llm.py
Hello! How can I assist you today?
Tokens: CompletionUsage(completion_tokens=9, prompt_tokens=12, total_tokens=21, completion_tokens_details=CompletionTokensDetails(accepted_prediction_tokens=0, audio_tokens=0, reasoning_tokens=0, rejected_prediction_tokens=0), prompt_tokens_details=PromptTokensDetails(audio_tokens=0, cached_tokens=0))
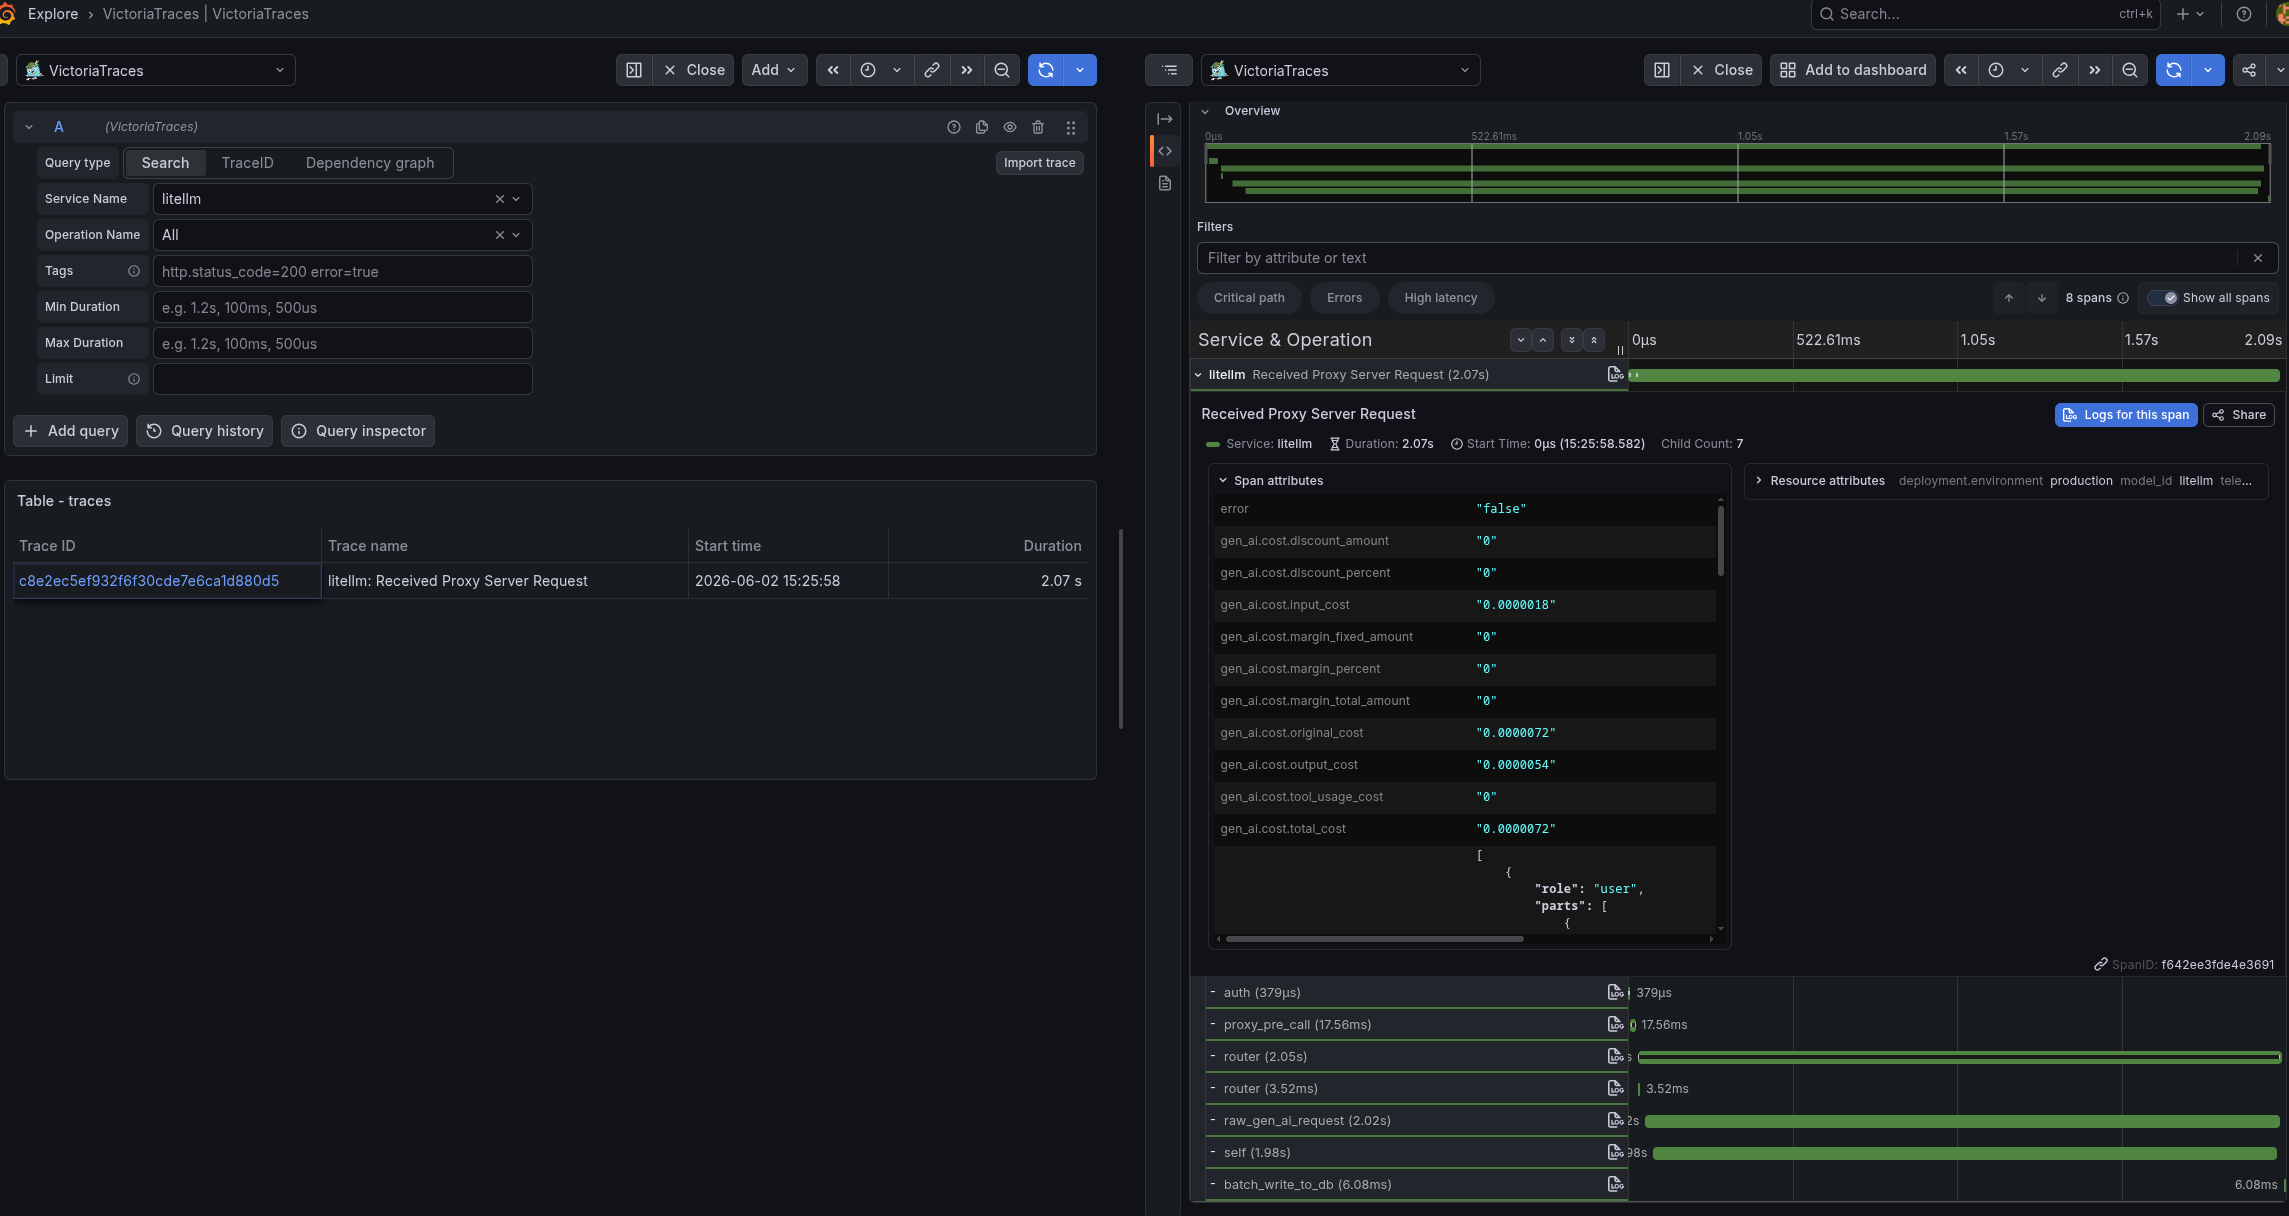
And in VictoriaTraces we search for spans by {"resource_attr:service.name"="litellm"}:
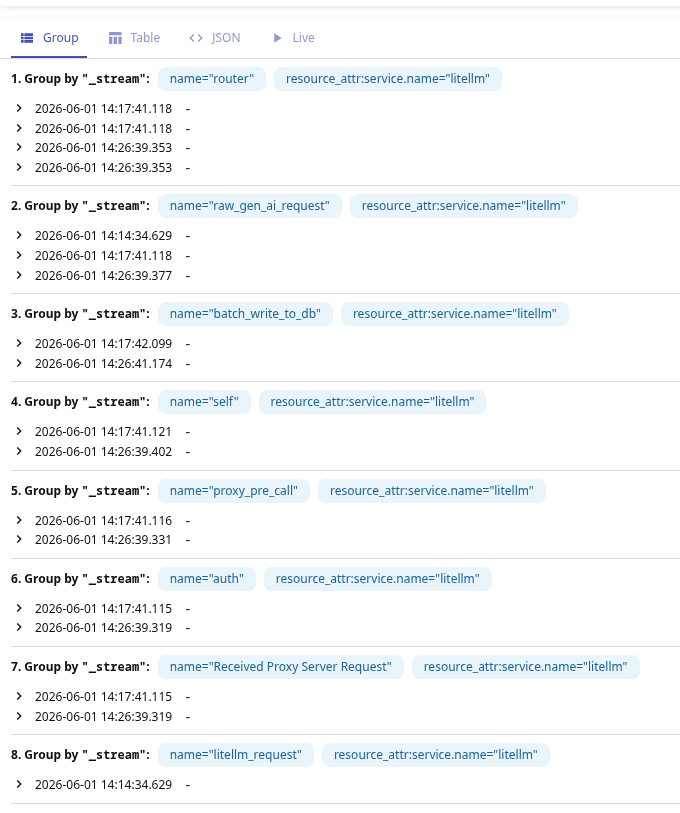
Or straight in Grafana with grouping:
LiteLLM Span Attributes
There are really a lot of attributes – we just get everything right away, without any instrumentation in the code.
Our “root” span will be “Received Proxy Server Request“, see Span Hierarchy and Span name reference.
See also the OpenTelemetry documentation itself Semantic conventions for generative client AI spans – span and attribute names.
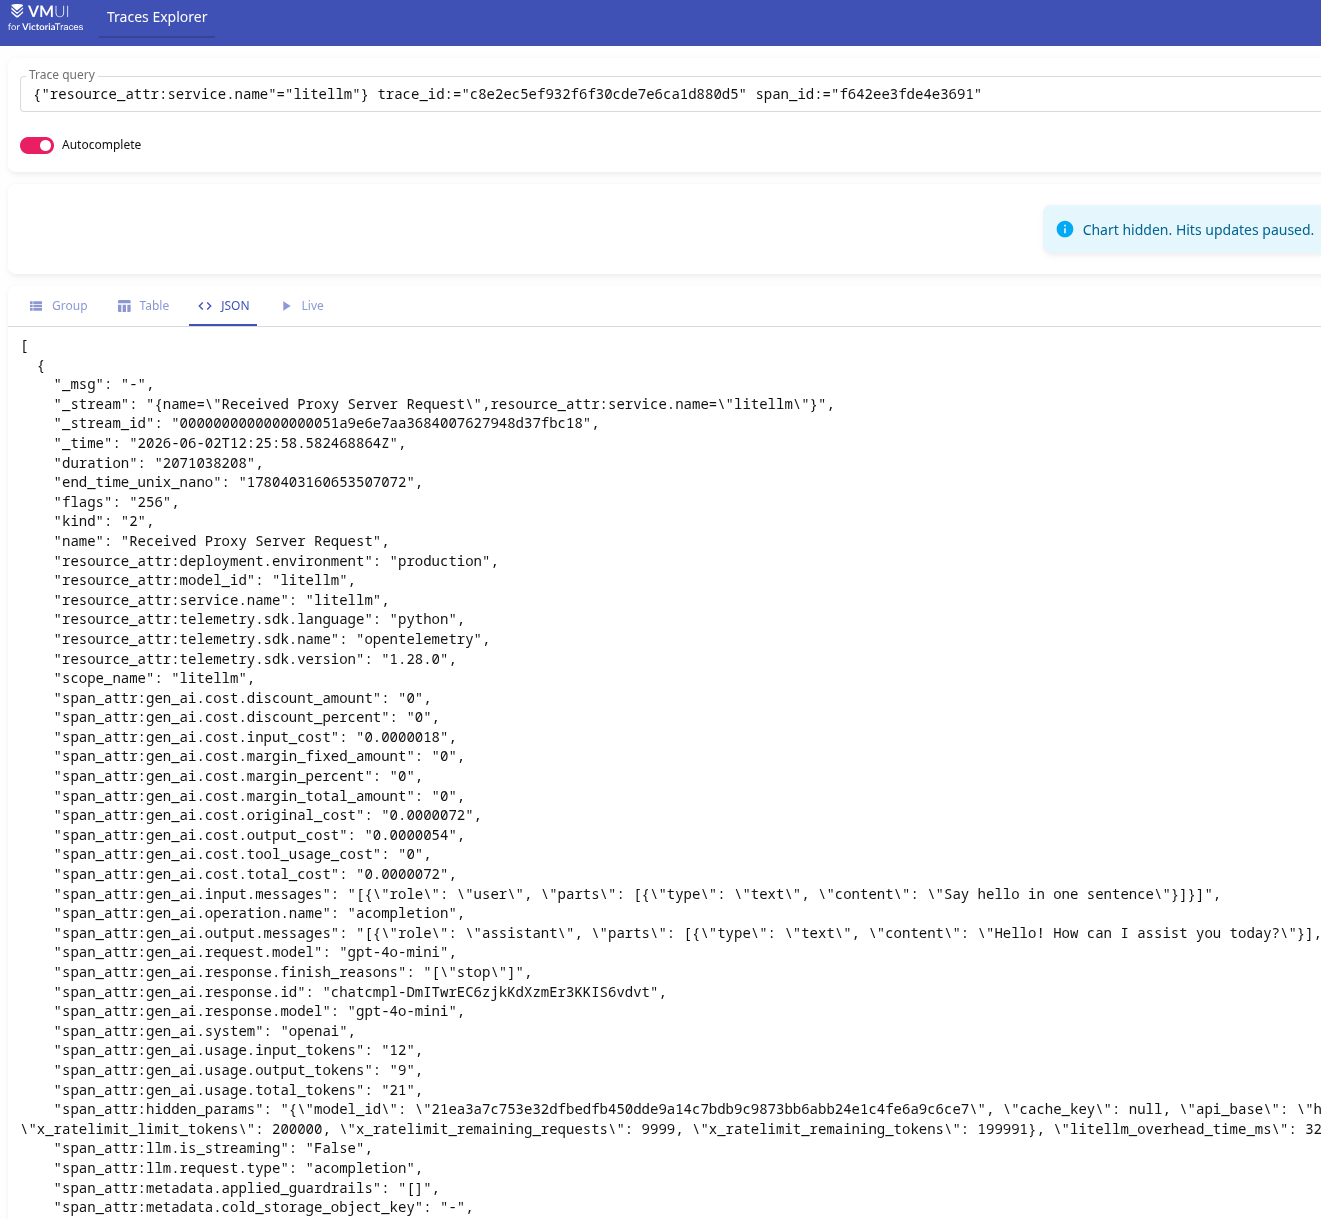
It’s easier to look at all the attributes together right in VictoriaTraces:
You can also include LiteLLM’s spans as children of the client’s spans, if tracing is configured there – see Context propagation (W3C traceparent).
For all the attributes see the Attributes Reference, here’s a brief rundown of the main ones that might be interesting later for monitoring.
Costs – you can build charts of spend by model, user, team:
gen_ai.cost.total_cost: how much money was spent processing the requestgen_ai.cost.input_cost/gen_ai.cost.output_cost: a breakdown of the cost by input/output tokens
Tokens Usage:
gen_ai.usage.input_tokens/output_tokens/total_tokens
Execution time – request processing time:
duration: the total processing timehidden_params=>litellm_overhead_time_ms: how much time the proxy itself took
Model and provider:
gen_ai.request.model: which model was used in the requestgen_ai.response.model: which model actually responded (may differ, for example – if a fallback kicked in)gen_ai.system: the provider
User data:
metadata.user_api_key_hash: which key was usedmetadata.user_api_key_user_id/team_id: who made the request – a specific user or a groupmetadata.requester_ip_address: the client’s address
Rate limits from the provider (in hidden_params), see Rate Limit Headers:
x_ratelimit_remaining_requests: how many requests are left before the provider starts returning a 429 – Too Many Requests errorx_ratelimit_remaining_tokens: the same, but for tokens
Content (may contain sensitive data, can be disabled, see Redacting Messages, Response Content and Capturing Message Content):
gen_ai.input.messages: the prompt itselfgen_ai.output.messages: the model’s response
Request status:
status_code: 1 – OK (2 = ERROR)gen_ai.response.finish_reasons: why the generation stopped
Access Management
The core concept – we can have different Organizations (but that’s an Enterprise feature), each Organization can contain several Teams, in each Team we keep Users, and each User can create their own API Keys – see User Management Hierarchy.
Users log into the Web UI or the API, and we use API Keys for services.
Authentication and access
The main method is API Keys for services or users that work with LiteLLM through the API – and there are regular passwords for users who use the Web UI.
There’s support for authentication with JWT – but that’s an Enterprise feature.
Out of the box we have SSO – “SSO is now Free for up to 5 users“, more users only in Enterprise, see SSO for Admin UI.
There’s even support for User Provisioning with SCIM (see Okta: integration with Google Workspaces, part 1 – Provisioning) – but here too it’s Premium.
That said, we can automate this with litellm-operator – maybe I’ll give it a try, but I’m not sure, since the operator is unofficial.
And a really neat thing – IP restrictions, see IP Address Filtering – but again an Enterprise feature 🙁
So, of the Free options we’re left with just Teams, users and API Keys.
Teams and Users
For each Team you can configure which models from model_list that group’s users and keys will have access to, the maximum Costs budget the group can spend per day/week/month, and you can set limits on Tokens per minute Limit (TPM) and Requests per minute Limit (RPM) – see Budgets, Rate Limits and Setting Team Budgets.
Besides that, there are Access Groups – we group lists of models, MCP or agents into a single list that can then be attached to Teams or Users.
And in monitoring, as we saw above, we have attributes with group and user names – so later we can build charts and alerts based on them.
Besides regular users, we can have Service Accounts.
Budgets and limits
Budgets and Tokens/Requests Per Minute limits can be set at the level of the whole Gateway, at the Team level, for each user in that Team, or on individual users outside a Team or on specific API Keys.
But here there’s one thing that’s a bit odd, in my view:
- Team Limits only apply to the API Keys that were explicitly created by a user or admin for that group (they have a
team_id) - meanwhile a User with a Global Proxy Role == Internal User (Create/Delete/View) can create their own keys (not tied to a Team), not set any limits on them – and happily spam the LLM with requests
- the only restriction we can set in the Web UI when creating a new user is which models will be available to them (although the API docs for
/user/newhavemax_budget,rpm_limitandtpm_limitparameters – there’ll be an example below)
That is, on one hand – there’s supposedly a User who’s a member of a Team, and in the Team we set, say, a Team Member RPM Limit – but at the same time this user can create keys that this limit doesn’t affect at all.
And the only restriction we can set when creating a user in the Web UI is which models will be available to them – although through the config file you can also set upperbound_key_generate_params, see All Settings for Self Serve.
It looks like the UI just doesn’t have all the options yet that are available in the API.
In general, I’ll probably need to write a separate post on the topic of access and limits, because here “it’s not all that clear-cut”.
RBAC and System Roles
Pretty simple (at least for now, in version v1.82.6), with a few default roles – but there’s RBAC.
The roles are split into three main groups:
- global ones for all of LiteLLM –
adminandadmin_read_only - user roles –
useranduser_read_only - Organization and Team Roles – org/team admin
See User Roles and Available Roles.
Alright, let’s look at how all this works in practice: we’ll create a Team with a budget and Requests per minute limits, then add a user to that group, create an API Key for the user – and use it in our Demo App.
Creating a Team
We go to Teams > Create Team:
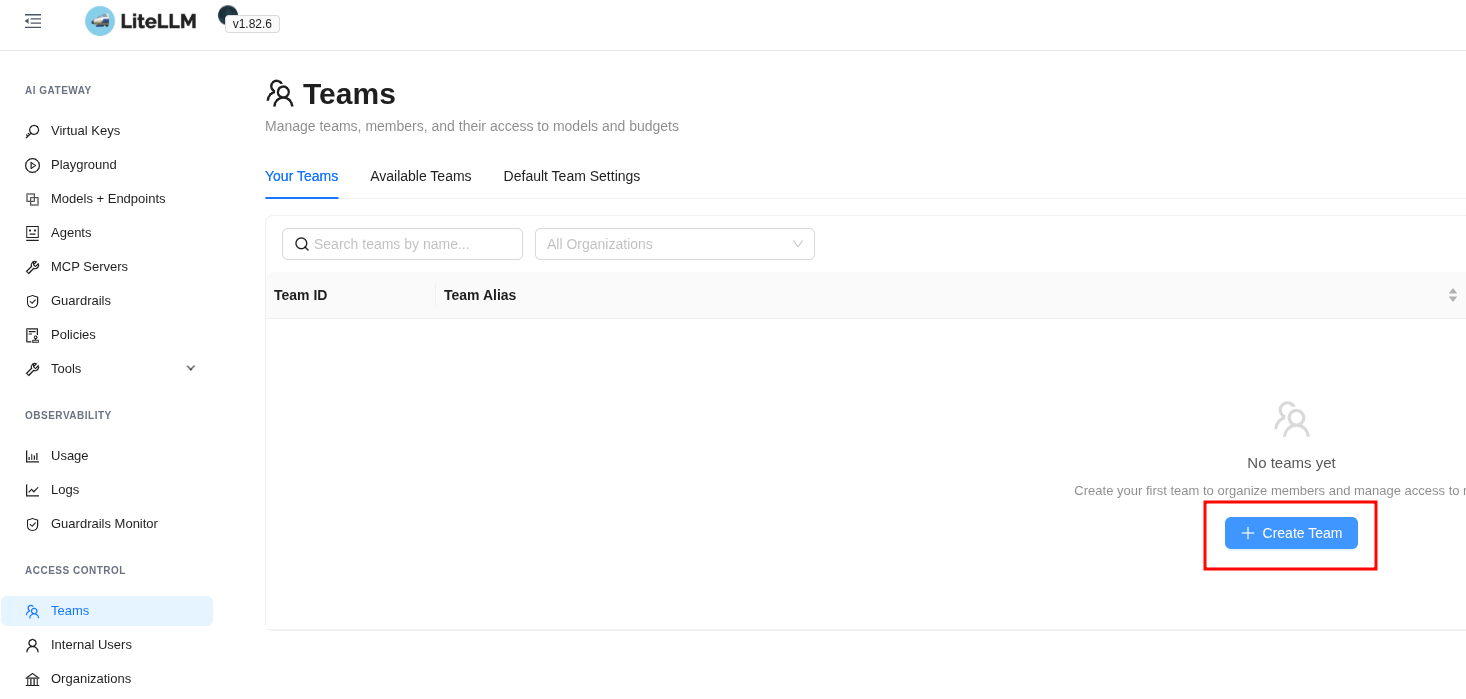
We create the group:
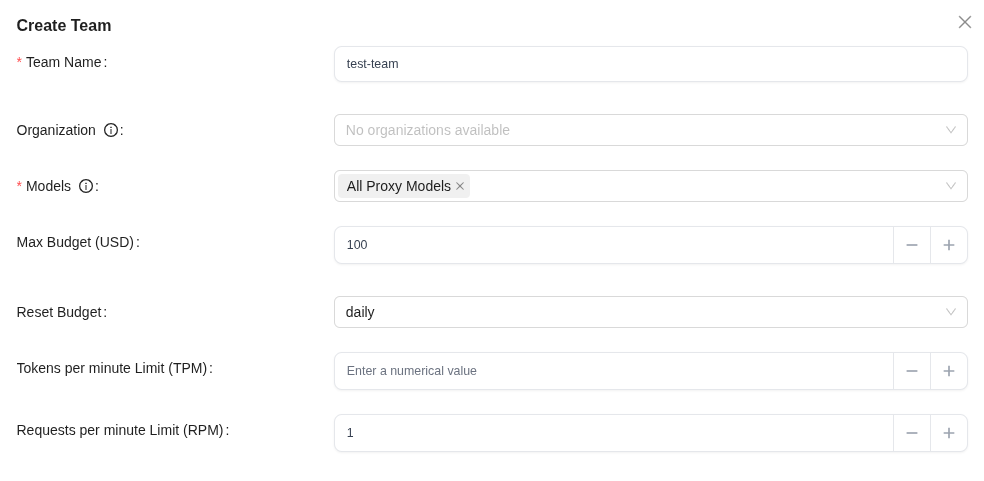
Here we grant access to all models, set a total group budget of 100 dollars per day (Reset Budget: daily), and to test things we set a hard limit of 1 request per minute.
Budgets and limits in a Team are set on two “levels” – the group itself and all the users in it, and separately for each user (more precisely – their keys created in this group – see below), that is:
- Max Budget (USD): this is the budget for everyone together, while Team Member Budget (USD) – is for each user in the group
- Requests per minute Limit (RPM): for the whole Team, while Team Member RPM Limit – is for each user in the group
Budgets are created as separate objects, available under Budgets:
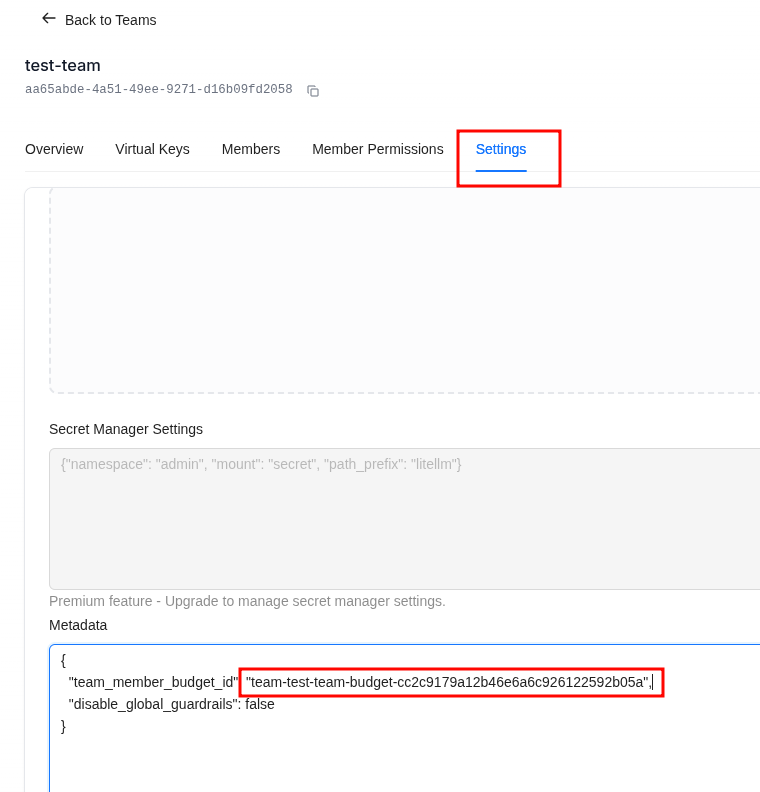
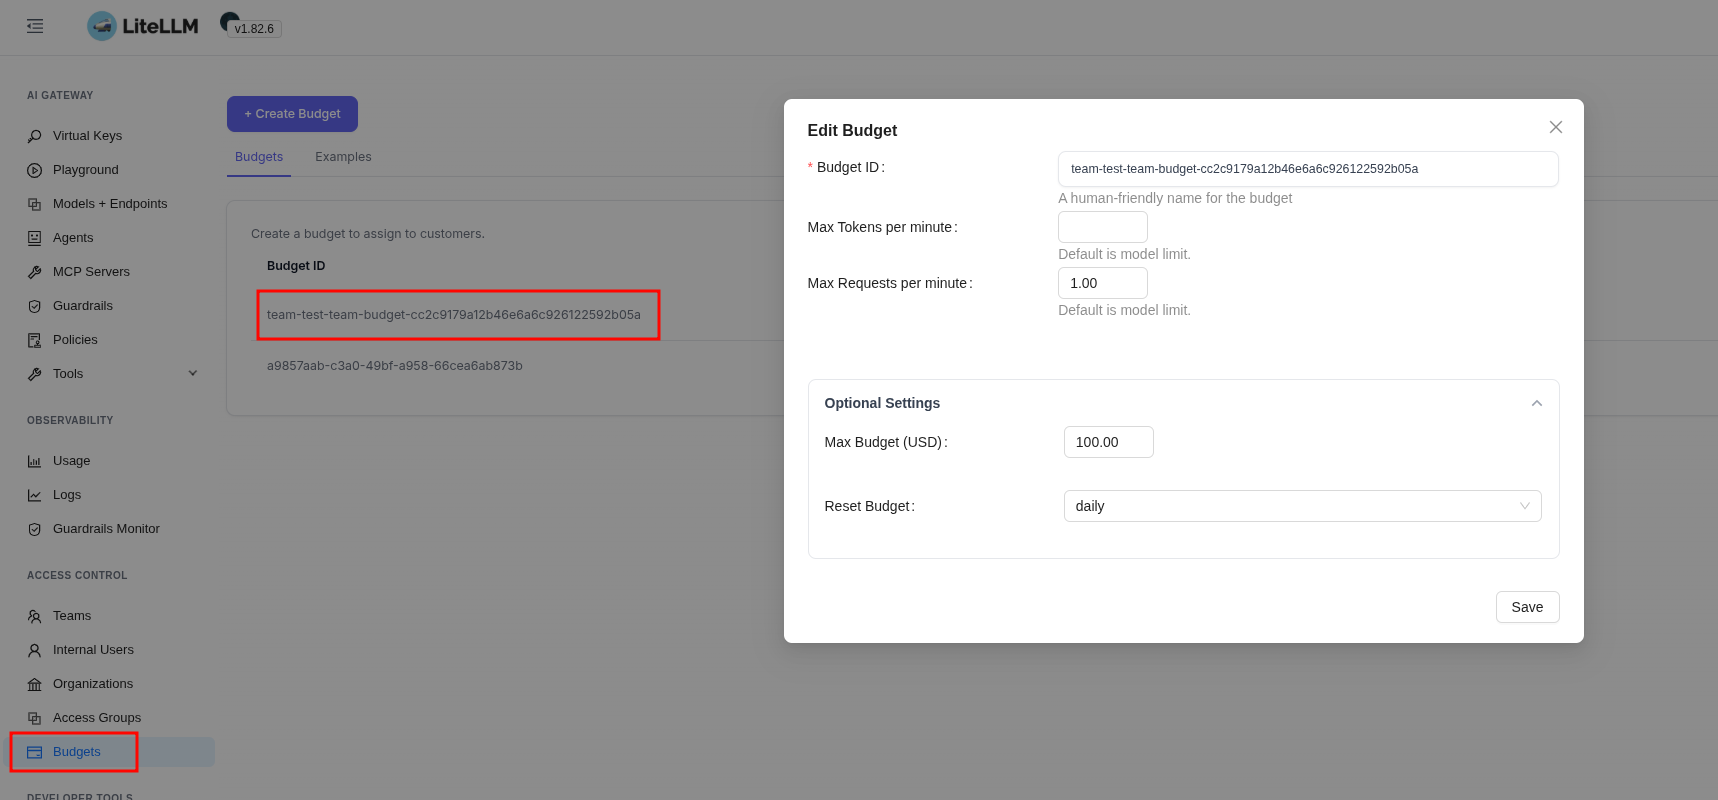
And here I caught yet another thing, either a bug or a feature, that after changing the values in Team Budget the budget values for the user didn’t change until I did it by hand right in Budgets.
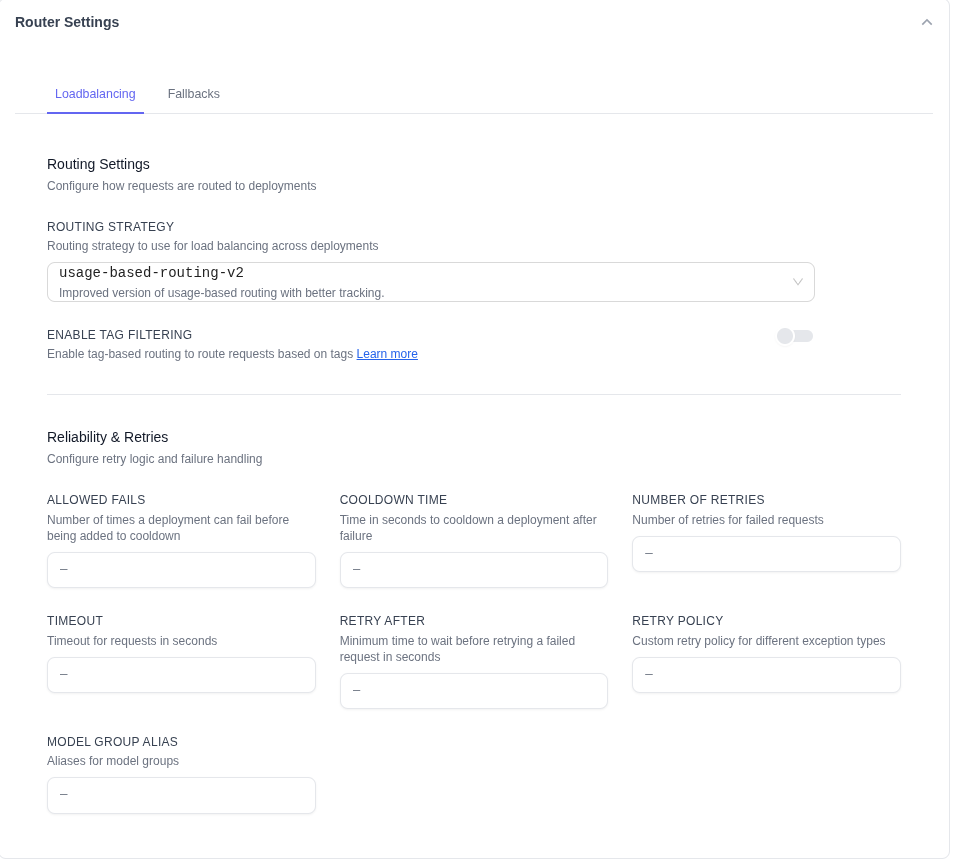
Lower down in the new Team’s parameters, under Router Settings, you can configure your own parameters for Load Balancing and Fallbacks:
Creating a User in the Web UI
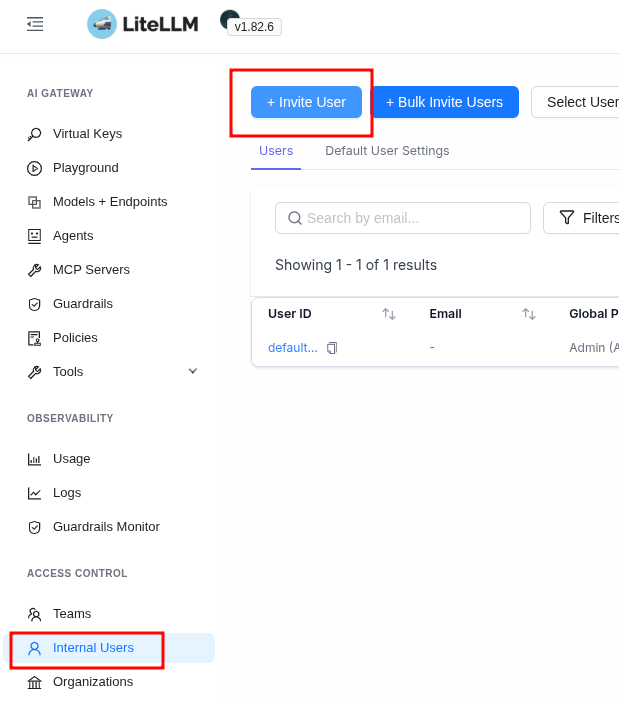
Users in the UI are created via an Invite that’s sent to an email – so you need to have SMTP, but after creating the Invite we’ll be shown a link we can register with.
We click Invite User:
We assign a role with rights to create keys, pick the group we created above, in Personal Key Creation you can restrict access to models – and that’s, in fact, the only restriction we can set for the user here:
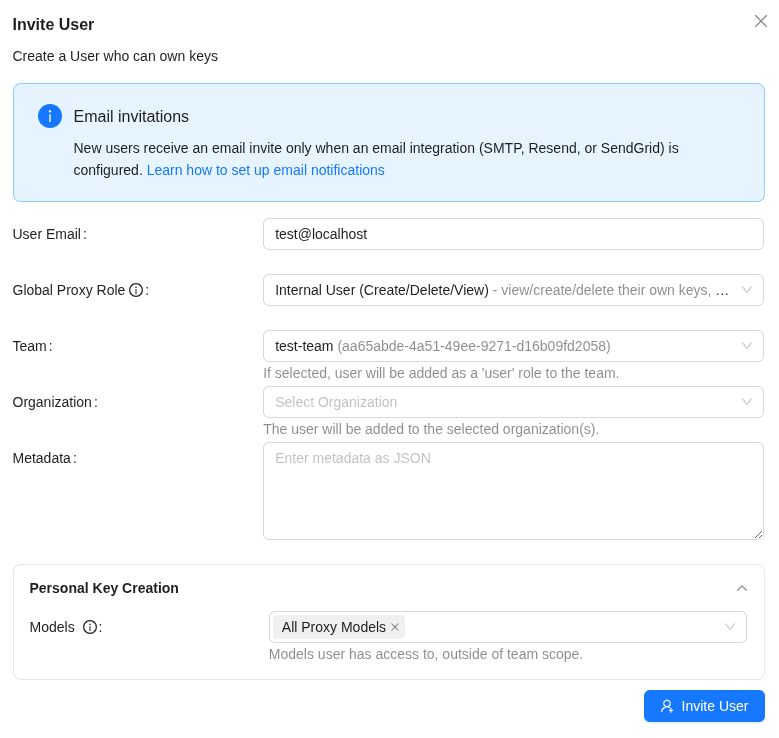
What’s more: while creating a user in a Team – you can’t assign them a Team Role right away, and they’ll be created with the default User role – but that can be changed later.
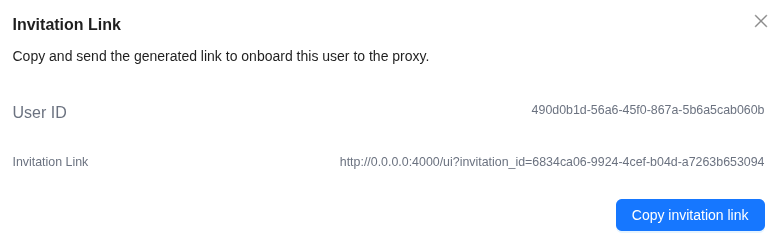
We click Invite User – and get the link that was sent to the email:
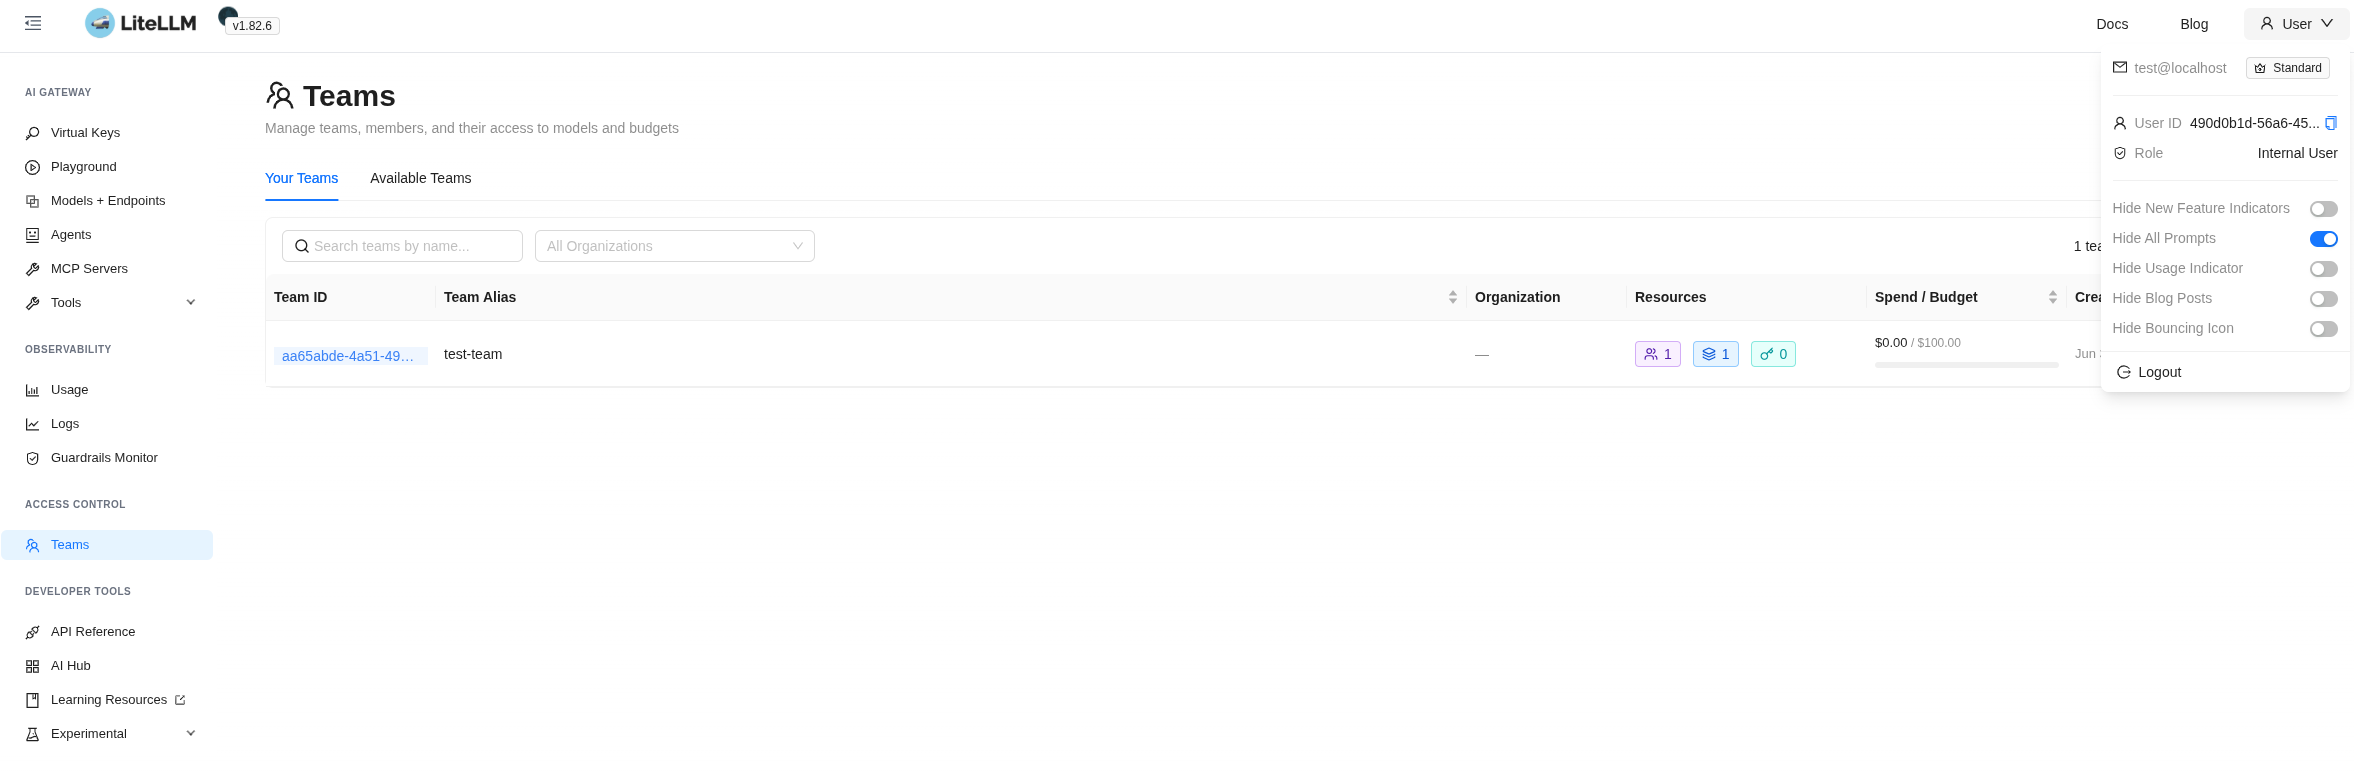
We open it in Incognito, set the new user’s password, and land in the Web UI – but here, of course, there’s a lot less access:
 Team Permissions
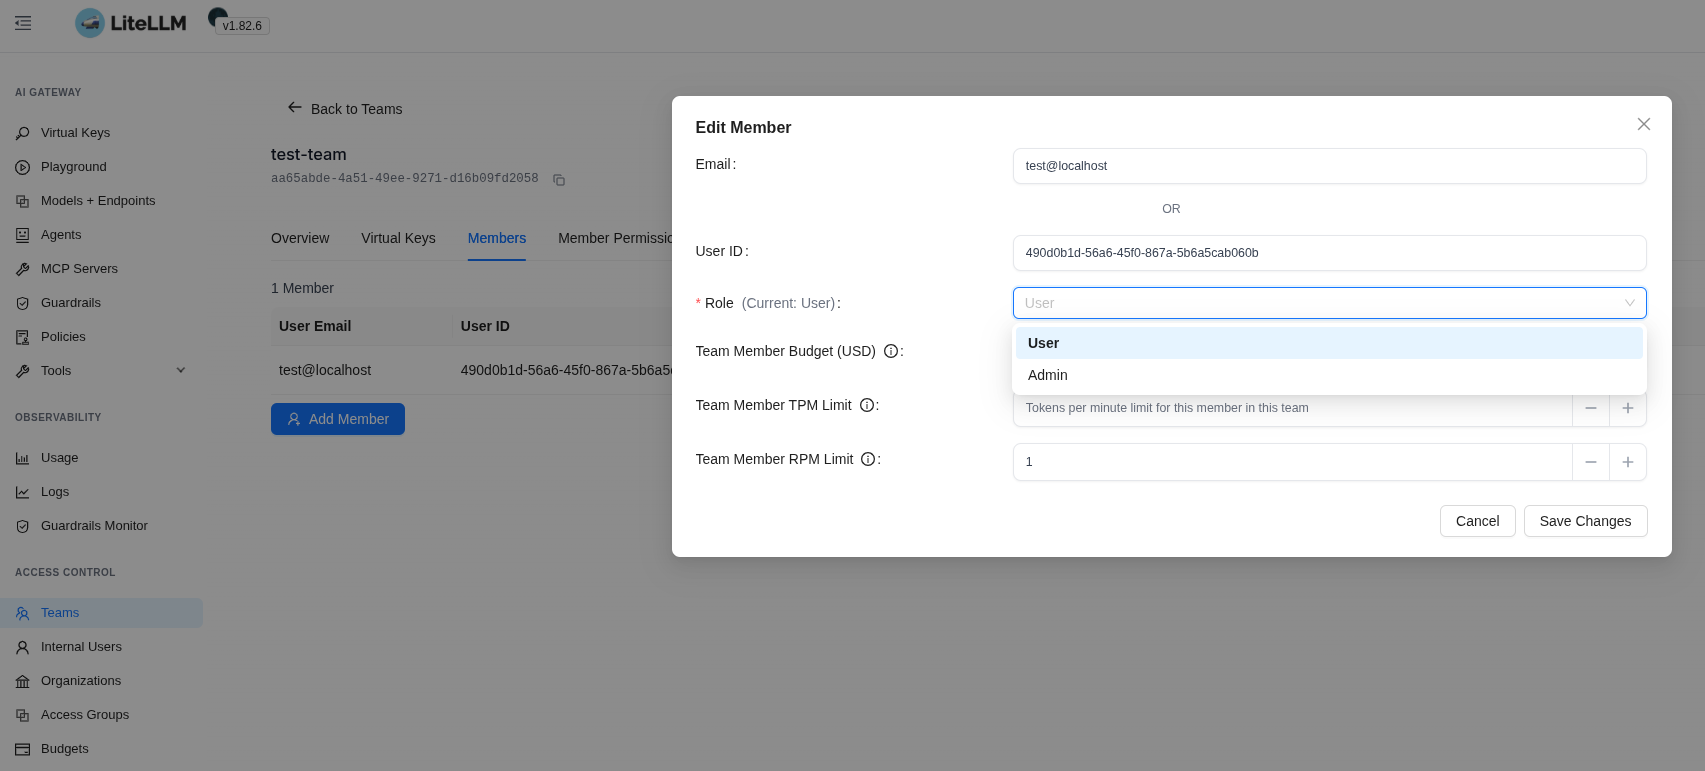
Already after the invite we can change the user’s role in this group – because without the Admin role they won’t be able to create keys in the group, or even set their own Member Limits/Budget:
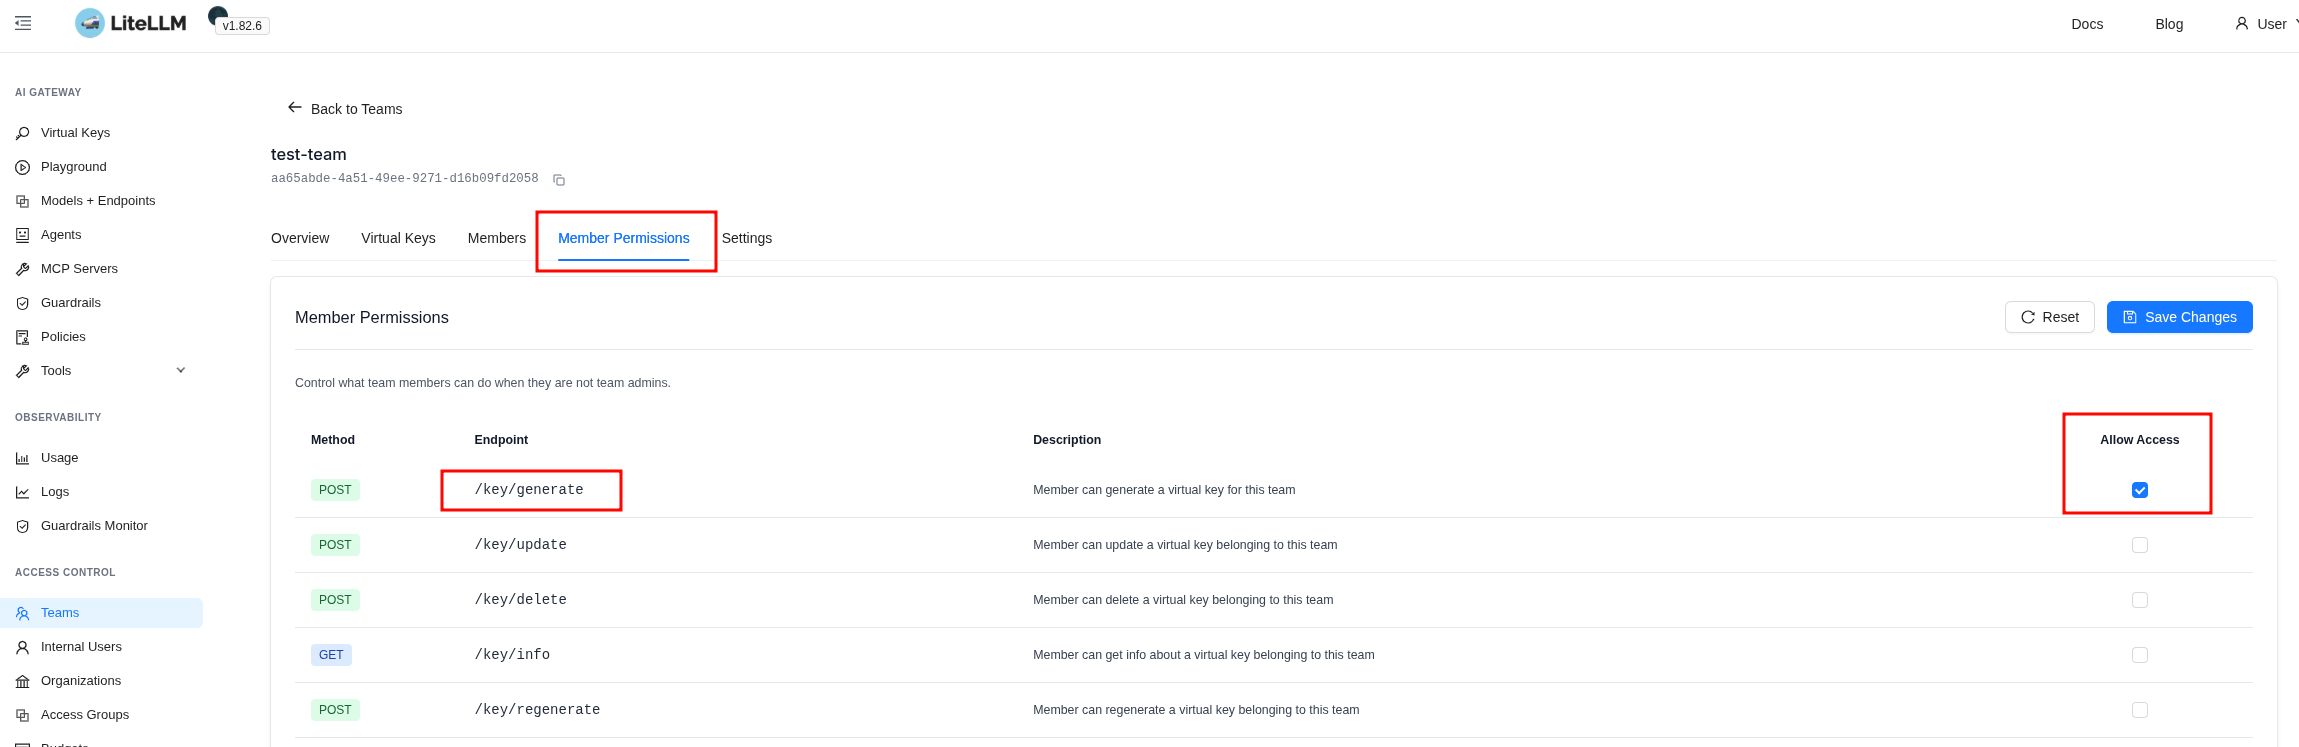
Another way to allow creating keys for the group – set it via Member Permissions:
Creating a User API Key for a Team in the Web UI
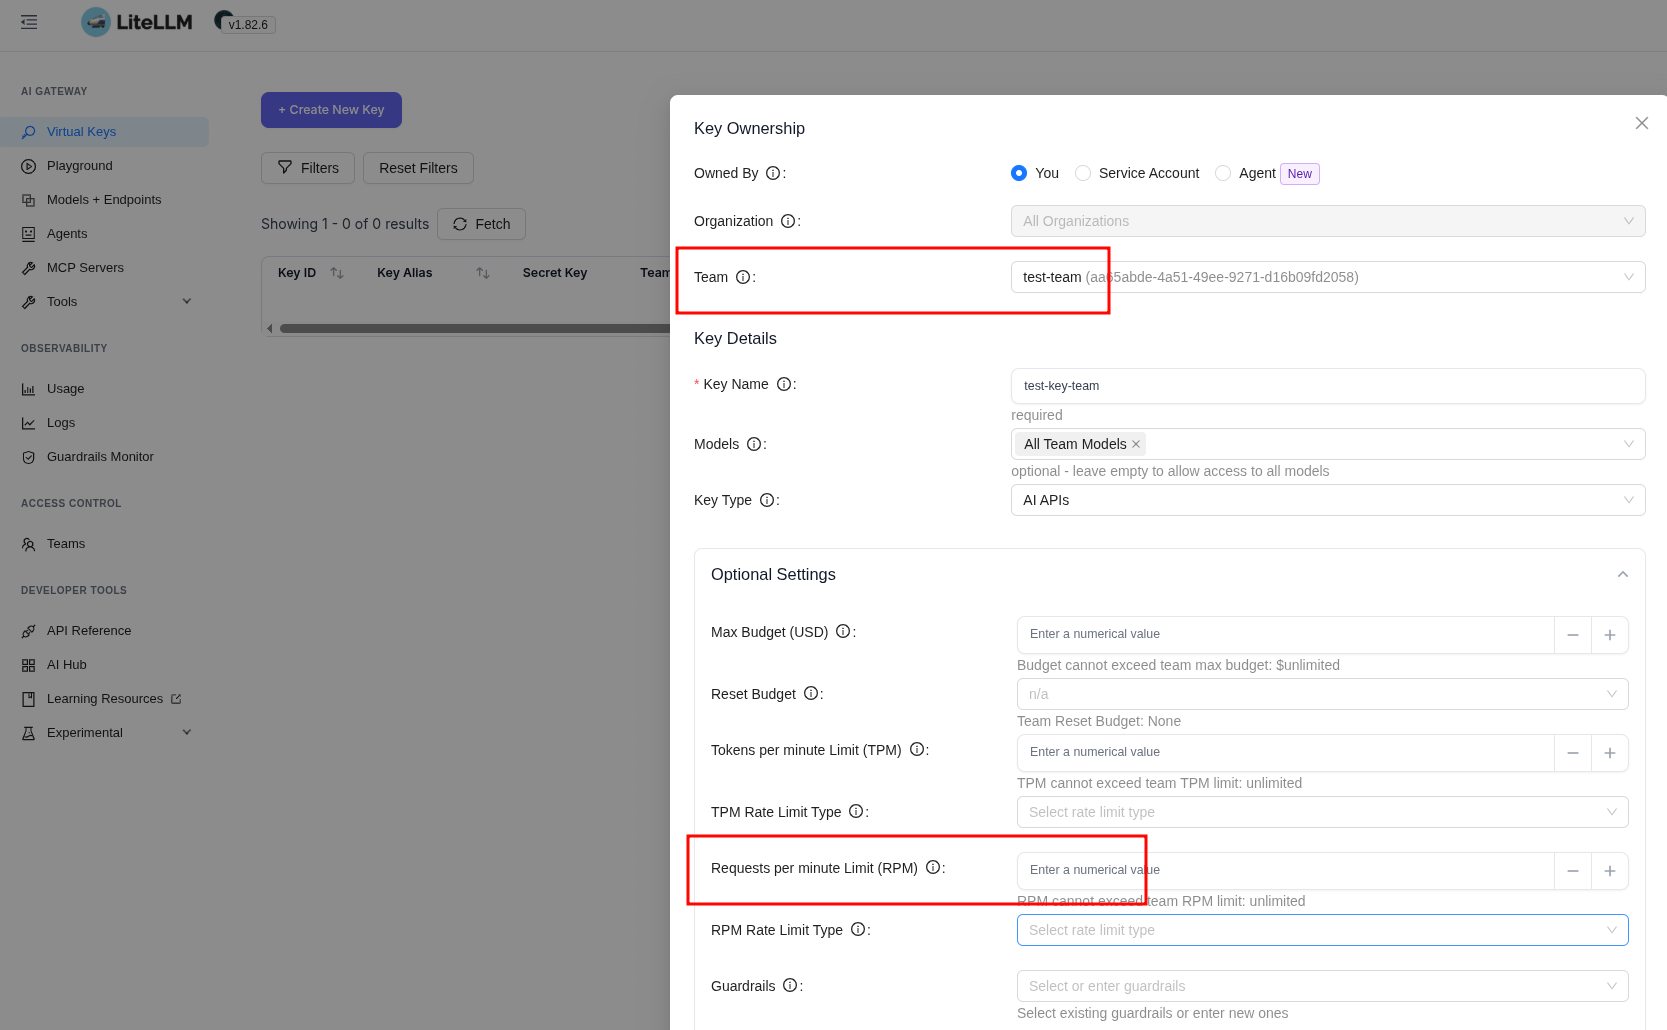
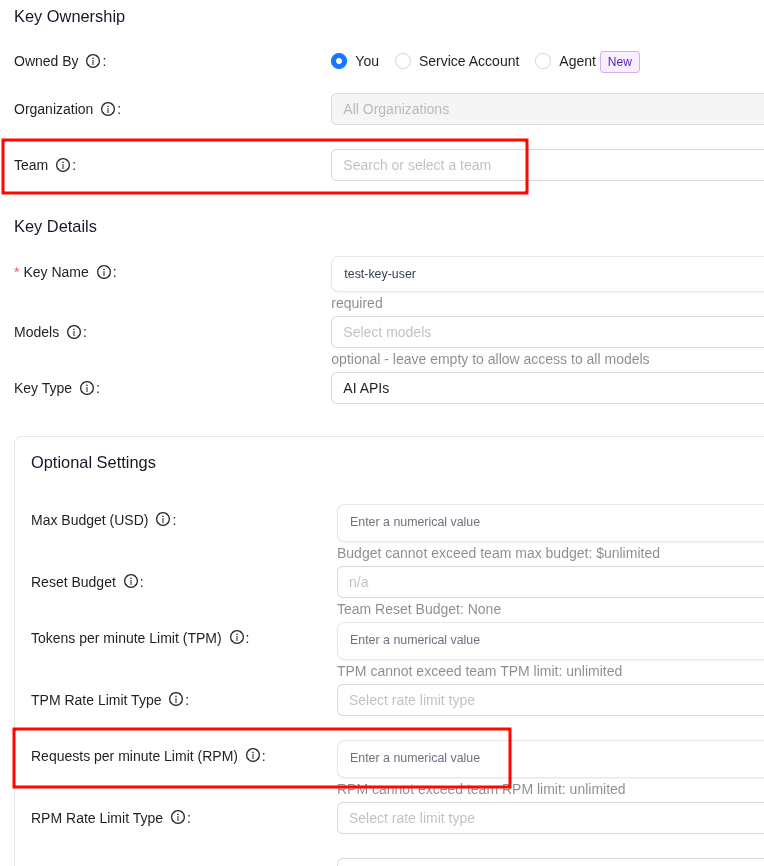
Now under this user we create a key – we specify the group but don’t set an RPM:
We save the key:
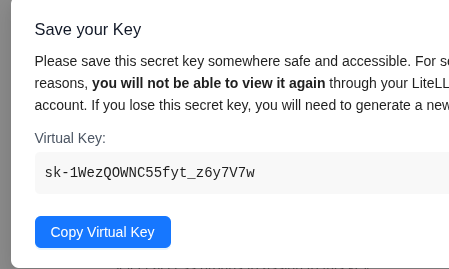
We set a new variable:
$ export LITELLM_USER_KEY=sk-1WezQOWNC55fyt_z6y7V7w
In the Demo App code we change the variable name from LITELLM_MASTER_KEY to LITELLM_USER_KEY, and we can add max_retries – so we catch the Exception right away when LiteLLM returns a 429 to the client:
...

client = OpenAI(
    base_url="http://localhost:4000",
    api_key=os.getenv("LITELLM_USER_KEY"),
    max_retries=0,
)

...
We run the script twice in a row – the first one worked, but the second time we catch a 429 Rate limit exceeded – because we set the RPM Limit in the Team:
 $ ./demo-llm.py
Hello! How can I assist you today?
...

$ ./demo-llm.py
...
openai.RateLimitError: Error code: 429 - {'error': {'message': 'Rate limit exceeded for team: aa65abde-4a51-49ee-9271-d16b09fd2058. Limit type: requests. Current limit: 1, Remaining: 0. Limit resets at: 2026-06-04 09:13:21 UTC', 'type': 'None', 'param': 'None', 'code': '429'}}
Creating a User API Key in the Web UI without a Team and without Limits
Now under the same user we create one more key – but this time without a Team, and again we don’t set any limits:
We update the variable:
$ export LITELLM_USER_KEY=sk-K7Dvc7gSFye6RKsFBB2PyQ
We run the script – and happily spam LiteLLM with requests:
$ ./demo-llm.py
Hello! How can I assist you today?
...

$ ./demo-llm.py
Hello! How can I assist you today?
...
That is, if we give users the ability to create keys – they can calmly make keys without any restrictions (apart from the ones we set globally in upperbound_key_generate_params).
But when creating a user or a key through the API we can set all the needed limits right away.
Creating a User and API Key via the LiteLLM API with a Rate Limit
We create a user with an rpm_limit:
$ curl -X POST http://localhost:4000/user/new \
  -H "Authorization: Bearer $LITELLM_MASTER_KEY" \
  -H "Content-Type: application/json" \
  -d '{
    "user_email": "[email protected]",
    "rpm_limit": 1,
    "user_role": "internal_user"
  }'
In the response we get their key, and right there we see that team_id is empty – the user doesn’t belong to a group, but has their own rpm_limit:
{..., "max_budget":null, "user_id":"7a9a6ced-ae6a-497e-a9ba-e35825139845", "team_id":null, ..., "rpm_limit":1, ..., "key":"sk-cazziUlsSKQEGTsTUGILRA", ... ,"user_email":"[email protected]","user_role":"internal_user", ... }
We set this key in a variable:
$ export LITELLM_USER_KEY=sk-cazziUlsSKQEGTsTUGILRA
We run the script twice – and on the second one we get a 429 again:
$ ./demo-llm.py
Hello! How can I assist you today?
...

$ ./demo-llm.py
...
openai.RateLimitError: Error code: 429 - {'error': {'message': 'Rate limit exceeded [...] }
Instead of conclusions
The system looks really cool in terms of letting you have unified LLM monitoring – out of the box we get a bunch of useful metrics, we get traces. And 50,000 stars on GitHub isn’t something just anyone racks up.
The traces integrate beautifully with external systems, and it’s really convenient that out of the box we can send them to several different backends at once.
But the user management raised some questions for me – because it’s somehow not very intuitive. In places, at first glance, confusing, in places with something that looks like bugs. Although overall there really are a lot of access management capabilities.
Still, let’s try running it on our side and see how it does in real work – luckily, when the project is at MVP you can afford to experiment.
And when I run it in Kubernetes – I’ll probably go through the access and users separately one more time, because this needs some extra digging.
![]()