![]()
We use two systems for collecting logs in the project: Grafana Loki and VictoriaLogs, to which Promtail simultaneously writes all collected logs.
We cannot get rid of Loki: although developers have long since switched to VictoriaLogs, some alerts are still created from metrics generated by Loki, so it is still present in the system.
And at some point, we started having two problems:
- the disk on VictoriaLogs was getting clogged up – we had to reduce retention and increase the disk size, even though it had been sufficient before
- Loki started dropping logs with the error “Ingestion rate limit exceeded”
Let’s dig in – what exactly is clogging up all the logs, why, and how can we monitor this?
Contents
The issue: Loki – Ingestion rate limit exceeded
I started digging with the “Ingestion rate limit exceeded” error in Loki, because the disk space on VictoriaLogs was full for the same reason – too many logs were being written.
In the alerts for Loki, it looks like this:

The alert itself is generated from the metric loki_discarded_samples_total:
...
      - alert: Loki Logs Dropped
        expr: sum by (cluster, job, reason) (increase(loki_discarded_samples_total[5m])) > 0
        for: 1s
...
I didn’t have an alert for VictoriaLogs, but it has a similar metric – vl_rows_dropped_total.
When Loki started dropping logs received from Promtail, I began checking Loki’s own logs, where I found errors with the rate limit:
...
path=write msg="write operation failed" details="Ingestion rate limit exceeded for user fake (limit: 4194304 bytes/sec) while attempting to ingest '141' lines totaling '1040783' bytes, reduce log volume or contact your Loki administrator to see if the limit can be increased" org_id=fake
...
Then I didn’t bother digging deeper, but simply increased the limit via limits_config, see Rate-Limit Errors:
...
    limits_config:
      ...
      ingestion_rate_mb: 8
      ingestion_burst_size_mb: 16
...
For VictoriaLogs, I simply increased the disk size – Kubernetes: PVC in StatefulSet, and the “Forbidden updates to StatefulSet spec” error.
This seemed to help for a while, but then the errors reappeared, so I had to investigate further.
Checking logs ingestion
So, what we need to do is determine who is writing so many logs.
We are interested in two parameters:
- number of records per second
- number of bytes per second
And we want to see this broken down by service.
Records per second
You can get the log rate per second in VictoriaLogs simply with the rate() function:
{app=~".*"}
| stats by (app) rate() records_per_second
| sort by (records_per_second) desc
| limit 10
Here:
- we group on the label
app(sum by (app)in Loki) - with
rate()we get the per-second rate of new records on the groupapp, store the result in a new fieldrecords_per_second - sort by
records_per_secondin descending - order and output the top 10 with
limit(orhead)

Well, actually…
We can see that VictoriaLogs is way ahead of the rest 🙂
In addition, the VictoriaLogs graph shows that most logs come from the Namespace ops-monitoring-ns, where VictoriaLogs lives:

In Loki, you can view the per-second rate with a similar function, rate():
topk(10, sum by (app) (rate({app=~".+"}[1m])))

Bytes per second
The same pattern can be seen with bytes per second.
In Loki, we can see this simply with bytes_over_time():
topk(10, sum by (app) (bytes_over_time({app=~".+"}[1m])))

For VictoriaLogs, there is block_stats, but out of the box, it does not allow you to display statistics for each stream, see How to determine which log fields occupy the most disk space?
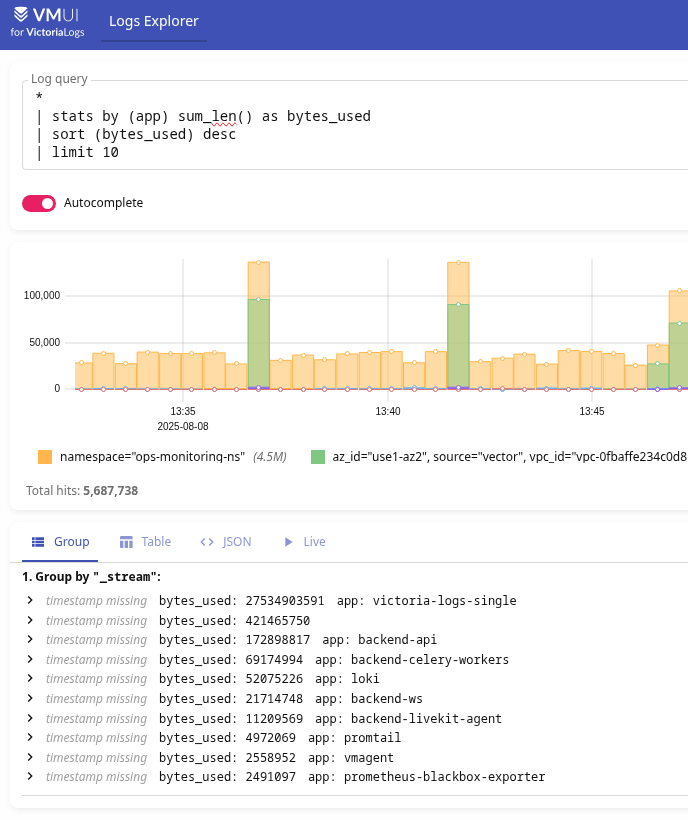
However, there is sum_len(), where we can get statistics, for example, like this:
*
| stats by (app) sum_len() as bytes_used
| sort (bytes_used) desc
| limit 10
Or per-second rate:
*
| stats by (app) sum_len() as rows_len
| stats by (app) rate_sum(rows_len) as bytes_used_rate
| sort (bytes_used_rate) desc
| limit 10

The cause
Everything turned out to be quite simple.
All we had to do was look at the VictoriaLogs logs and see that it logs all entries received from Promtail – “new log entry”:

Let’s check out the options for VictoriaLogs in the documentation List of command-line flags, where I found the -logIngestedRows parameter:
-logIngestedRows
Whether to log all the ingested log entries; this can be useful for debugging of data ingestion; see https://docs.victoriametrics.com/victorialogs/data-ingestion/ ; see also -logNewStreams
The default value is not specified here, and I initially thought that it was simply set to “true,” so I went to the values of our chart to set it to “false,” where I saw:
...
victoria-logs-single:
  server:
    ...
    extraArgs:
      logIngestedRows: "true"
...
Ouch…
I enabled this logging for some reason once and forgot about it.
Actually, we can switch it to “false” (or just delete it, because it’s “false” by default), deploy it, and the problem is solved.
At the same time, we can switch loggerLevel, which is set to INFOby default.
And here, by the way, there could be an interesting picture: if both Loki and VictoriaLogs wrote a log about every log record they received, then…
- Loki receives any record from Promtail
- writes this event to its own log
- Promtail sees a new record from the container with Loki and again transmits it to both Loki and VictoriaLogs
- VictoriaLogs records in its log that it has received this record
- Promtail sees a new record from the container with VictoriaLogs and transmits it to both Loki and VictoriaLogs
- Loki receives this record from Promtail
- records this event in its own log
- …
A kind of “fork logs bomb”.
Monitoring logs for the future
Here, too, everything is simple: either we use the default metrics from Loki and VictoriaLogs, or we generate our own.
Loki metrics
In the Loki chart, there is an option called monitoring.serviceMonitor.enabled. You can simply enable it, and then VictoriaMetrics Operator will create VMServiceScrape and start collecting metrics.
The following may be of interest for Loki:
loki_log_messages_total: Total number of messages logged by Lokiloki_distributor_bytes_received_total: The total number of uncompressed bytes received per tenantloki_distributor_lines_received_total: The total number of lines received per tenantloki_discarded_samples_total: The total number of samples that were droppedloki_discarded_bytes_total: The total number of bytes that were dropped
Or we can create our own metrics with information for each app:
kind: ConfigMap
apiVersion: v1
metadata:
  name: loki-recording-rules
data:
  rules.yaml: |-
  ...
      - name: Loki-Logs-Stats

        rules:

        - record: loki:logs:ingested_rows:sum:rate:5m
          expr: |
            topk(10,
              sum by (app) (
                rate({app=~".+"}[5m])
              )
            )

        - record: loki:logs:ingested_bytes:sum:rate:5m
          expr: |
            topk(10,
              sum by (app) (
                bytes_rate({app=~".+"}[5m])
              )
            )
Deploy and check:

And then use these metrics to create alerts:
...
      - alert: Loki Logs Ingested Rows Too High
        expr: sum by (app) (loki:logs:ingested_rows:sum:rate:5m) > 100
        for: 1s
        labels:
          severity: warning
          component: devops
          environment: ops
        annotations:
          summary: 'Loki Logs Ingested Rows Too High'
          description: |-
            Grafana Loki ingested too many log rows
            *App*: `{{ "{{" }} $labels.app }}`
            *Value*: `{{ "{{" }} $value | humanize }}` records per second
          tags: devops

      - alert: Loki Logs Ingested Bytes Too High
        expr: sum by (app) (loki:logs:ingested_bytes:sum:rate:5m) > 50000
        for: 1s
        labels:
          severity: warning
          component: devops
          environment: ops
        annotations:
          summary: 'Loki Logs Ingested Bytes Too High'
          description: |-
            Grafana Loki ingested too many log bytes
            *App*: `{{ "{{" }} $labels.app }}`
            *Value*: `{{ "{{" }} $value | humanize1024 }}` bytes per second
          tags: devops
...
VictoriaLogs metrics
Add metrics collection from VictoriaLogs:
...
victoria-logs-single:
  server:
    ...
    vmServiceScrape:
      enabled: true
..
Useful metrics:
vl_bytes_ingested_total: Total estimate of the volume of log bytes accepted by injectors, broken down by protocol using tagsvl_rows_ingested_total: Total number of log records successfully accepted by injectors, broken down by injection protocols using tags in the raw seriesvl_rows_dropped_total: The total number of rows dropped by the server during injection, with the reasons marked (e.g., debug mode, too many fields, timestamps out of bounds)vl_too_long_lines_skipped_total: Number of rows exceeding the size skipped due to exceeding the configured maximum row sizevl_free_disk_space_bytes: Current free space available on the file system hosting the storage path
All metrics can be found in the documentation: Metrics of VictoriaLogs.
And add an alert like this:
...
      - alert: VictoriaLogs Logs Dropped Rows Too High
        expr: sum by (reason) (vl_rows_dropped_total) > 0
        for: 1s
        labels:
          severity: warning
          component: devops
          environment: ops
        annotations:
          summary: 'VictoriaLogs Logs Dropped Rows Too High'
          description: |-
            VictoriaLogs dropped too many log rows
            *Reason*: `{{ "{{" }} $labels.app }}`
            *Value*: `{{ "{{" }} $value | humanize }}` records dropped
          tags: devops
...
But again, vl_rows_ingested_total won’t tell us which app is writing too many logs.
Therefore, we can add RecordingRules, see VictoriaLogs: creating Recording Rules with VMAlert:
apiVersion: operator.victoriametrics.com/v1beta1
kind: VMRule
metadata:
  name: vmlogs-alert-rules
spec:

  groups:

    - name: VM-Logs-Ingested
      # an expressions for the VictoriaLogs datasource
      type: vlogs
      rules:
        - record: vmlogs:logs:ingested_rows:stats:rate
          expr: |
            {app=~".*"}
            | stats by (app) rate() records_per_second
            | sort by (records_per_second) desc
            | limit 10
Deploy, check again:

And add an alert:
...
      - alert: VictoriaLogs Logs Ingested Rows Too High
        expr: sum by (app) (vmlogs:logs:ingested_rows:stats:rate) > 100
        for: 1s
        labels:
          severity: warning
          component: devops
          environment: ops
        annotations:
          summary: 'VictoriaLogs Logs Ingested Rows Too High'
          description: |-
            Grafana Loki ingested too many log rows
            *App*: `{{ "{{" }} $labels.app }}`
            *Value*: `{{ "{{" }} $value | humanize }}` records per second
          tags: devops
...
The result:

Well, that’s all for now.
This is basic monitoring for VictoriaLogs and Loki.
![]()