 AWS CloudTrail is a service for auditing AWS accounts events and is enabled by default.
It saves all actions that were done by a user, IAM role, or an AWS service via AWS Console, AWS CLI, or AWS SDK.
CloudTrail will write information about every API call, log in to the system, services events, and is an indispensable instrument for AWS account security.
Such events will be stored for 90 days, but you can configure a trail, that will store selected events to an AWS S3 bucket and can send them to AWS CloudWatch, and in CloudWatch we can configure Alarms to receive notifications.
These trails can be of two types: global, applied to all AWS Regions, and local for only one chosen region. See How does CloudTrail behave regionally and globally?
So, in this post we will take a closer look at AWS CloudTrail and its features, will configure export to CloudWatch, and will create an alarm and notifications to Slack via Opsgenie.
Contents
AWS CloudTrail Events
See What are CloudTrail events? and Logging management events for trails.
An Event in CloudTrail is a record of any activity in an AWS account. Events can be three types: management event, data event, insight event.
Management events
Management events are anything about operations that are performed on AWS resources, and also called control plane operations, for example:
- security operations (for example, the
AttachRolePolicyAPI call) - new resources creation (for example, the
CreateDefaultVpcAPI call) - network configuration updates (for example, the
CreateSubnetAPI call) - logging configuration changes (for example, the
CreateTrailAPI call)
Also, it includes non-API calls such as logins to the AWS Management Console, see Non-API Events Captured by CloudTrail.
Also, these events can be about read or write API calls. Read operations are operations that only request information about AWS resources (for example, DescribeSubnets), and Write – any modification requests (for example, TerminateInstances), see Read and write events.
Data events
See Data events.
These are information about operations with or within a concrete AWS resource, also called data plane operations, for example:
- S3 buckets operations such as
GetObject,DeleteObject, andPutObject - AWS Lambda function calls
- Amazon DynamoDB operations such as
PutItem,DeleteItemиUpdateItem
They are not logged by default and must be enabled when creating a trail.
Insights events
CloudTrail Insights will watch for anomalies and if will create a CloudTrail event if find any.
Such anomalies could be an unusual number of Delete API calls to an AWS S3 bucket or too high (or too low) calls like AuthorizeSecurityGroupIngress.
CloudTrail trail
As mentioned above, a trail can stored events over 90 days and can be integrated with CloudTrail and CloudWatch. Also, it can collect data from all regions, while CloudTrail Dashboard displays information only about the current region.
Create a CloudTrail trail
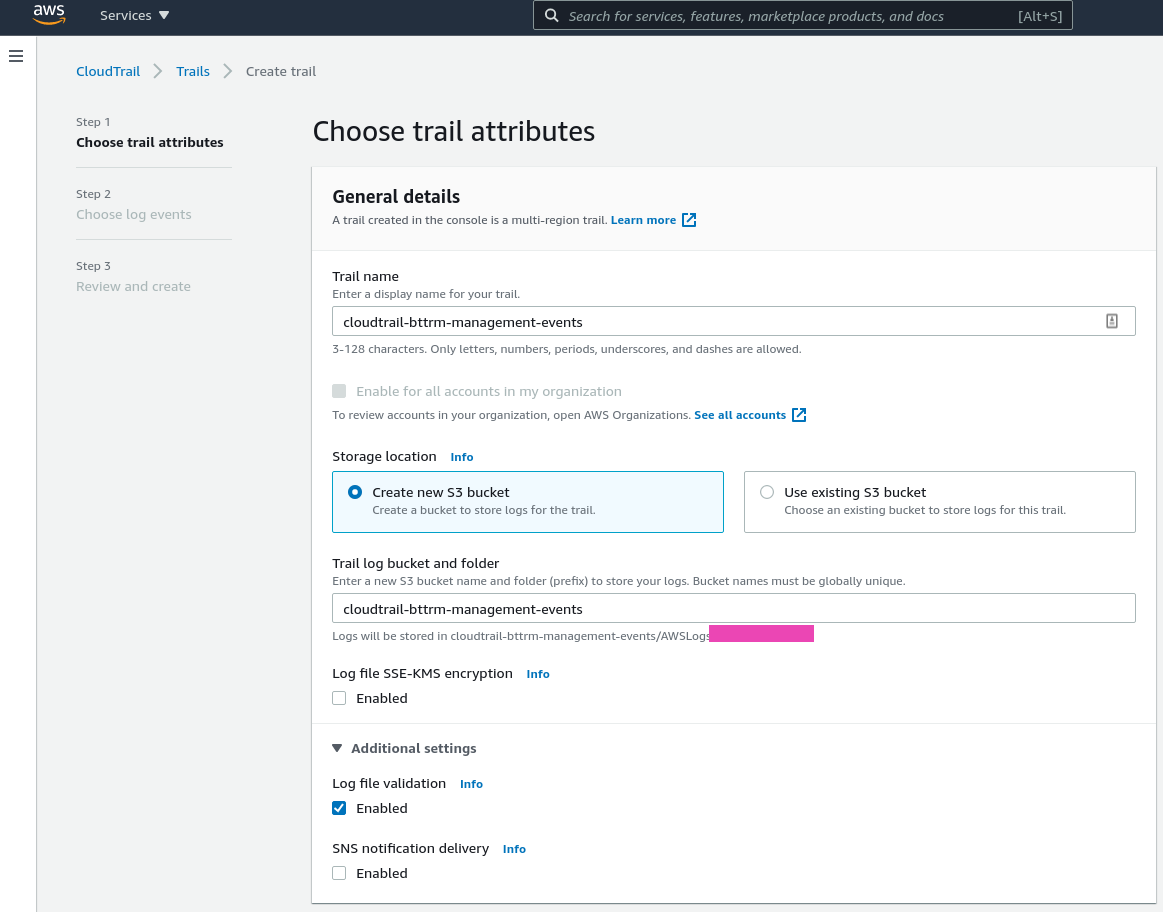
Go to the Trails, click on the Create trail button:
Set its name, chose to Create new S3 bucket, specify its name, and for now disable its data encryption:
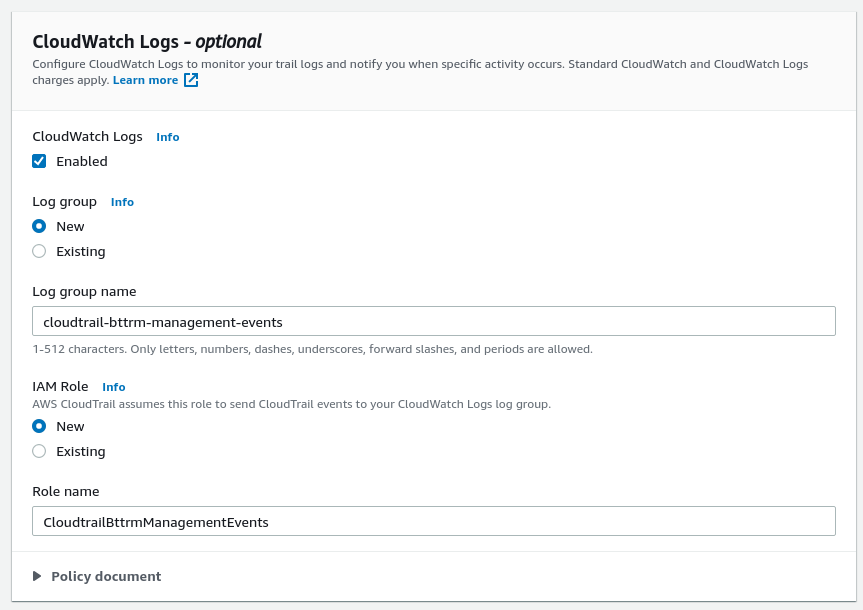
To configure alerts, enable sending events to AWS CloudWatch Logs:
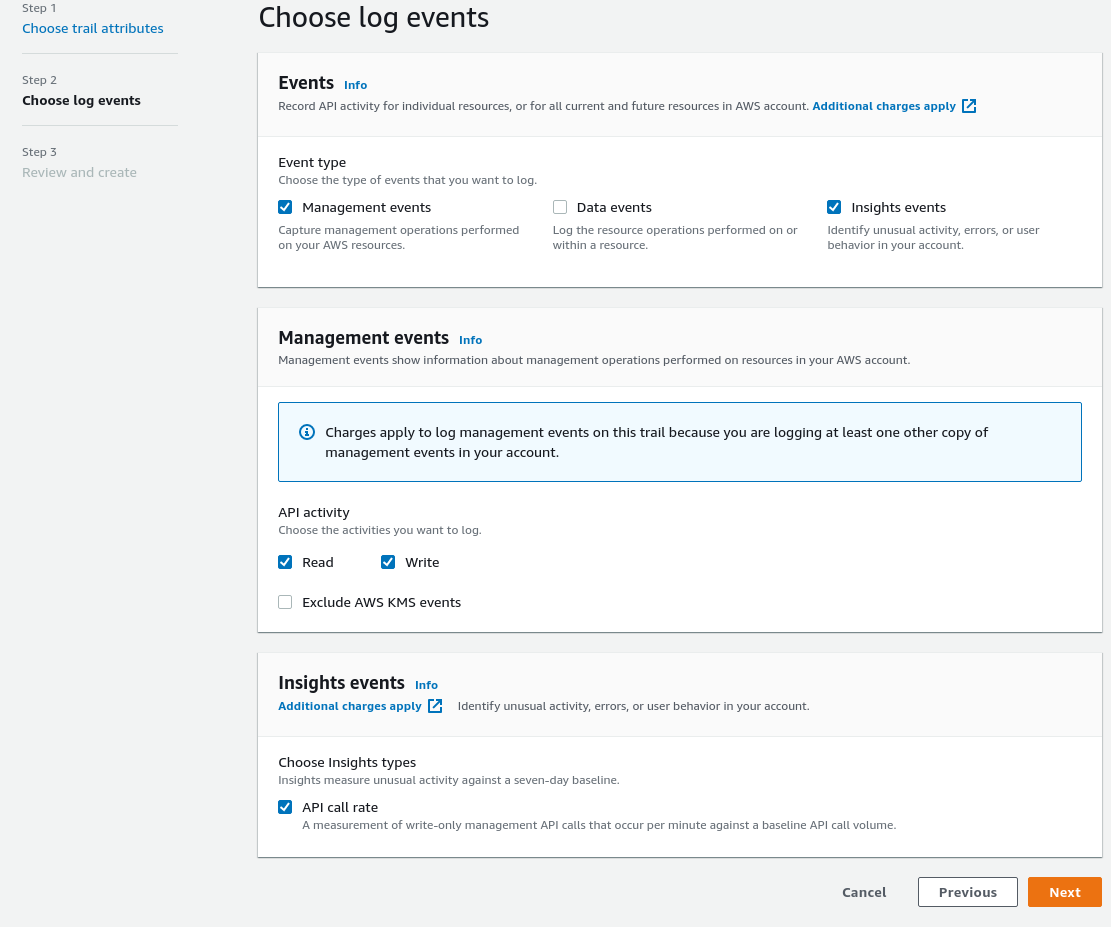
Leave Management events and enable Insights.
For the Management events enable both Read and Write, for the Insights events enable the API call rate:
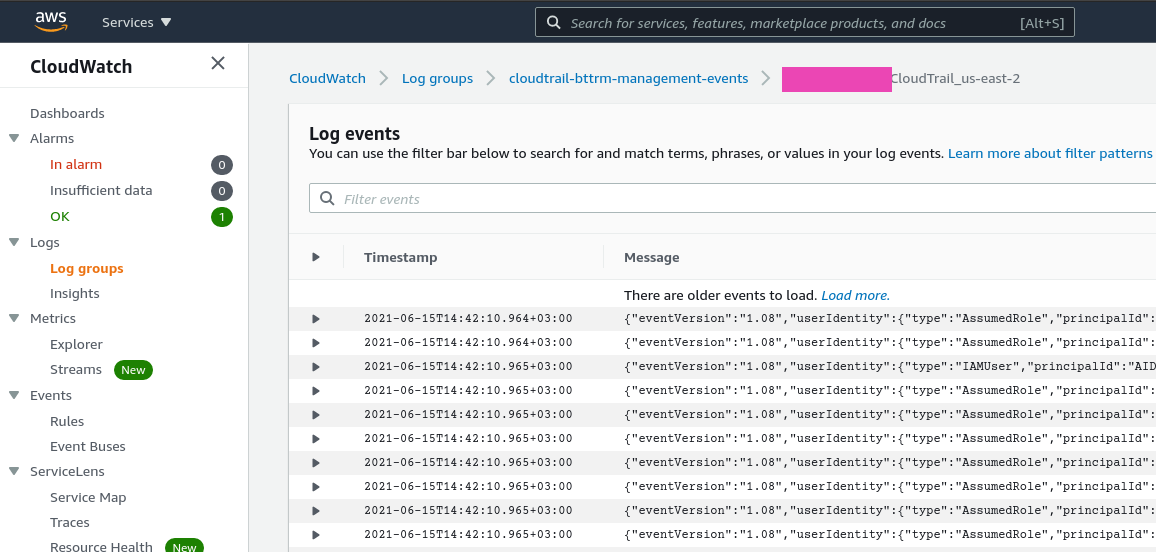
Check data in CloudWatch Logs:
Now, we can create CloudWatch Metrics from these events and configure an Alarm.
CloudTrail and CloudWatch integration
Next, let’s create a new CLoudWatch metric based on CloudTrail events, and then will configure an Alarm that will send a notification to AWS Simple Notification Service (SNS), which in its turn will forward them to Opsgenie, and from there we will receive messages to Slack.
There is a question, which events we really need to watch. This can be googled by the “cloudtrail security alerts” query that will give two interesting materials – Threat Hunting with CloudTrail and GuardDuty in Splunk, and Key CloudTrail Events To Monitor for Security in AWS, or just check examples in the reating CloudWatch Alarms with an AWS CloudFormation Template.
For use, we will use the following:
- logins to the AWS Console outside of our office (as the office IP example here – 8.8.8.8):
{ ($.eventName = ConsoleLogin) && ($.sourceIPAddress != "8.8.8.8") } - root user logins to the AWS Console:
{ ($.eventName = ConsoleLogin) && ($.userIdentity.type = "Root") } - logins with errors to the AWS Console:
{ ($.eventName = ConsoleLogin) && ($.errorMessage = "Failed authentication") } - unauthorized operations:
{ ($.errorCode = "*UnauthorizedOperation") || ($.errorCode = "AccessDenied*") } - notifications on spinning up huge EC2 instances, for example, the biggest type used by our team is c5.4xlarge :
{ ($.eventName = RunInstances) && (($.requestParameters.instanceType = *.8xlarge) || ($.requestParameters.instanceType = *.4xlarge)) } - new IAM users creation:
{ $.eventName="CreateUser" }
See Filter and pattern syntax.
At first, let’s create a simple alert about any login to the AWS Console
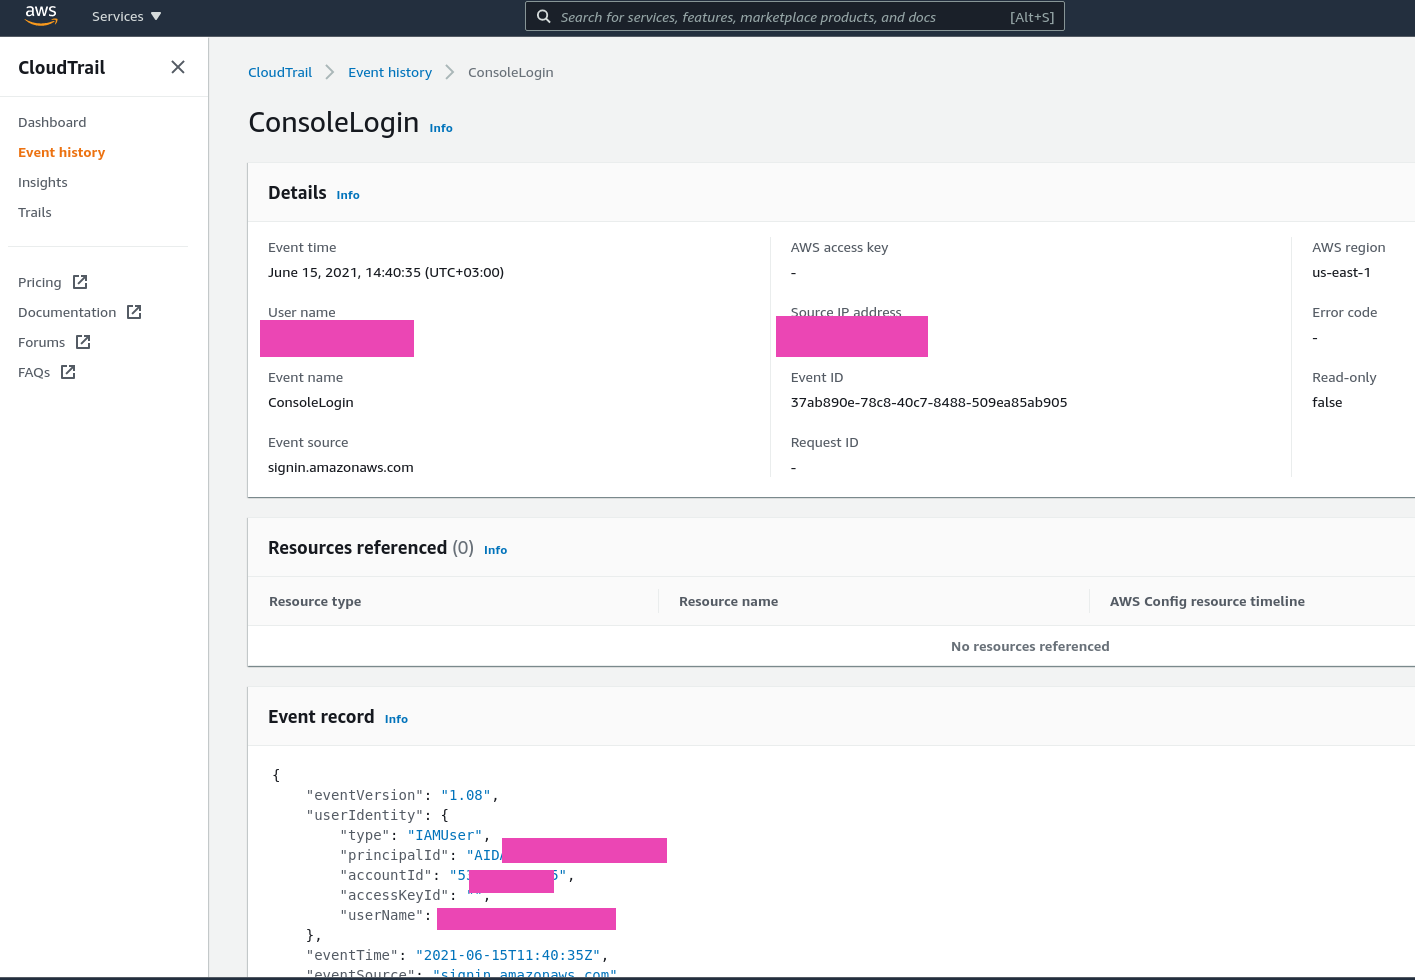
To start, take a look how a login in the event will look like: log in to your account, wait 10-15 minutes, make a filter by the Event name == ConsoleLogin:
Create an AWS CloudWatch custom metric
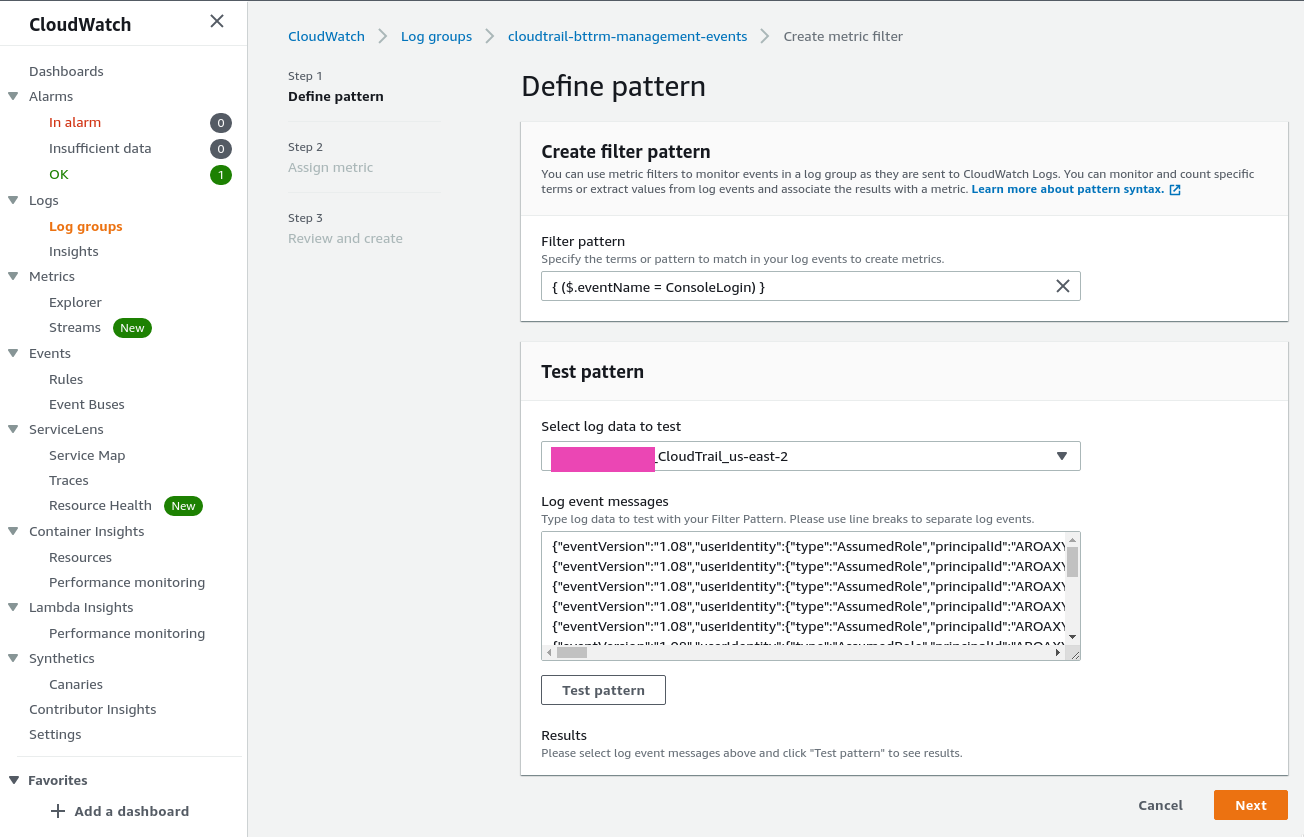
Go back to a log-group create above, on the Metric filters tab click Create metric filter.
In the Filter pattern use { ($.eventName = ConsoleLogin) }:
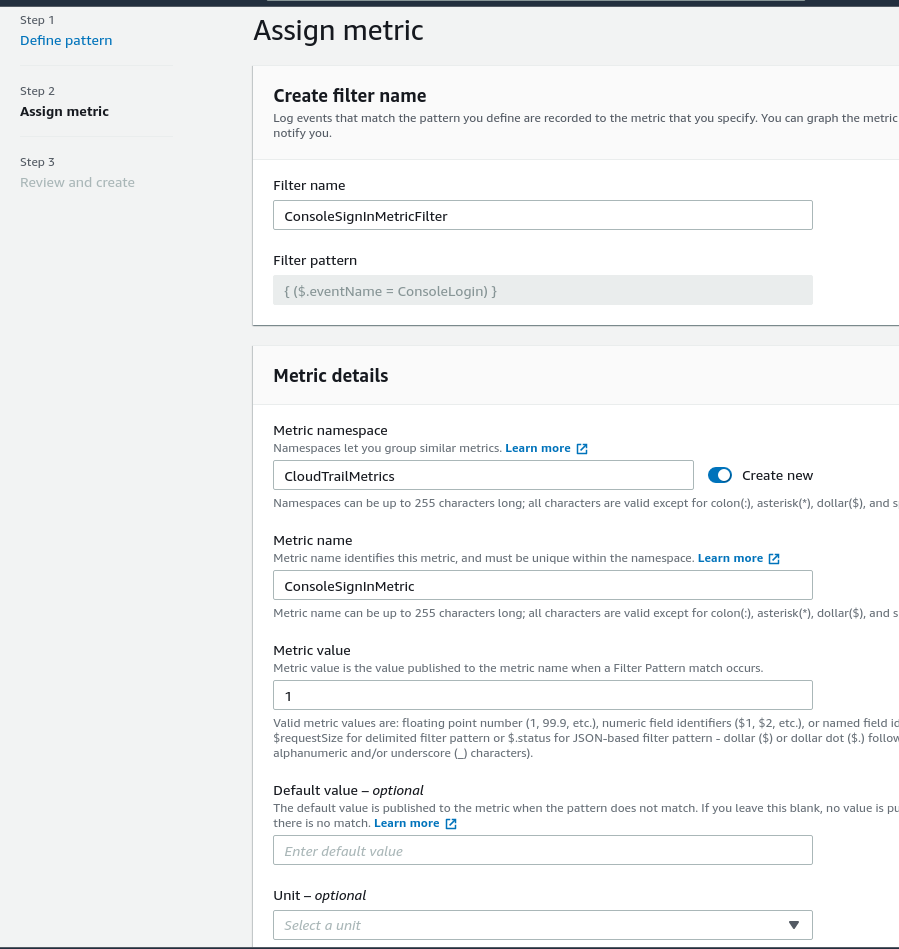
Fill its fields:
Check the metrics on graphs:
Opsgenie and AWS Simple Notifications Service
Go to the AWS SNS, create a new SNS topic with the Standart type:
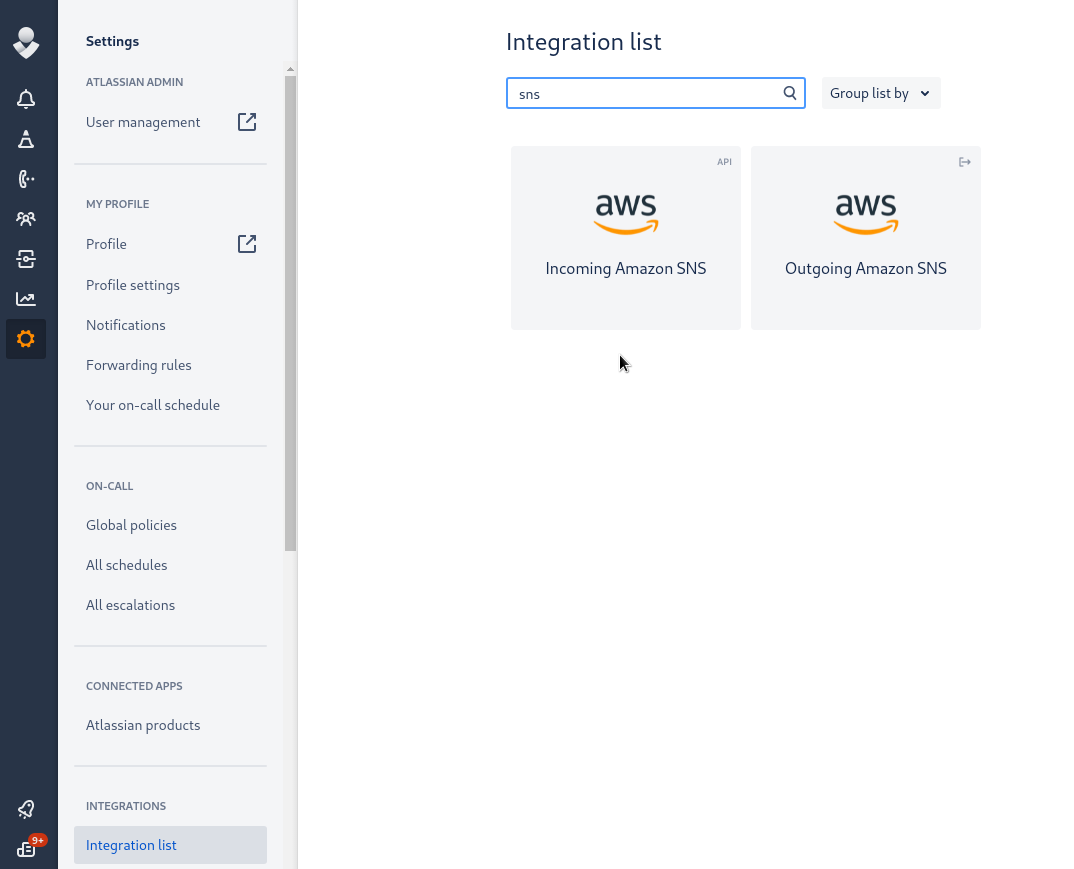
In the Opsginie Integration list find Incoming Amazon SNS:
Save the integration, save the API key:
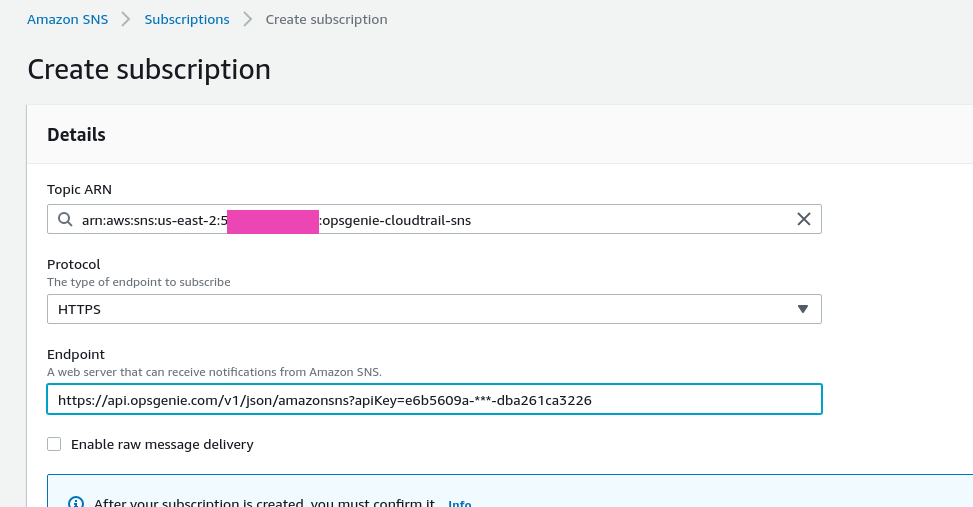
Go back to the SNS, click on the Create Subscription, chose HTTPS, set the URL and API key provided by Opsgenie:
Receive a notification that subscription was confirmed:
Create an AWS CloudWatch Alarm
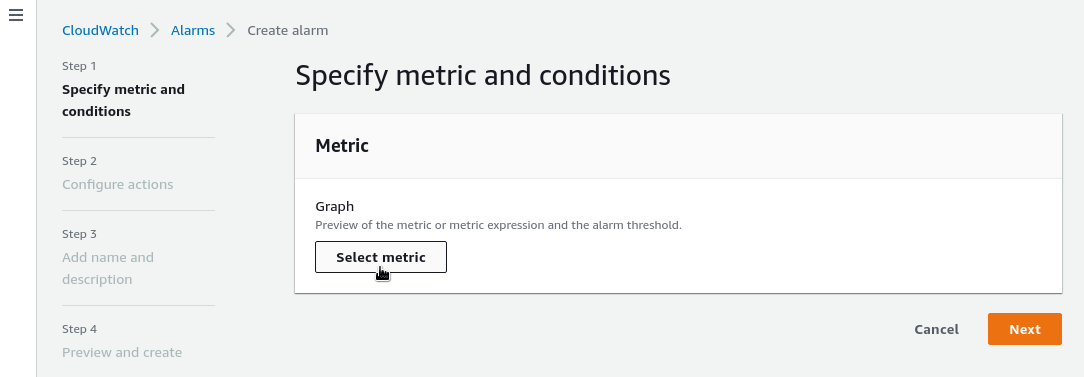
Go to the Alarms, click on the Create alarm:
Chose a metric:
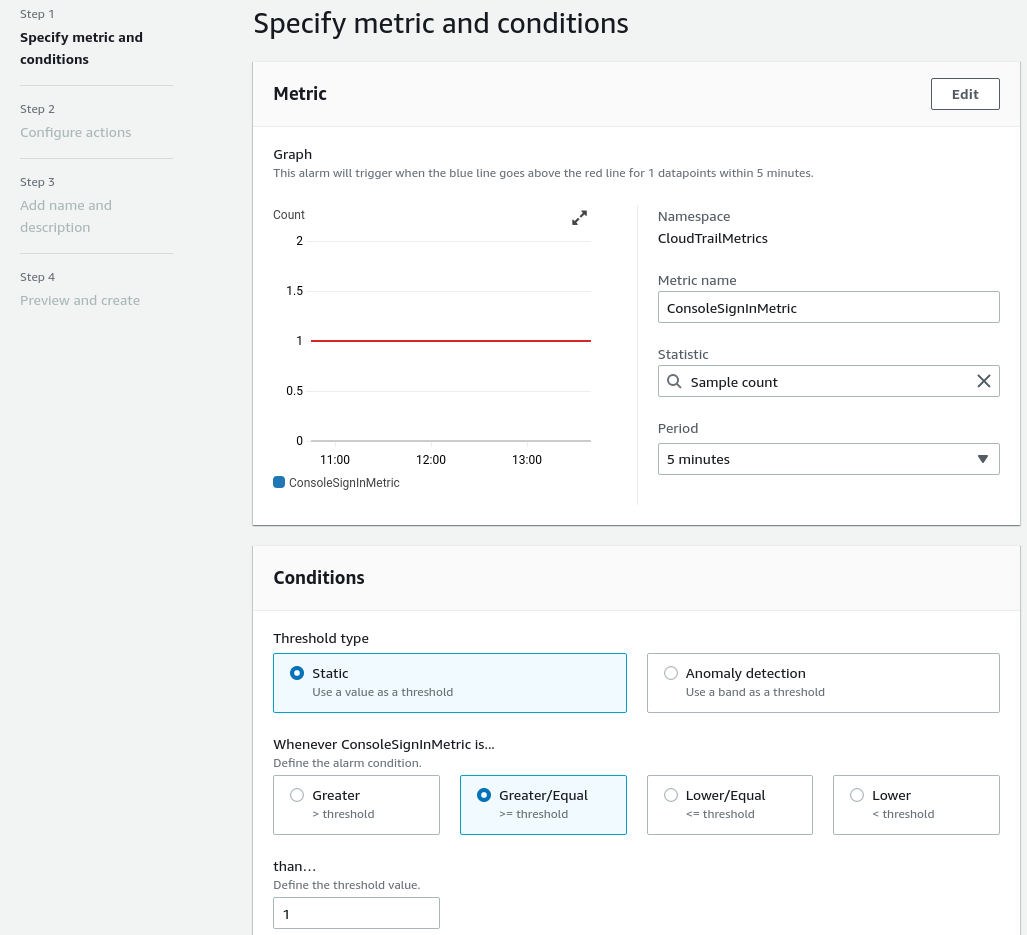
Describe the alert’s conditions: – more or equal 1 event (alert on each login):
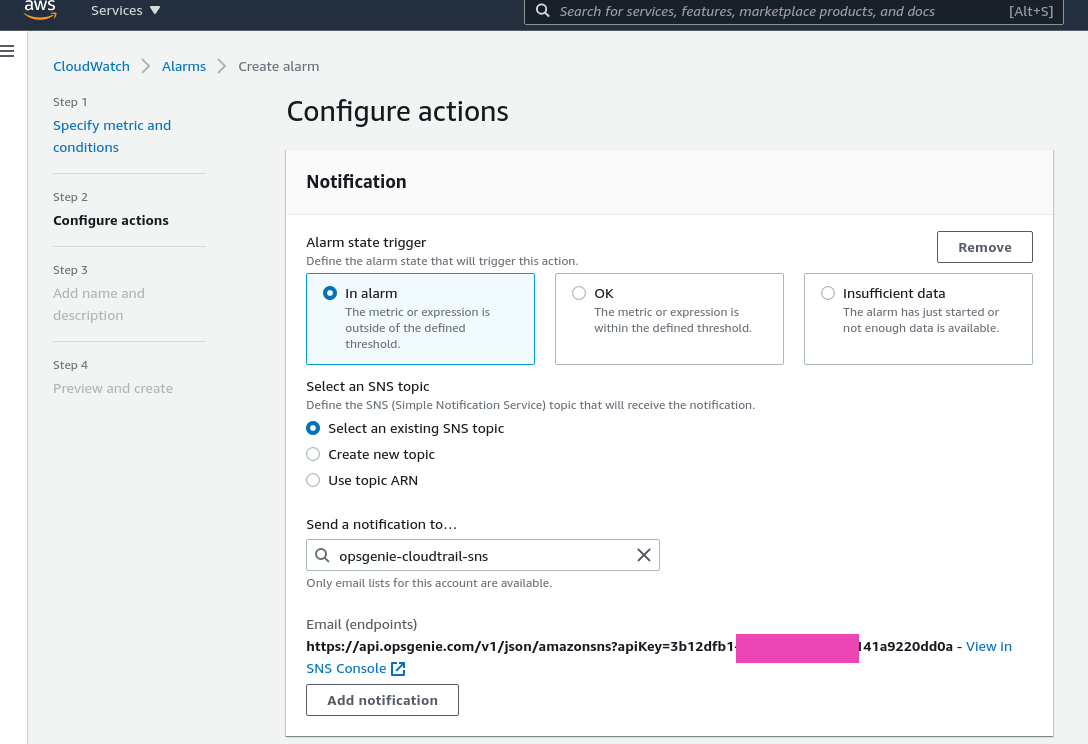
Configure sending notifications to the SNS topic created above:
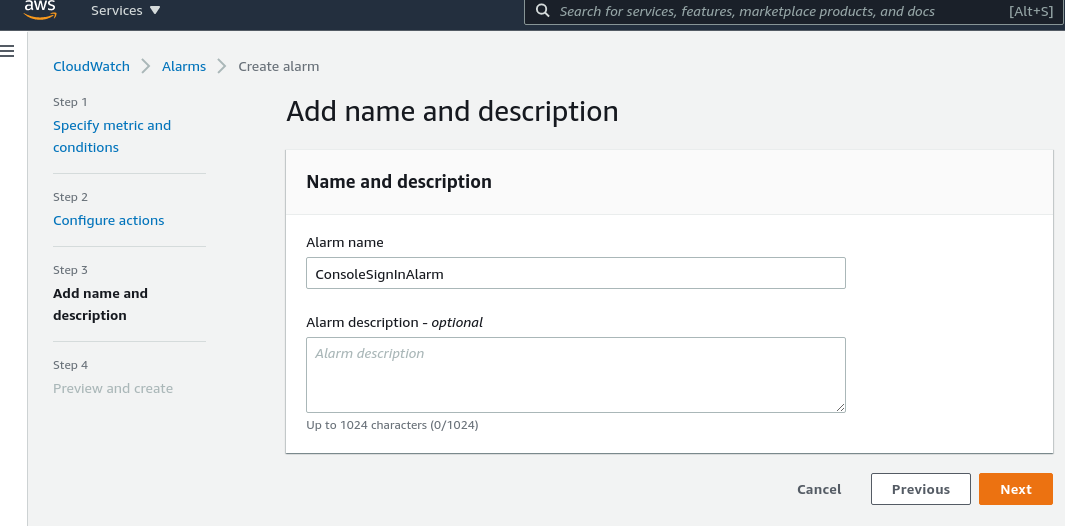
Set the alert’s name, and save it:
In a couple of minutes check its status: instead of Insufficient data it will become ОК (or In alarm if there are logins):
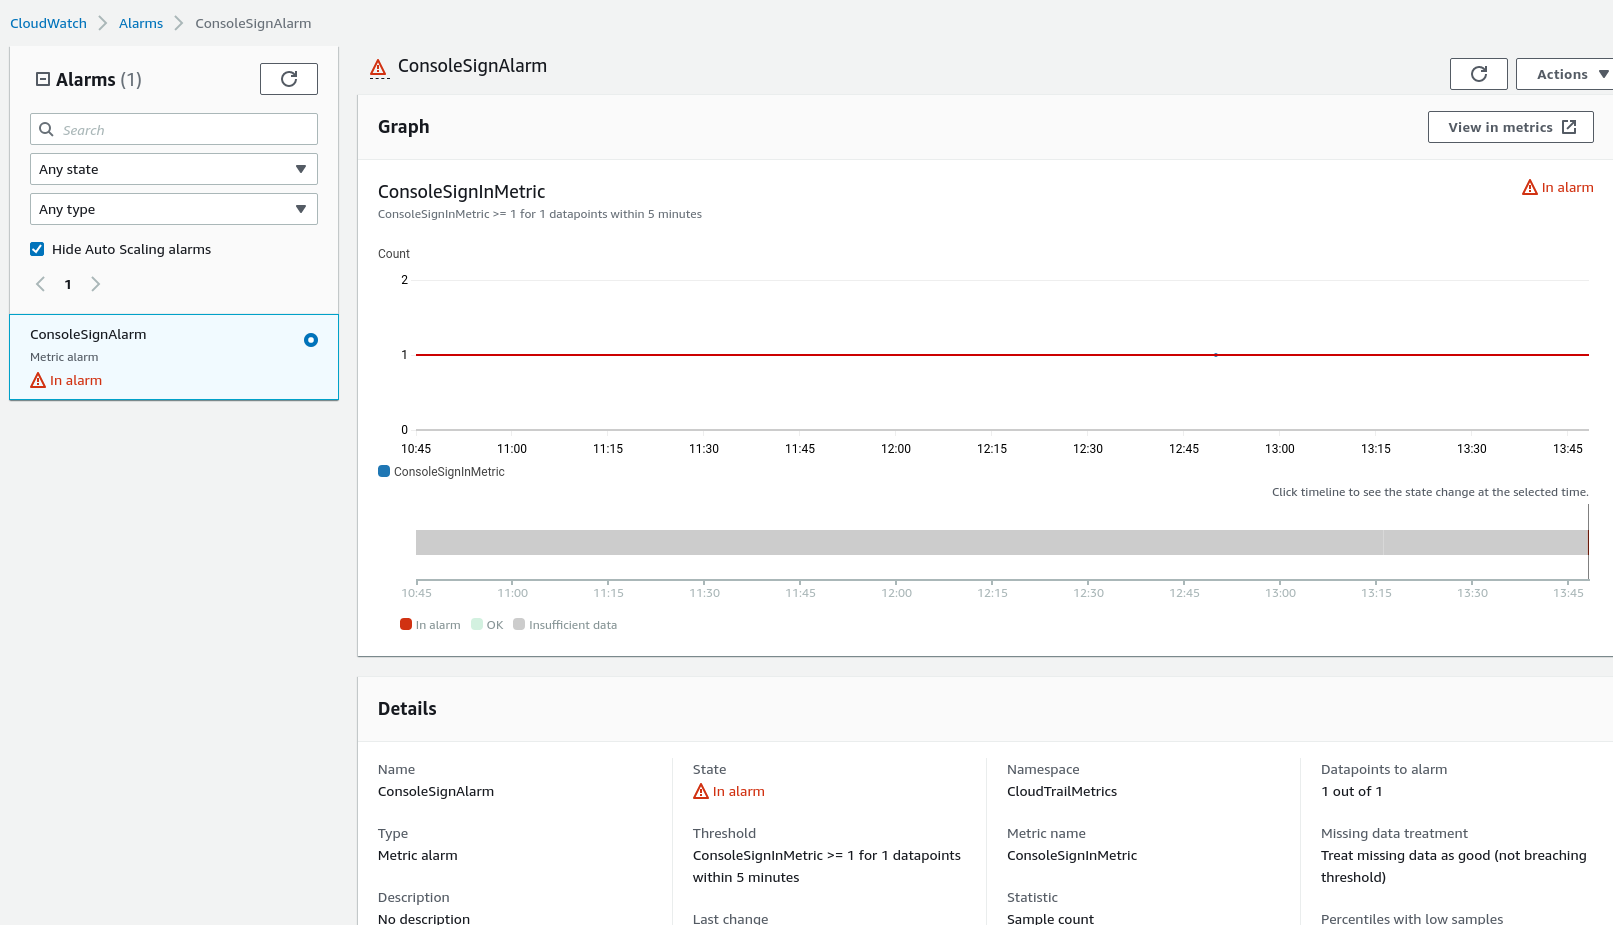
Log in to the AWS Console, and wait for 10-15 minutes for a CloudTrail event, and you’ll get your alarm triggered::
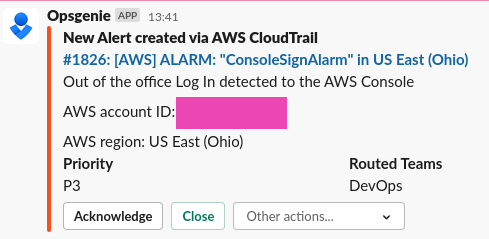
And an alert in Slack:
Opsgenie and custom fields from AWS SNS
What I’d like to do else, is to filter Slack’s message text to display only custom fields.
This can be done Opsgenie string functions.
Go to the Incoming SNS integration, click Advanced:
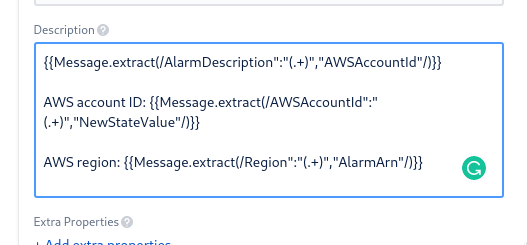
In the Description field add the Message.extract() call:
{{Message.extract(/AlarmDescription":"(.+)","AWSAccountId"/)}}

AWS account ID: {{Message.extract(/AWSAccountId":"(.+)","NewStateValue"/)}}

AWS region: {{Message.extract(/Region":"(.+)","AlarmArn"/)}}
Now, when Opsgenie will receive a message in JSON from AWS SNS it will take only three fields from there – AlarmDescription, AWSAccountId, and Region, and as result, we will see in Slack alarm’s message in the next form:
Done.
![]()

