 Continuing the topic of AWS Load Balancer logs: in the previous post, Golang: recording AWS Load Balancer logs to VictoriaLogs, we collected logs using our own logs collector in Golang. Now we need to get something useful out of these logs.
Previously, when I had Loki on my project, we used its RecordingRules to create metrics, which we then used to draw dashboards in Grafana and set up alerts with Alertmanager.
Now we need to move this to the VictoriaMetrics stack and its RecordingRules.
I already wrote about RecordingRules in the VictoriaLogs: creating Recording Rules with VMAlert post, but that was mainly an overview and configuration guide, and today we will solve a specific task.
What we want to see in the metrics from the logs:
- 4xx errors
- errors 5xx
- total number of requests on ALB
- total response time
- target response time at specific endpoints of our Backend API
Contents
VictoriaLogs LogsQL ALB logs parsing
ALB access logs have a clearly defined field format (which, however, sometimes changes), see the documentation Access log entries.
Knowing these fields, we can parse them with LogsQL pipes and create the necessary fields, which we will then use for calculations.
extract pipe
The first pipe we will use is extract, which we use to read data from the log and create fields.
We don’t need all the fields, some fields are created at the stage of collecting logs in Go (described in Creating a Log parser), so we set <_> for the fields we want to skip, and now we have the following structure:
{stream="alb"}
| extract "<_> <_> <elb_id> <_> <_> <request_processing_time> <target_processing_time> <response_processing_time> <elb_status_code> <target_status_code> <received_bytes> <sent_bytes> <request_line> <user_agent> <_> <_> <_> <trace_id> <domain_name> <_> <_> <_> <_> <_> <error_reason> <_> <_> <_> <_> <conn_trace_id> <_> <_> <_>"
First, we use the Stream filter with a stream, which is set in our log collector, and then we describe the field pattern itself.
If the fields at the end will definitely never be needed, they can be removed from the query altogether, i.e., simply do the following:
{stream="alb"}
| extract "<_> <_> <elb_id> <_> <_> <request_processing_time> <target_processing_time> <response_processing_time> <elb_status_code> <target_status_code> <received_bytes> <sent_bytes> <request_line> <user_agent> <_> <_> <_> <trace_id> <domain_name> <_> <_> <_> <_> <_> <error_reason> <_> <_> <_> <_> <conn_trace_id>"
extract_regexp pipe
We will need to measure response times and errors for specific endpoints of our Backend API, and for names of endpoints, the first part of the URI will be enough.
That is, from the line “https://staging.api.challenge.example.co:443/roadmap/media/123 HTTP/2.0” the only “/roadmap” should be taken.
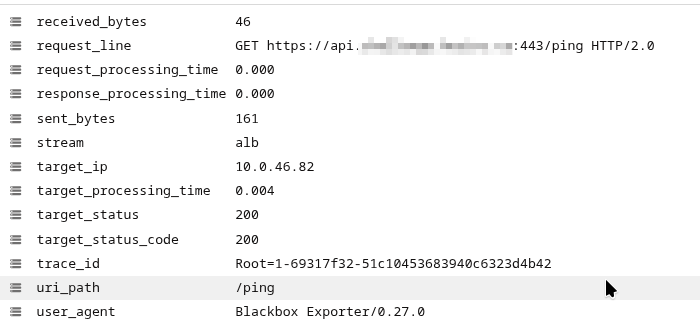
The request itself goes in the request_line field:
Here we can use extract_regexp pipe to get the first part after “/” and store the result in a regex named capture group with the name uri_path:
{stream="alb"}
| extract "<_> <_> <elb_id> <_> <_> <request_processing_time> <target_processing_time> <response_processing_time> <elb_status_code> <target_status_code> <received_bytes> <sent_bytes> <request_line> <user_agent> <_> <_> <_> <trace_id> <domain_name> <_> <_> <_> <_> <_> <error_reason> <_> <_> <_> <_> <conn_trace_id>"
| extract_regexp `.*:443(?P<uri_path>/[^/?]+).* HTTP` from request_line
For extract_regexp, specify the field that it will parse – from request_line, to avoid parsing the entire content of the _msg field.
Now we have the following result:
filter pipe
If we want to filter data, we can use the filter, to which we can pass a regular expression.
For example, to select only certain domains, use filter domain_name :~ "regex". Or, without regular expressions, use := "example.com", which will be faster.
But place the filter before extract_regexp to skip unnecessary records and avoid performing resource-intensive searches extract_regexp on unnecessary lines:
{stream="alb"}
| extract "<_> <_> <elb_id> <_> <_> <request_processing_time> <target_processing_time> <response_processing_time> <elb_status_code> <target_status_code> <received_bytes> <sent_bytes> <request_line> <user_agent> <_> <_> <_> <trace_id> <domain_name> <_> <_> <_> <_> <_> <error_reason> <_> <_> <_> <_> <conn_trace_id>"
| filter domain_name :~ ".+challenge.example.co|lightdash.example.co"
| extract_regexp `.*:443(?P<uri_path>/[^/?]+).* HTTP` from request_line
Or we can remove certain results, for example, delete all domains that contain a hyphen by the filter domain_name :!~ "-":
{stream="alb"}
| extract "<_> ... "
| filter domain_name :!~ "-"
| extract_regexp `.*:443(?P<uri_path>/[^/?]+).* HTTP` from request_line
stats pipe and stats pipe functions
And the final step is to obtain the results directly, which we will then use in the metrics.
For this purpose, we have the stats pipe and its functions, see all of them in the stats pipe functions documentation.
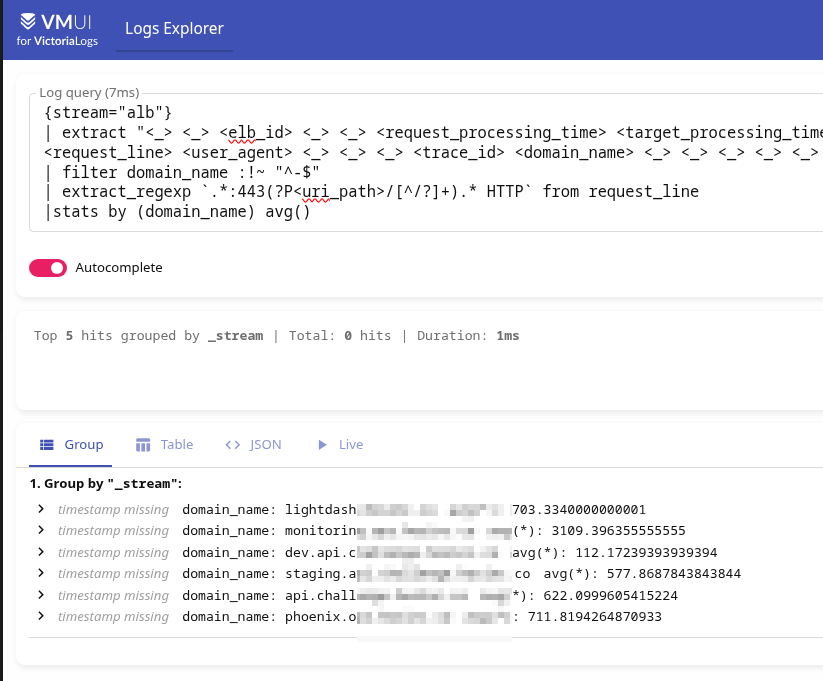
For example, avg():
{stream="alb"}
| extract "<_> <_> <elb_id> <_> <_> <request_processing_time> <target_processing_time> <response_processing_time> <elb_status_code> <target_status_code> <received_bytes> <sent_bytes> <request_line> <user_agent> <_> <_> <_> <trace_id> <domain_name> <_> <_> <_> <_> <_> <error_reason> <_> <_> <_> <_> <conn_trace_id>"
| filter domain_name :!~ "^-$"
| extract_regexp `.*:443(?P<uri_path>/[^/?]+).* HTTP` from request_line
|stats by (domain_name) avg()
Result:
But now avg() calculates values from all numeric log fields:
avg returns the average value over the given numeric log fields .
Therefore, there is zero benefit from this.
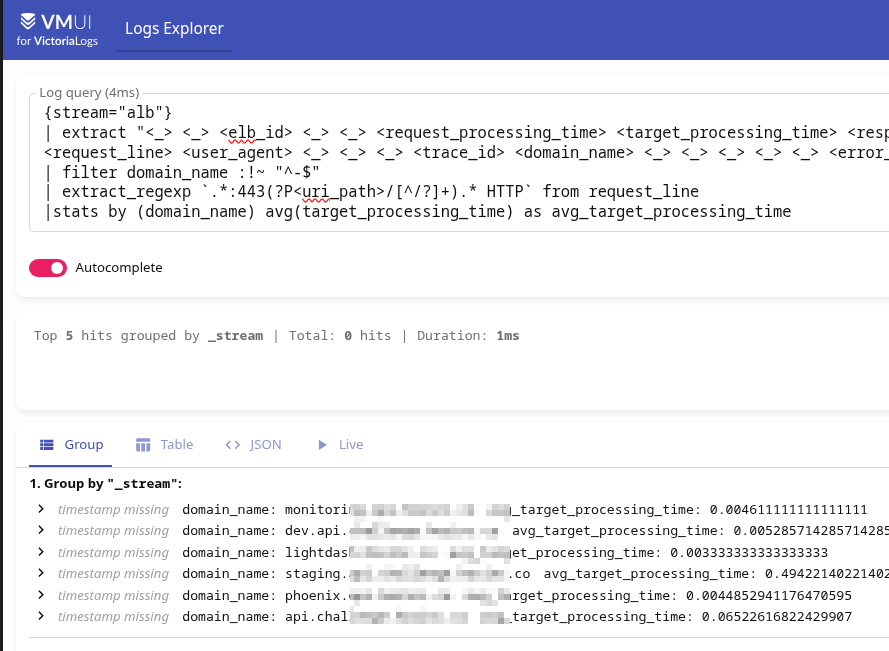
Instead, we can specify which field to use by passing it as an argument to avg() – avg(target_processing_time):
{stream="alb"}...

|stats by (domain_name) avg(target_processing_time) as avg_target_processing_time
Result:
math pipe
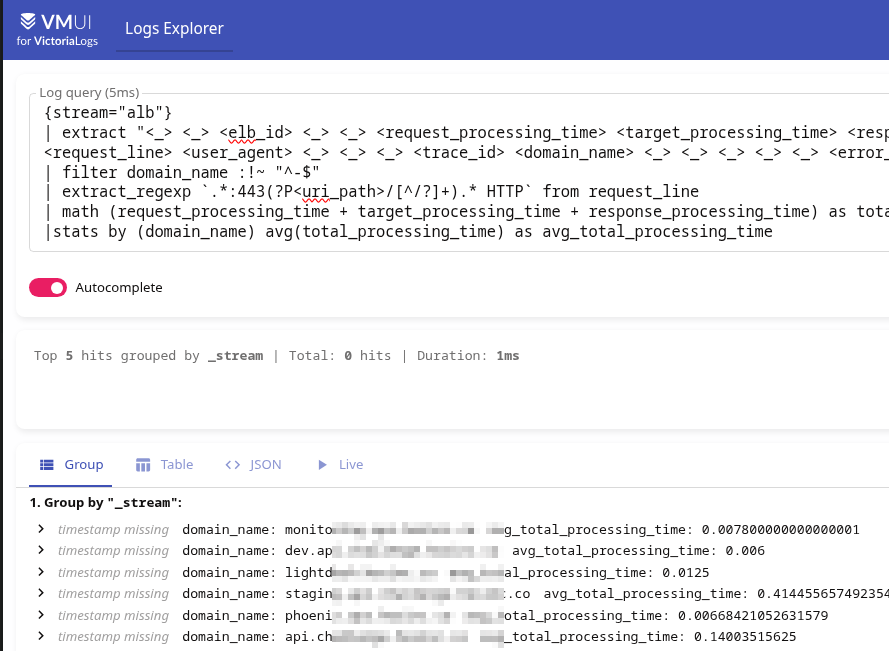
I would also like to see the total request processing time, but in the ALB fields we have three separate values: request_processing_time, target_processing_time, and response_processing_time.
We don’t want to create three separate metrics and then calculate them in Grafana, so we can make it easier by using LogsQL math(): first, we calculate the sum of all three fields, and then we pass the result to avg():
{stream="alb"}
...
| math (request_processing_time + target_processing_time + response_processing_time) as total_processing_time
|stats by (domain_name) avg(total_processing_time) as avg_total_processing_time
Result:
Although in reality it doesn’t make sense, because in 99.9% of cases, 99.9% of the time is still taken up by target_processing_time.
AWS Athena and AWS ALB logs
“Trust, but verify.”
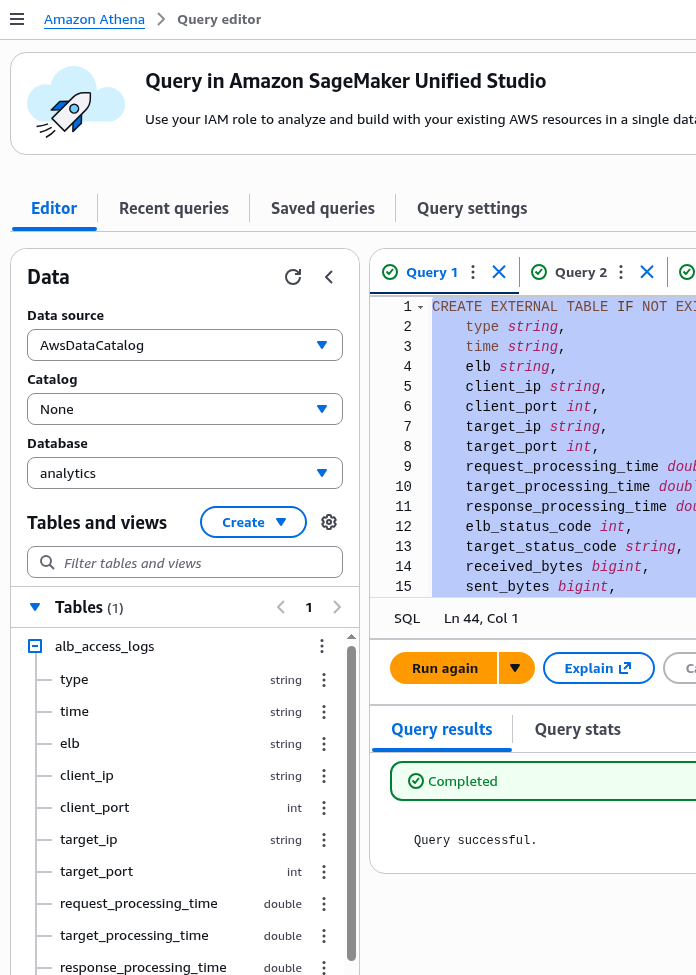
So let’s create a table in AWS Athena, and then we’ll use it to make queries for verification.
Documentation – Query Application Load Balancer logs.
Processing request:
CREATE EXTERNAL TABLE IF NOT EXISTS alb_access_logs (
    type string,
    time string,
    elb string,
    client_ip string,
    client_port int,
    target_ip string,
    target_port int,
    request_processing_time double,
    target_processing_time double,
    response_processing_time double,
    elb_status_code int,
    target_status_code string,
    received_bytes bigint,
    sent_bytes bigint,
    request_verb string,
    request_url string,
    request_proto string,
    user_agent string,
    ssl_cipher string,
    ssl_protocol string,
    target_group_arn string,
    trace_id string,
    domain_name string,
    chosen_cert_arn string,
    matched_rule_priority string,
    request_creation_time string,
    actions_executed string,
    redirect_url string,
    lambda_error_reason string,
    target_port_list string,
    target_status_code_list string,
    classification string,
    classification_reason string,
    conn_trace_id string
)
ROW FORMAT SERDE 'org.apache.hadoop.hive.serde2.RegexSerDe'
WITH SERDEPROPERTIES (
    'serialization.format' = '1',
    'input.regex' =
'([^ ]*) ([^ ]*) ([^ ]*) ([^ ]*):([0-9]*) ([^ ]*)[:-]([0-9]*) ([-.0-9]*) ([-.0-9]*) ([-.0-9]*) (|[-0-9]*) (-|[-0-9]*) ([-0-9]*) ([-0-9]*) \"([^ ]*) (.*) (- |[^ ]*)\" \"([^\"]*)\" ([A-Z0-9-_]+) ([A-Za-z0-9.-]*) ([^ ]*) \"([^\"]*)\" \"([^\"]*)\" \"([^\"]*)\" ([-.0-9]*) ([^ ]*) \"([^\"]*)\" \"([^\"]*)\" \"([^ ]*)\" \"([^\\s]+?)\" \"([^\\s]+)\" \"([^ ]*)\" \"([^ ]*)\" ?([^ ]*)? ?( .*)?'
)
LOCATION 's3://ops-1-33-devops-ingress-ops-alb-loki-logs/AWSLogs/492***148/elasticloadbalancing/us-east-1/';
Now we have a table that allows us to execute SQL queries on logs stored in S3:
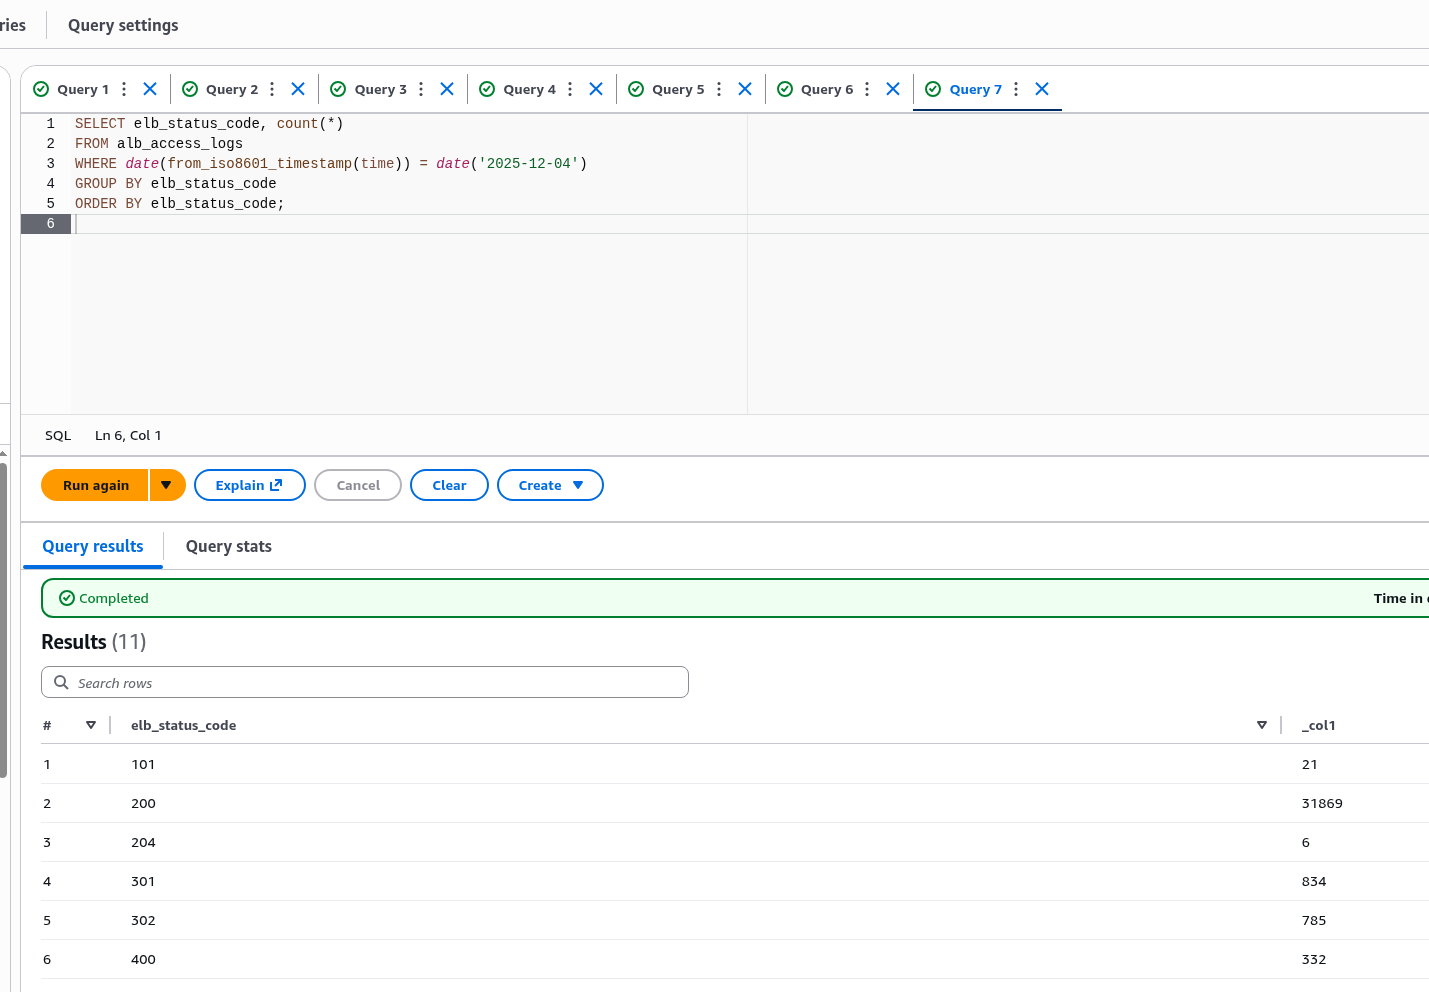
Check the fields:
SELECT elb_status_code, count(*)
FROM alb_access_logs
WHERE date(from_iso8601_timestamp(time)) = date('2025-12-04')
GROUP BY elb_status_code
ORDER BY elb_status_code;
Result:
And for additional information, we’ll use metrics from CloudWatch.
Recording Rules with VictoriaLogs
Now that we have figured out how to get the fields and have formed the fields, we can move on to Recording Rules and metrics.
Documentation – Recording rules.
AWS ALB logs and the 5-minute delay issue
But before you start writing rules, there is one thing that needs to be clarified:
- our logs from S3 are collected once every 5 minutes (“ELB publishes a log file for each load balancer node every 5 minutes“, see Access log files)
- default Recording Rules evaluation time minute (see Configuration)
- and if the moment of rule execution does not coincide with the moment of log parser launch and there are no logs in VictoriaLogs at that moment, then our rule will not work and will not create anything
However, for such cases, we can use eval_delay in the Rules group settings, for example:
apiVersion: operator.victoriametrics.com/v1beta1
kind: VMRule
metadata:
  name: vmlogs-alert-rules
spec:
  groups:
    - name: VM-ALB-logs-Test
      type: vlogs
      eval_delay: 15m
...
Then the task that was supposed to start at, for example, 12:00:00 will start at 12:15:00, but it will search for logs in the time interval 12:00:00 – 12:01:00.
And in the in logs, in our specific case, the timestamp is parsed from the logs themselves, so in VictoriaLogs the time will be the same as it was saved by the Load Balancer itself.
Planning Recording Rules
Let’s go back to the beginning – what we want to see:
- 4xx errors – ALB and target
- 5xx errors – ALB and target
- total number of requests to ALB and specific endpoints of our Backend API
- total response time
- target response time at specific endpoints
In other words, the task boils down to three indicators: the number of errors, the number of requests, and the response time.
How can we do this with Recording Rules and metrics:
- 4xx and 5xx errors in the
elb_status_codefields:- with the filter
filter elb_status_code :~ "40[1-4] |50[0-4]"we get all logs that containelb_status_codewith 4xx or 5xx - then with
statsandrate ()we count the number of log records found that contained 4xx or 5xx errors - then in dashboards and alerts we filter by 4xx or 5xx (although you can also create separate metrics)
- with the filter
target_status_code– similarly- total number of requests per second per domain:
- each log entry == separate HTTP query
- so we can simply do
stats by (elb_id, domain_name) rate()– group byelb_id,domain_name, so that we can then have filters in Grafana and alerts
- total number of requests to the endpoint
- similarly, only add
uri_path–stats by (elb_id, domain_name, uri_path) rate() - in
uri_pathwe only have the first part of the request, there are not so many different ones, so there will be no problems with high cardinality in VictoriaLogs
- similarly, only add
- ALB total response time and at specific endpoints – there are options here 🙂 see below
Keep in mind high cardinality in VictoriaMetrics: everything we use in stats by () will then be saved in metric labels, so there is no point in grouping by all sorts of trace_id – if necessary, this can be checked in the logs themselves, and we don’t need it in alerts and Grafana.
See also VictoriaMetrics: Churn Rate, High cardinality, metrcis, and IndexDB.
Let’s go.
ALB Requests Rate rule
Let’s start with the simplest one: just count how many records were received during the last evaluation interval, i.e., 1 minute, then use rate() to get the number of changes per second:
apiVersion: operator.victoriametrics.com/v1beta1
kind: VMRule
metadata:
  name: vmlogs-alert-rules
spec:
  groups:
    - name: VM-ALB-logs
      type: vlogs
      eval_delay: 15m
      interval: 1m
        - record: vmlogs:alb:stats:elb_requests_total:rate
          debug: true
          expr: |
            {stream="alb"}
            | extract "<_> <_> <elb_id> <_> <_> <request_processing_time> <target_processing_time> <response_processing_time> <elb_status_code> <target_status_code> <received_bytes> <sent_bytes> <request_line> <user_agent> <_> <_> <_> <trace_id> <domain_name> <_> <_> <_> <_> <_> <error_reason> <_> <_> <_> <_> <conn_trace_id> <_> <_> <_>"
            | stats by (elb_id, domain_name) rate() as elb_requests_rate
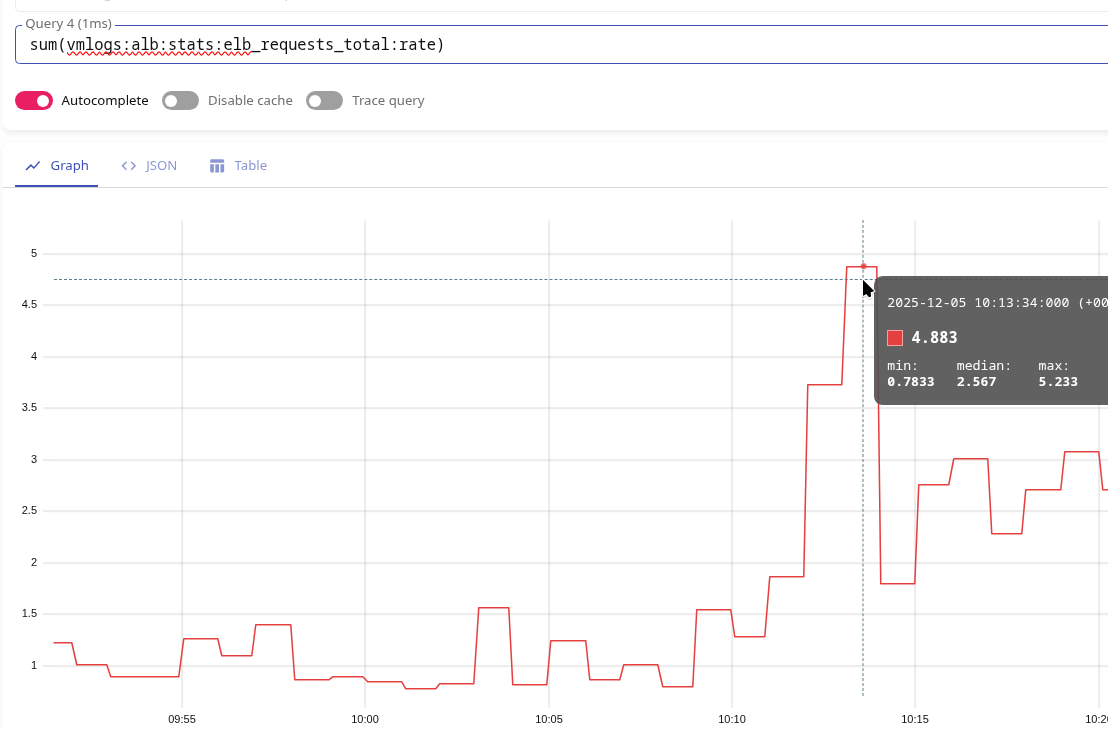
Deploy, wait 5-10 minutes, check in VictoriaMetrics:
At 10:13, we have a value of 4.83.
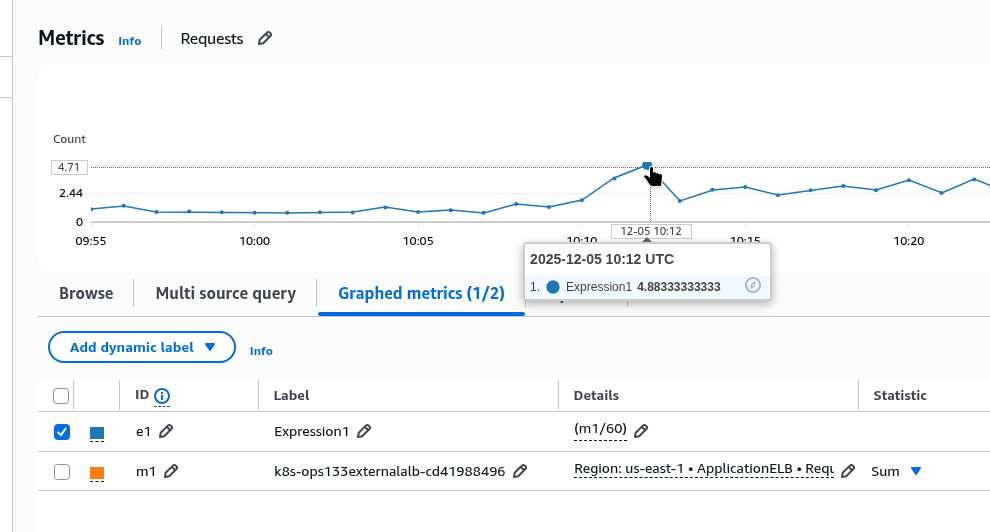
Check in CloudWatch, where we simply do “sum requests in 1 minute /60” with math:
The same 4.83, but at 10:12.
We can also check with Athena, which we prepared earlier with the following query:
SELECT
  date_trunc('minute', from_iso8601_timestamp(time)) AS minute,
  count(*) / 60.0 AS rps_estimated
FROM alb_access_logs
WHERE from_iso8601_timestamp(time) >= now() - interval '1' hour
GROUP BY 1
ORDER BY 1 DESC;
The same numbers, but also at 10:12:
ALB 4xx/5xx Errors rule
Next, let’s calculate the per-second error rate using the same logic, but adding the filter elb_status_code :~ "40[1-4]":
- record: vmlogs:alb:stats:elb_errors:4xx:rate
  debug: false
  expr: |
    {stream="alb"}
    | extract "<_> <_> <elb_id> <_> <_> <request_processing_time> <target_processing_time> <response_processing_time> <elb_status_code> <target_status_code> <received_bytes> <sent_bytes> <request_line> <user_agent> <_> <_> <_> <trace_id> <domain_name> <_> <_> <_> <_> <_> <error_reason> <_> <_> <_> <_> <conn_trace_id> <_> <_> <_>"
    | filter elb_status_code :~ "40[1-4]"
    | extract_regexp `.*:443(?P<uri_path>/[^/?]+).* HTTP` from request_line
    | stats by (elb_id, elb_status_code, domain_name, uri_path) rate() as elb_4xx_errors_rate
Deploy, wait, check in VictoriaMetrics:
We have a value of 0.91 at 11:07.
In CloudWatch, it’s the same thing, only 1 minute earlier again:
ALB Target Processing Time rule
Next, we want to get what we have in CloudWatch in the TargetResponseTime metric, but also be able to get the total time across the entire LoadBalancer and for individual URIs.
Problem with stats by () and avg()
The first solution that came to mind was to simply take the average for each endpoint, then take the average of all the values obtained – and the result should be +/- the same as in CloudWatch TargetResponseTime with Average.
But if you make the metric like this:
- record: vmlogs:alb:stats:elb_target_processing_time:avg
  debug: false
  expr: |
    {stream="alb"}
    ...
    | stats by (elb_id, domain_name, uri_path) avg(target_processing_time) as avg_target_processing_time
And then, to get the overall average value in VictoriaMetrics, execute avg():
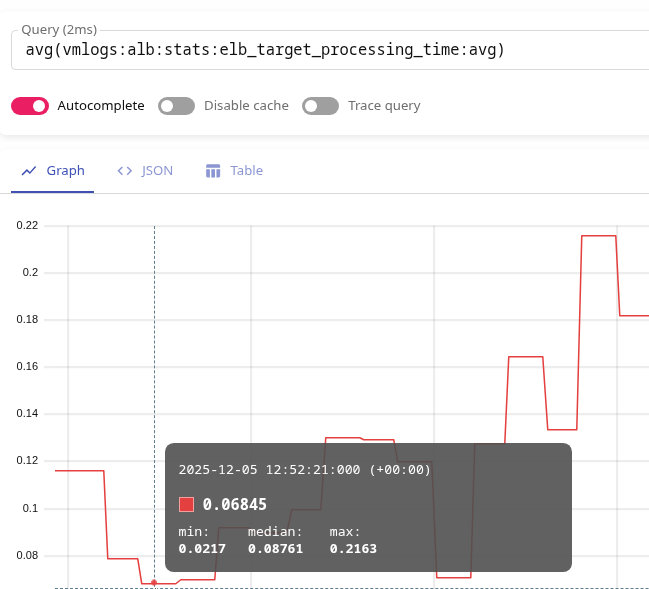
avg(vmlogs:alb:stats:elb_target_processing_time:avg)
Then the data in VictoriaMetrics and CloudWatch will be different.
For example, at 12:52 p.m., VictoriaMetrics shows a value of 0.06:
But in CloudWatch, the Target Response Time and Average for 1 minute at 12:21 will be 0.11:
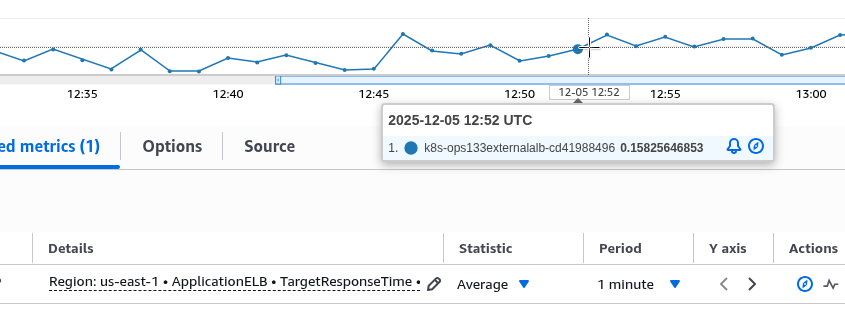
Or 0.15 at 12:52:
It’s not at all like what we see in VictoriaMetrics.
Okay, then maybe we should just take the sum of all our avg(by uri_path)?
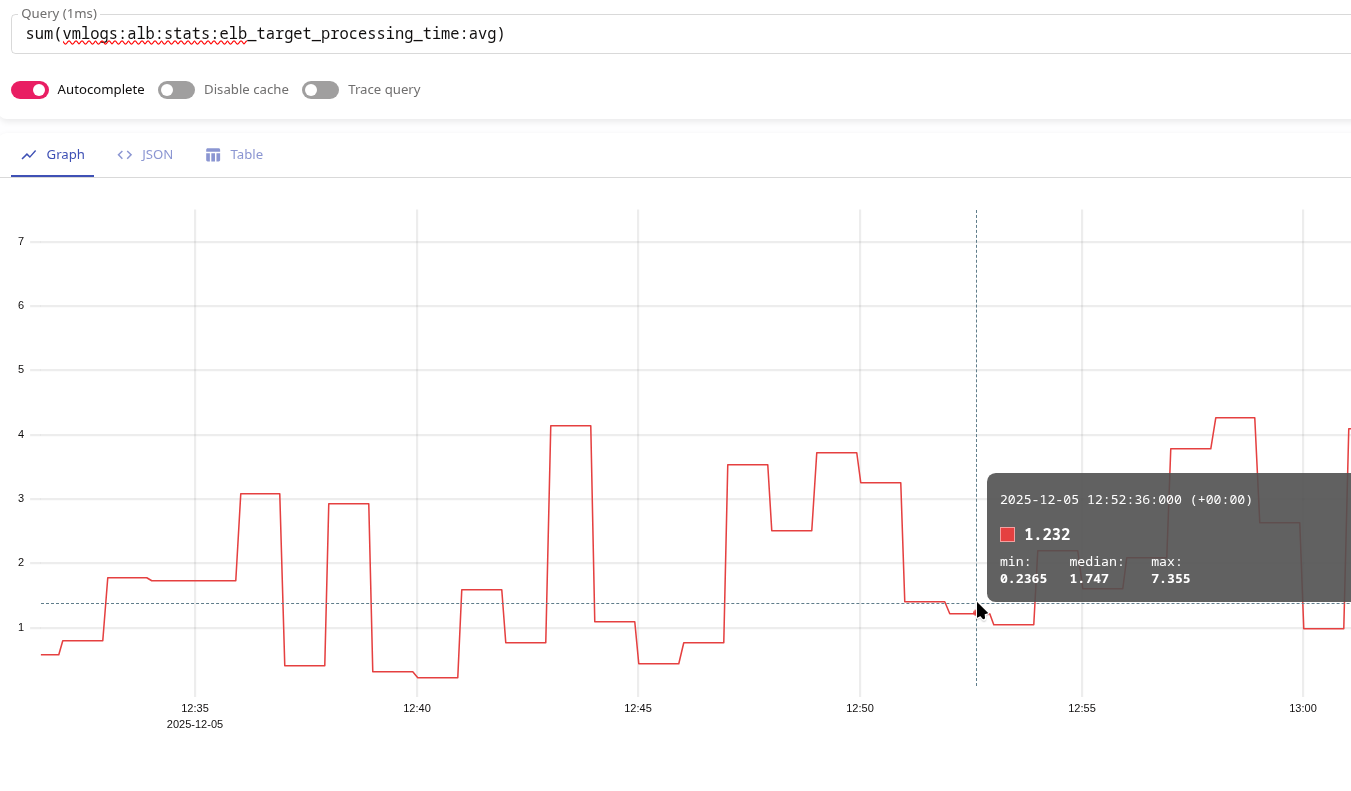
sum(vmlogs:alb:stats:elb_target_processing_time:avg)
But then at 12:52 the result will be 1.23 overall:
Why is this the case?
Because in our stats(), results are calculated for each group (elb_id, domain_name, uri_path).
That is, if we take these examples and use only uri_path:
/uri-1: 200 requests by 0.1 second:- sum: 200*0.1 == 20 sec
- avg: 200*0.1/200 == 0.1 sec
/uri-2: 10 requests by 2 second:- sum: 10*2 == 20 sec
- avg: 10*2/10 == 2 sec
If we calculate the result as avg(vmlogs:alb:stats:elb_target_processing_time:avg), then to obtain avg(), we will take the value from each metric:
vmlogs:alb:stats:elb_target_processing_time:avg{uri_path="/uri-1"}== 0.1 secvmlogs:alb:stats:elb_target_processing_time:avg{uri_path="/uri-2"}== 2 sec
And divide by the number of metrics obtained, i.e., by 2, which gives us:
- (0.1 sec + 2 sec) / 2 == 1.05 sec
If we calculate as sum(vmlogs:alb:stats:elb_target_processing_time:avg) – then for the same pair:
- vmlogs:alb:stats:elb_target_processing_time:avg{uri_path=”/uri-1″} == 0.1 sec
vmlogs:alb:stats:elb_target_processing_time:avg{uri_path="/uri-2"}== 2 sec
We will get:
- (0.1 sec + 2 sec) = 2.1 sec
Average values in CloudWatch
And how does CloudWatch calculate Average in general, and by TargetResponseTime?
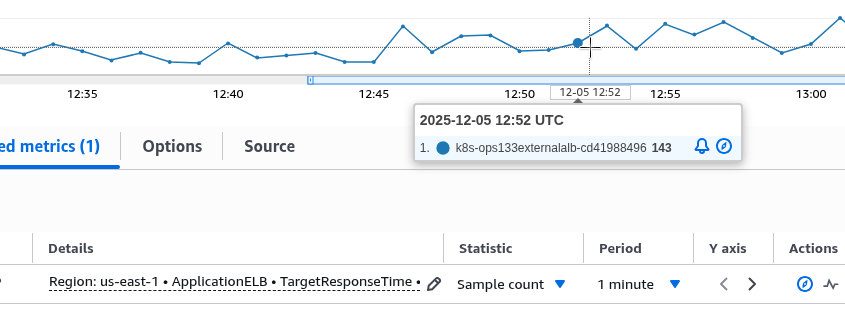
It takes the number of metrics received, Sample count – at 12:52 it was 143:
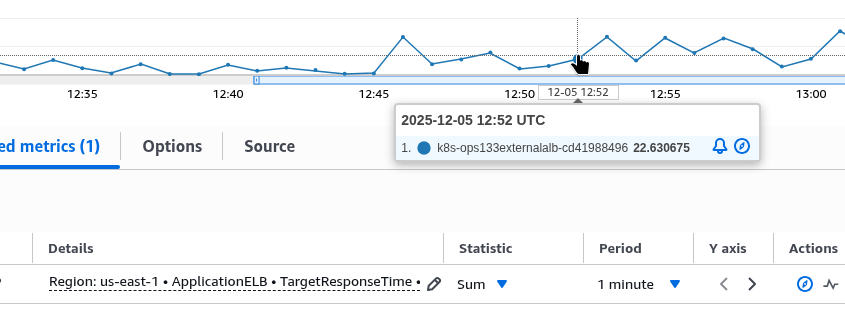
Then it takes the sum of all the metrics received, Sum – at 12:52 it was 22:
And divides the sum by the number of sampels – 22/143 == 0.1538:
Or, returning to our example above, this is the sum of time at both endpoints divided by the total number of requests: (/uri-1 sum + /uri-2 sum) / (/uri-1 requests + /uri-1 requests):
- (20+20)/210 == 0.19
That is, the real average response time of our hypothetical ALB is 0.19 seconds, not 1.05 in the case of avg() or, even more so, not 2.1 seconds in the case of sum().
So, if we want to have both the overall average time across the entire ALB and the average time for each endpoint, we have two options:
- or in
stats()we need to take the sum, notavg(), and then divide the result by the total number of requests - or have a dedicated metric for the overall average time and a dedicated one for the average time for each endpoint
In the first case, it may look like this:
- record: vmlogs:alb:stats:elb_target_processing_time:sum
  debug: false
  expr: |
    {stream="alb"}
    | extract "<_> <_> <elb_id> <_> <_> <request_processing_time> <target_processing_time> <response_processing_time> <elb_status_code> <target_status_code> <received_bytes> <sent_bytes> <request_line> <user_agent> <_> <_> <_> <trace_id> <domain_name> <_> <_> <_> <_> <_> <error_reason> <_> <_> <_> <_> <conn_trace_id> <_> <_> <_>"
    | extract_regexp `.*:443(?P<uri_path>/[^/?]+).* HTTP` from request_line
    | filter target_processing_time :! "-1"
    | stats by (elb_id, domain_name, uri_path) sum(target_processing_time) as sum_target_processing_time

- record: vmlogs:alb:stats:elb_target_processing_time:count
  debug: false
  expr: |
    {stream="alb"}
    | extract "<_> <_> <elb_id> <_> <_> <request_processing_time> <target_processing_time> <response_processing_time> <elb_status_code> <target_status_code> <received_bytes> <sent_bytes> <request_line> <user_agent> <_> <_> <_> <trace_id> <domain_name> <_> <_> <_> <_> <_> <error_reason> <_> <_> <_> <_> <conn_trace_id> <_> <_> <_>"
    | extract_regexp `.*:443(?P<uri_path>/[^/?]+).* HTTP` from request_line
    | filter target_processing_time :! "-1"
    | stats by (elb_id, domain_name, uri_path) count() as count_requests
Instead of vmlogs:alb:stats:elb_target_processing_time:count, we could use vmlogs:alb:stats:elb_requests_total:count, which we did above – but in the target_processing_time metric we remove the value “-1”, which occurs in target_processing_time if the connection is broken or ends with an error, while in vmlogs:alb:stats:elb_requests_total:count we have all requests without exception.
With these two metrics, we can obtain the average response time for each endpoint as follows:
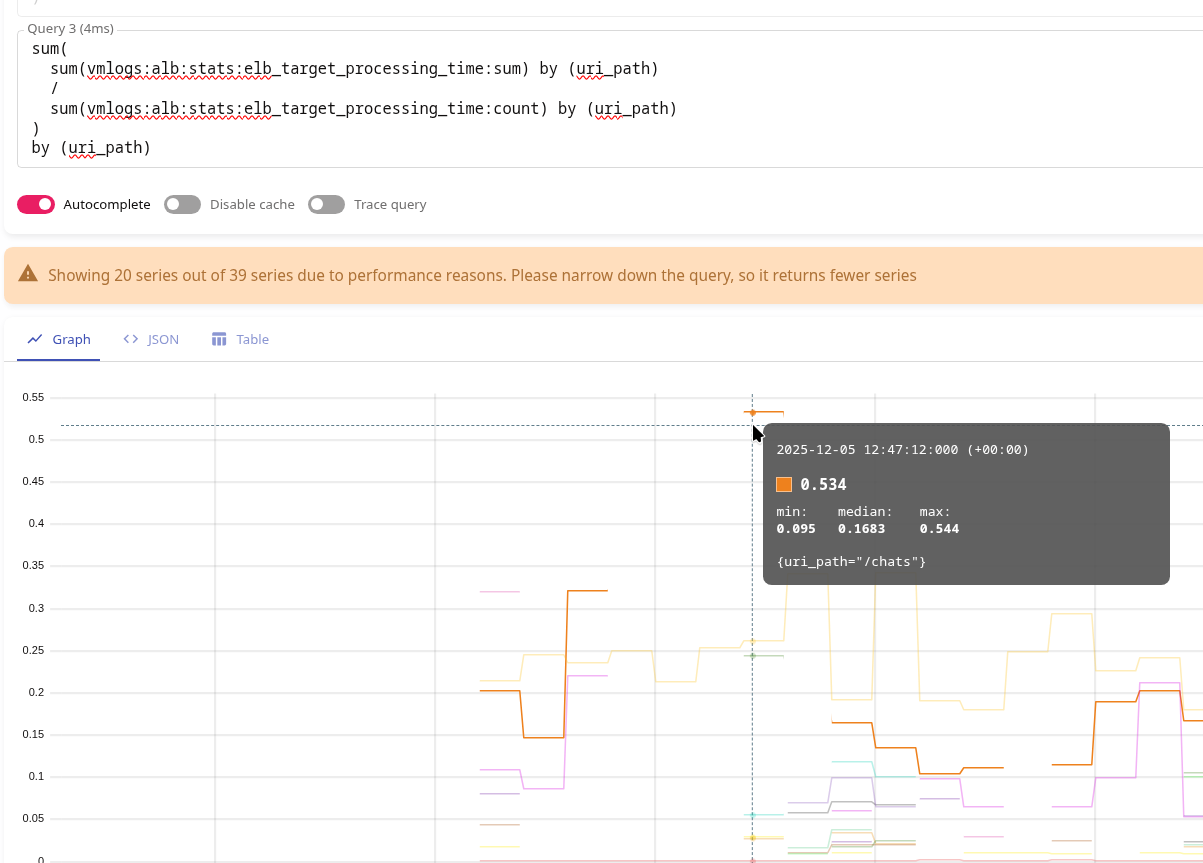
sum(
  sum(vmlogs:alb:stats:elb_target_processing_time:sum) by (uri_path)
  /
  sum(vmlogs:alb:stats:elb_target_processing_time:count) by (uri_path)
)
by (uri_path)
Here, at 12:47, the endpoint /chats responded in 0.54 seconds.
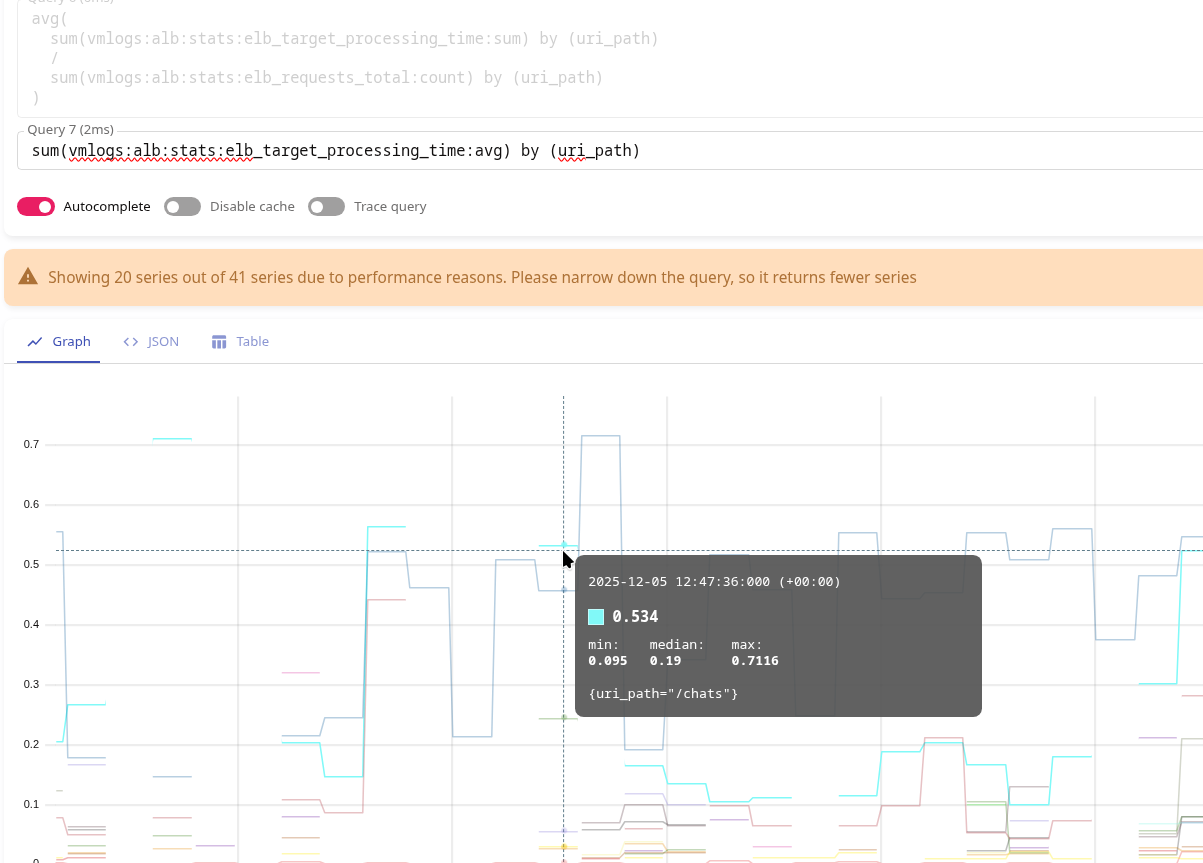
And the same value will be in the very first option:
- record: vmlogs:alb:stats:elb_target_processing_time:avg
  debug: false
  expr: |
    {stream="alb"}
    | extract "<_> <_> <elb_id> <_> <_> <request_processing_time> <target_processing_time> <response_processing_time> <elb_status_code> <target_status_code> <received_bytes> <sent_bytes> <request_line> <user_agent> <_> <_> <_> <trace_id> <domain_name> <_> <_> <_> <_> <_> <error_reason> <_> <_> <_> <_> <conn_trace_id> <_> <_> <_>"
    | extract_regexp `.*:443(?P<uri_path>/[^/?]+).* HTTP` from request_line
    | filter target_processing_time :! "-1"
    | stats by (elb_id, domain_name, uri_path) avg(target_processing_time) as avg_target_processing_time
At 12:47 p.m., we have the same 0.54 on /chats:
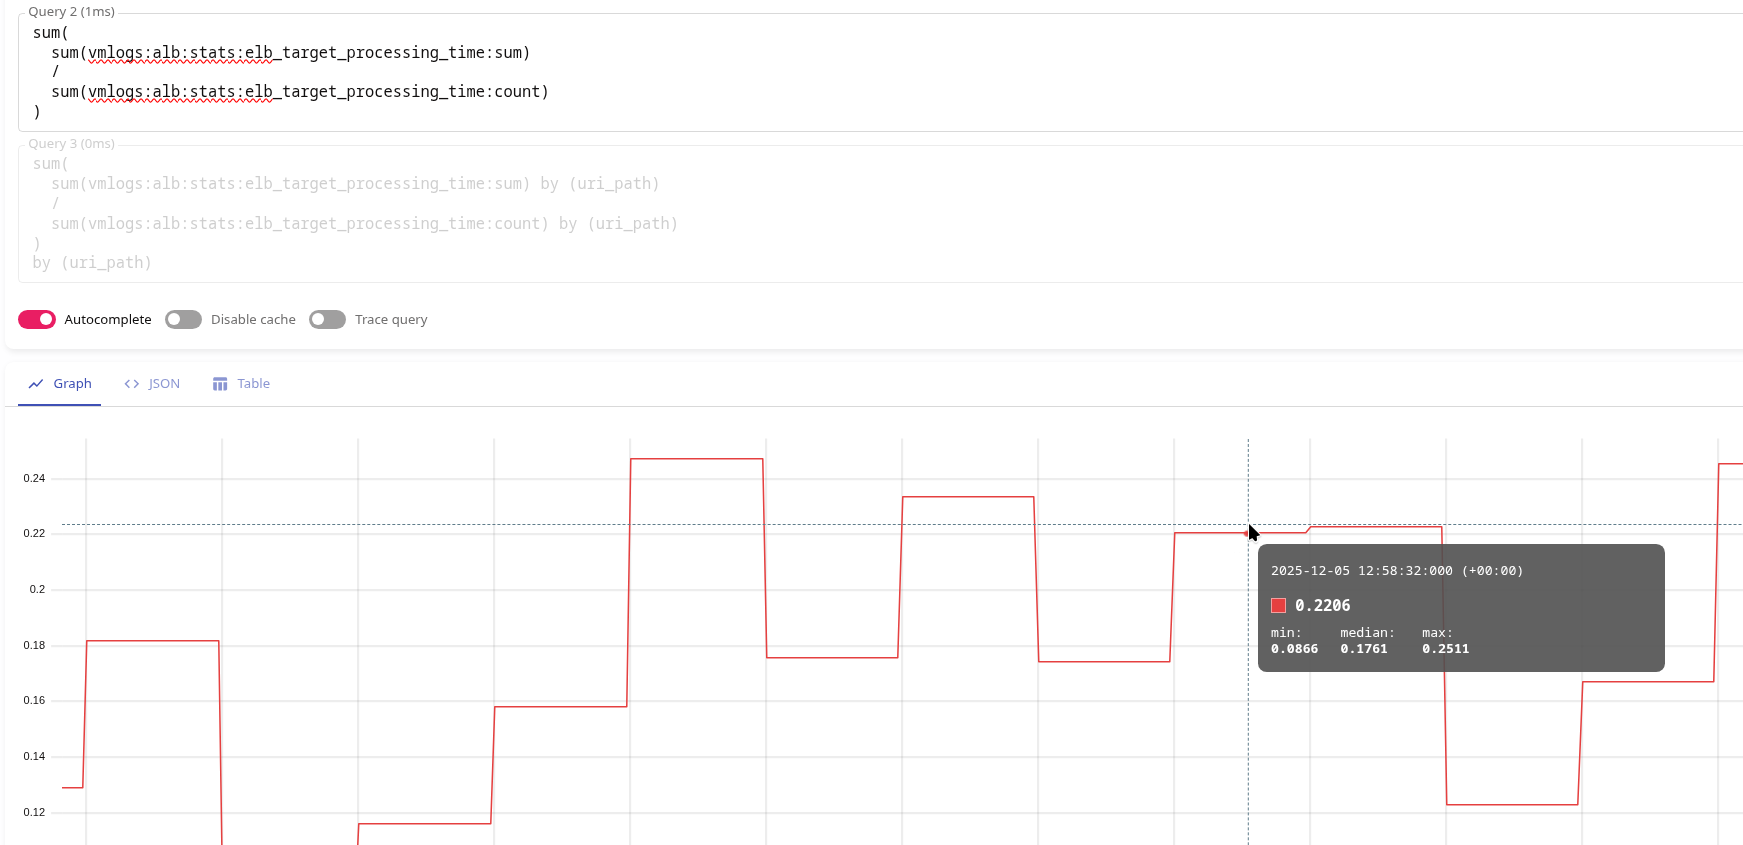
To obtain the average total response time across the entire load balancer, we can use the metrics vmlogs:alb:stats:elb_target_processing_time:sum and vmlogs:alb:stats:elb_target_processing_time:count as follows:
sum(
  sum(vmlogs:alb:stats:elb_target_processing_time:sum)
  /
  sum(vmlogs:alb:stats:elb_target_processing_time:count)
)
Here, we have 0.22 at 12:58:
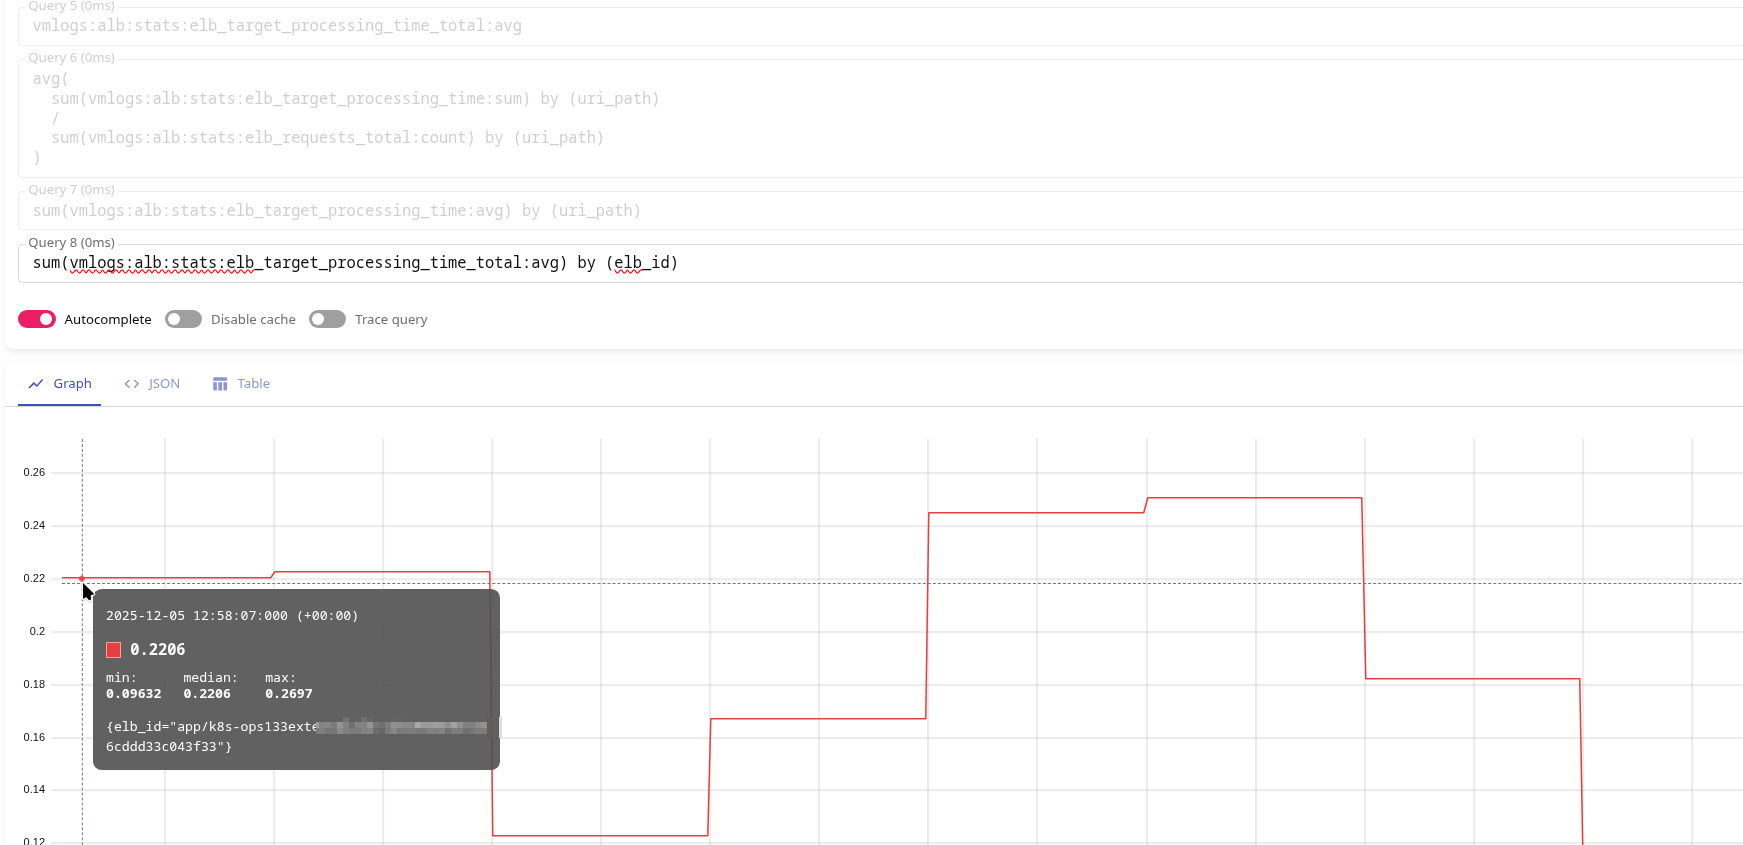
Or simply create a separate metric with stats by (elb_id) avg():
- record: vmlogs:alb:stats:elb_target_processing_time_total:avg
  debug: false
  expr: |
    {stream="alb"}
    | extract "<_> <_> <elb_id> <_> <_> <request_processing_time> <target_processing_time> <response_processing_time> <elb_status_code> <target_status_code> <received_bytes> <sent_bytes> <request_line> <user_agent> <_> <_> <_> <trace_id> <domain_name> <_> <_> <_> <_> <_> <error_reason> <_> <_> <_> <_> <conn_trace_id> <_> <_> <_>"
    | extract_regexp `.*:443(?P<uri_path>/[^/?]+).* HTTP` from request_line
    | filter target_processing_time :! "-1"
    | stats by (elb_id) avg(target_processing_time) as avg_target_processing_time
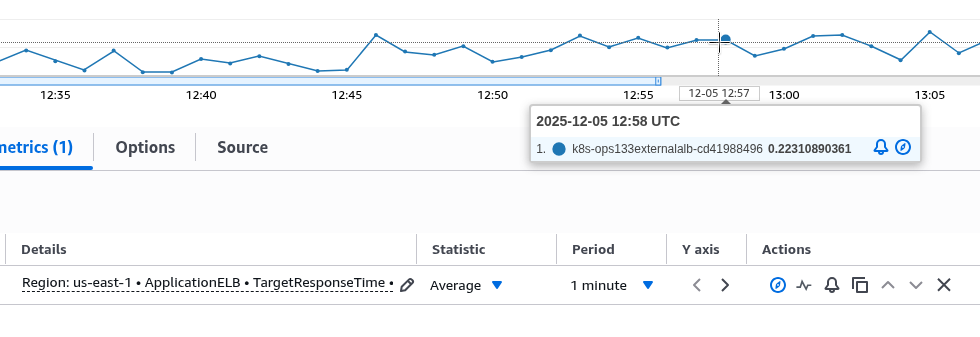
Which will return the same 0.22 at 12:58:
And the same value will be in CloudWatch:
And actually, that’s all for today.
Now we can add other metrics, alerts, and customize the Grafana dashboard.
![]()

