 Currently, to collect metrics from the AWS CloudWatch we are using AWS’s own
 cloudwatch-exporter, see the Prometheus: CloudWatch exporter — сбор метрик из AWS и графики в Grafana post (in Rus), but it has a few gaps:
- it’s written in Java, so uses CPU/memory of the monitoring host
- doesn’t scrapes AWS tags from resources
- uses the
GetMetricStatisticsmethod to grab the data - can collect metrics from an only one AWS region, e.g. us-east-1 or eu-west-2
To mitigate those issue – let’s try to use the yet-another-cloudwatch-exporter instead.
Contents
AWS CloudWatch – gaps
Tags
The first thing which is making the “default” exporter uncomfortable is the fact that it will not grab the tags from resources in AWS.
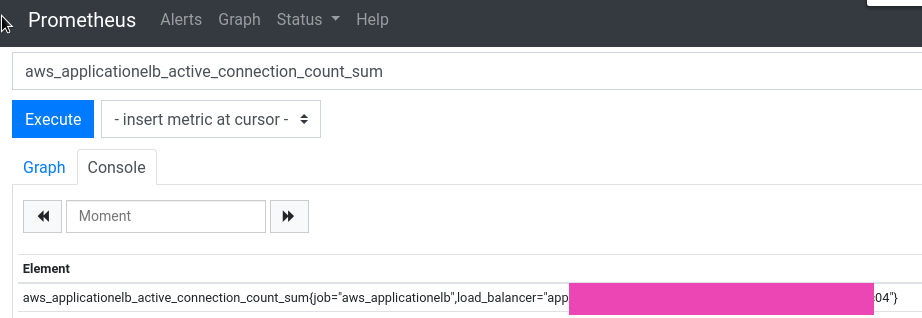
For example, an Application Load Balancer metric will be returned with the only such label:
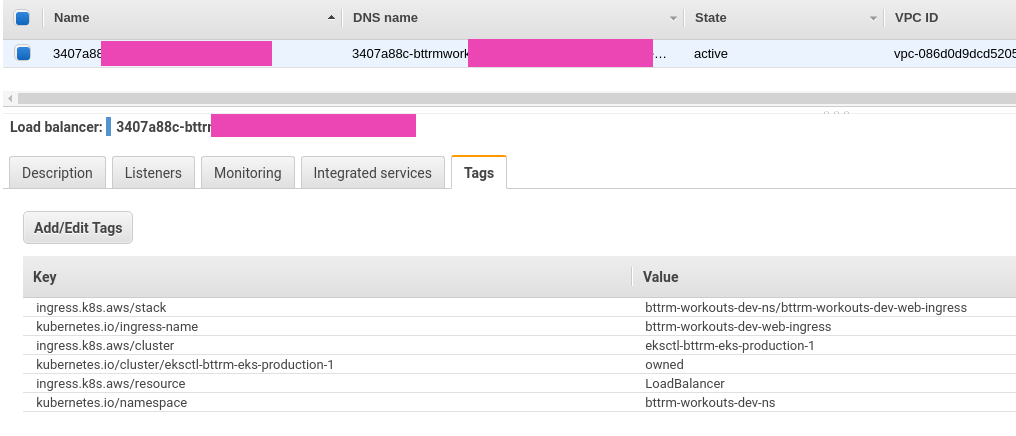
However, if you’ll check it in the AWS Console you’ll find much more tags there:
And at this moment there is no way to use those tags from Grafana.
GetMetricStatistics vs GetMetricData
The other issue with the default exporter is the API method used to collect data – GetMetricStatistics.
Two years ago was there created an issue Reduce cost of api operations by using GetMetricData API instead of GetMetricStatistics API – but it still wasn’t applied.
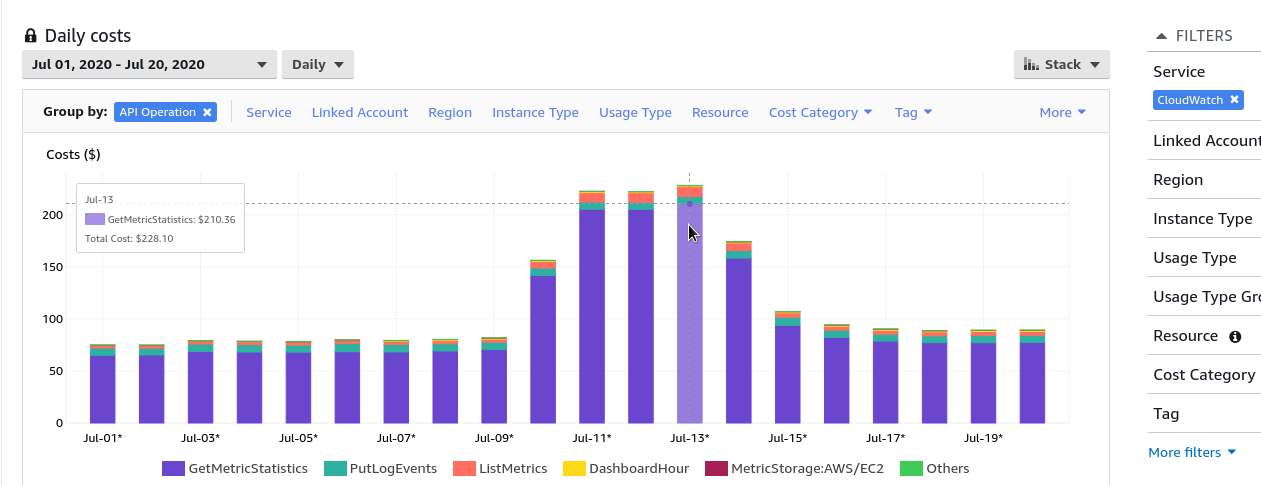
So, the problem with the GetMetricStatistics is how it collects metrics – for each metric your cloudwatch-exporter will cause a dedicated API-call.
E.g. if you have 100 EC2 instances, and each will have 10 metrics – cloudwatch-exporter will perform 1000 every 60 seconds which will result in big expenses for you:
Unlike the AWS cloudwatch-exporter, the yet-another-cloudwatch-exporter uses the GetMetricData API call which allows us to get up to 500 metrics in the only one API-call.
Running yet-another-cloudwatch-exporter
Let’s try to spin it up and to get data.
Create a new file with AWS credentials for the exporter, let’s name it alb-cred:
[default]
aws_region = us-east-2
aws_access_key_id = AKI***D4Q
aws_secret_access_key = QUC***BTI
Or, you can use the AWS EC2 Instance Profile but its policy has to have the following permissions:
{
    "Version": "2012-10-17",
    "Statement": [
        {
            "Sid": "CloudWatchExporterPolicy",
            "Effect": "Allow",
            "Action": [
                "tag:GetResources",
                "cloudwatch:ListTagsForResource",
                "cloudwatch:GetMetricData",
                "cloudwatch:ListMetrics"
            ],
            "Resource": "*"
        }
    ]
}
Now, create a file with the exporter’s settings:
discovery:
  jobs:
  - regions:
      - us-east-2
    type: elb
    enableMetricData: true
    metrics:
      - name: ActiveConnectionCount
        statistics:
        - Sum
        period: 300
        length: 600
And run it with Docker:
[simterm]
$ docker run -ti -p 5000:5000 -v /home/setevoy/Temp/alb-cred:/exporter/.aws/credentials -v /home/setevoy/Temp/config.yaml:/tmp/config.yml quay.io/invisionag/yet-another-cloudwatch-exporter:v0.19.1-alpha
{"level":"info","msg":"Parse config..","time":"2020-07-21T10:59:49Z"}
{"level":"info","msg":"Startup completed","time":"2020-07-21T10:59:49Z"}
[/simterm]
Check the metrics:
[simterm]
$ curl localhost:5000/metrics
# HELP aws_elb_info Help is not implemented yet.
# TYPE aws_elb_info gauge
aws_elb_info{name="arn:aws:elasticloadbalancing:us-east-2:534***385:loadbalancer/app/fea06ba9-eksstage1mealplan-a584/***",tag_Env="",tag_Name="",tag_Stack="",tag_ingress_k8s_aws_cluster="bttrm-eks-stage-1",tag_ingress_k8s_
aws_resource="LoadBalancer",tag_ingress_k8s_aws_stack="eks-stage-1-mealplan-api-ns/mealplan-api-ingress",tag_kubernetes_io_cluster_bttrm_eks_dev_0="",tag_kubernetes_io_cluster_bttrm_eks_dev_1="",tag_kubernetes_io_cluster_bttrm_eks_prod_0=
"",tag_kubernetes_io_cluster_bttrm_eks_prod_1="",tag_kubernetes_io_cluster_bttrm_eks_stage_1="owned",tag_kubernetes_io_cluster_eksctl_bttrm_eks_production_1="",tag_kubernetes_io_ingress_name="mealplan-api-ingress",tag_kubernetes_io_namesp
ace="eks-stage-1-mealplan-api-ns",tag_kubernetes_io_service_name=""} 0
...
[/simterm]
And you can see now that every metric has also all the AWS Tags attached.
yet-another-cloudwatch-exporter configuration
exportedTagsOnMetrics
If you don’t need all the tags – you can limit which tags will be attached to the metrics using the exportedTagsOnMetrics.
For example, let’s leave the only following tags:
discovery:
  exportedTagsOnMetrics:
    alb:
      - Name
      - kubernetes.io/service-name
      - ingress.k8s.aws/cluster
      - kubernetes.io/namespace
...
SeacrhTags
Also, you can set a limit to specify from which resources the exporter will grab metrics – analog of the tag_selections in the AWS cloudwatch-exporter.
Let’s say, we want to get metrics from the only “bttrm-eks-prod-1” EKScluster.
Then you can specify the “ingress.k8s.aws/cluster” as the TAG key, and the “bttrm-eks-prod-1” as its value:
discovery:
  exportedTagsOnMetrics:
    alb:
      - Name
      - kubernetes.io/service-name
      - ingress.k8s.aws/cluster
      - kubernetes.io/namespace
  jobs:
  - type: alb
    regions:
      - us-east-2
    searchTags:
      - Key: ingress.k8s.aws/cluster
        Value: bttrm-eks-prod-1
    metrics:
      - name: UnHealthyHostCount
        statistics: [Maximum]
        period: 60
        length: 600
      - name: ActiveConnectionCount
        statistics: [Sum]
        period: 300
        length: 600
Restart and check it:
[simterm]
$ curl localhost:5000/metrics
# HELP aws_alb_active_connection_count_sum Help is not implemented yet.
# TYPE aws_alb_active_connection_count_sum gauge
aws_alb_active_connection_count_sum{dimension_LoadBalancer="app/bcf678a9-eksprod1bttrmapps-447a/***",name="arn:aws:elasticloadbalancing:us-east-2:534***385:loadbalancer/app/bcf678a9-eksprod1bttrmapps-***",region="us-east-2",tag_Name="",tag_ingress_k8s_aws_cluster="bttrm-eks-prod-1",tag_kubernetes_io_namespace="eks-prod-1-bttrm-apps-ns",tag_kubernetes_io_service_name=""} 112
...
aws_alb_tg_un_healthy_host_count_maximum{dimension_LoadBalancer="app/bcf678a9-eksprod1bttrmapps-447a/***",dimension_TargetGroup="targetgroup/bcf678a9-9b32ce4accea2525b4d/e0f341421a33a453",name="arn:aws:elasticloadbalancing:us-east-2:534***385:targetgroup/bcf678a9-9b32ce4accea2525b4d/e0f341421a33a453",region="us-east-2",tag_Name="",tag_ingress_k8s_aws_cluster="bttrm-eks-prod-1",tag_kubernetes_io_namespace="eks-prod-1-bttrm-apps-ns",tag_kubernetes_io_service_name="bttrm-apps-backend-svc"} 0
...
[/simterm]
Now we are getting metrics from the only one EKS cluster and metrics have only selected tags.
Running with Prometheus
We have our Prometheus stack running under Docker Compose, so let’s add the YACE exporter:
...
  yace-clouwatch-exporter:
    image: quay.io/invisionag/yet-another-cloudwatch-exporter:v0.19.1-alpha
    networks:
      - prometheus
    ports:
      - 5000:5000
    volumes:
      - /etc/prometheus/prometheus-yace-cloudwatch-exporter.yaml:/tmp/config.yml:ro
    restart: unless-stopped
And now add a new target to the Prometheus server configuration:
...
scrape_configs:

  - job_name: 'yace-clouwatch-exporter'
    metrics_path: '/metrics'
    static_configs:
      - targets: ['yace-clouwatch-exporter:5000']
...
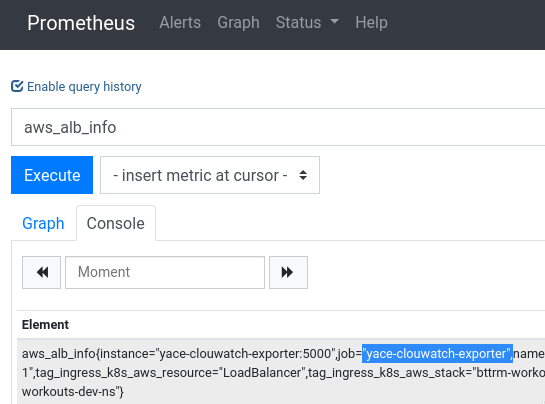
Restart Prometheus and check the target:
Metrics:
Grafana graphs
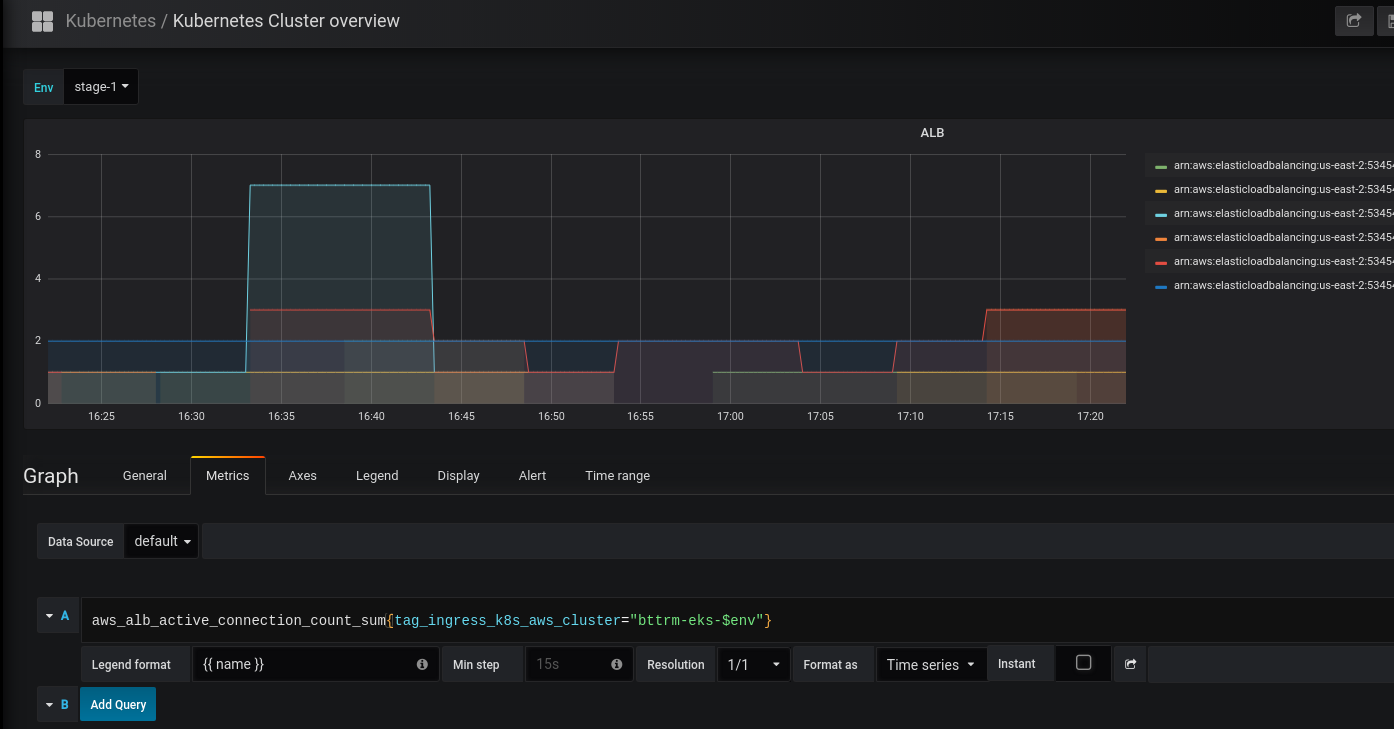
Now we are able to use those metrics in Grafana with an ability to chose, for example, an environment – dev, stage, prod (see the Grafana: создание dashboard, Rus):
The $env variable here is created from our label ekscluster, which is attached to each cluster during its creation from the CloudFormation (see the AWS Elastic Kubernetes Service: a cluster creation automation, part 1 – CloudFormation):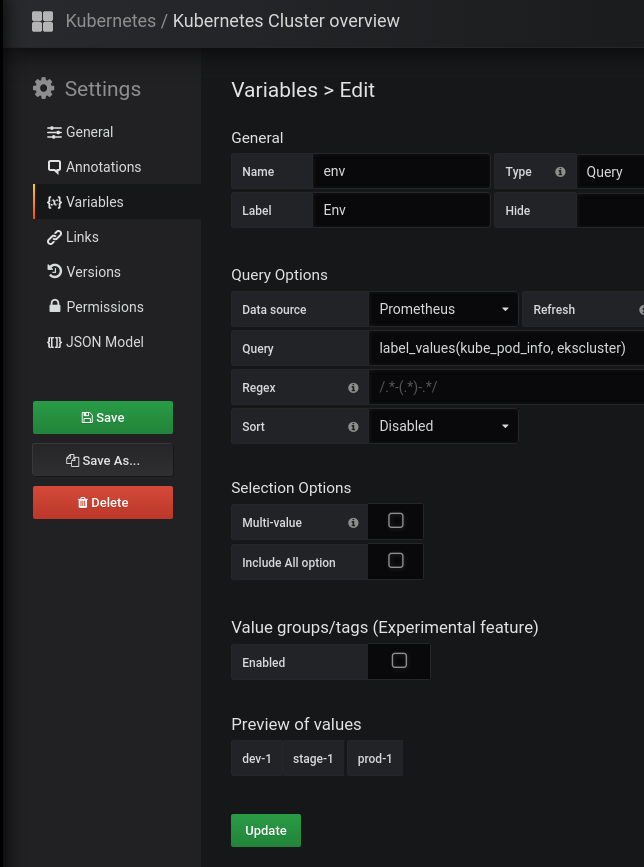
Done.
Useful links
- Improving the Prometheus exporter for Amazon CloudWatch
- Monitoring AWS Lambda with Prometheus and Sysdig
![]()
