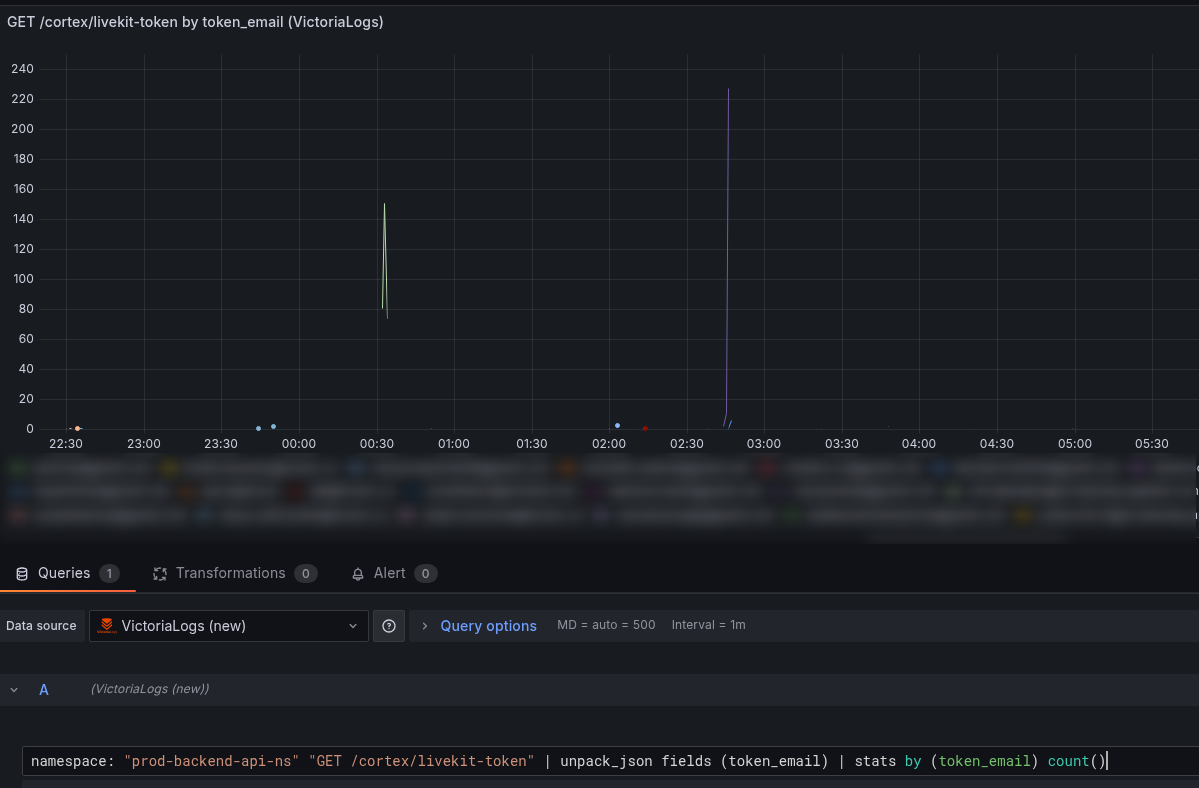
 We are debugging one issue with memory usage in Kubernetes Pods, and decided to look at the memory and number of processes on the nodes.
The problem is that a Kubernetes Pod with Livekit usually consumes about 2 gigabytes of memory, but sometimes there are spikes of up to 10-11 gigabytes, which causes the Pod to crash:
What we want to determine is whether it is one process that starts to “eat” so much memory, or whether many processes are simply being created in the container?
The simplest option here is to use Prometheus Process Exporter, which runs as a DaemonSet, creates its own container on each WorkerNode, and collects statistics from /proc for all or selected processes on EC2.
There is a good (and working) Helm chart kir4h/process-exporter, let’s take it.
Contents
Starting Process Exporter
Add the repository, install:
$ helm repo add kir4h https://kir4h.github.io/charts
$ helm install my-process-exporter kir4h/process-exporter
Or, in our case, we install it via Helm dependency and add the chart to Chart.yaml of our monitoring stack chart:
...
- name: process-exporter
  version: ~1.0
  repository: https://kir4h.github.io/charts
  condition: process-exporter.enabled
Add values for it:
...
process-exporter:
  enabled: true
  tolerations:
  - effect: NoSchedule
    operator: Exists
  - key: CriticalAddonsOnly
    operator: Exists
    effect: NoSchedule
  - key: CriticalAddonsOnly
Deploy and check DaemonSet:
$ kk get ds
NAME                                             DESIRED   CURRENT   READY   UP-TO-DATE   AVAILABLE   NODE SELECTOR            AGE
atlas-victoriametrics-process-exporter           9         9         9       9            9           <none>                   76m
...
And check ServiceMonitor:
$ kk get serviceMonitor | grep process
atlas-victoriametrics-process-exporter                   3d3h
For VictoriaMetrics, VMServiceScrape is automatically created:
$ kk get VMServiceScrape | grep process
atlas-victoriametrics-process-exporter                   3d3h   operational
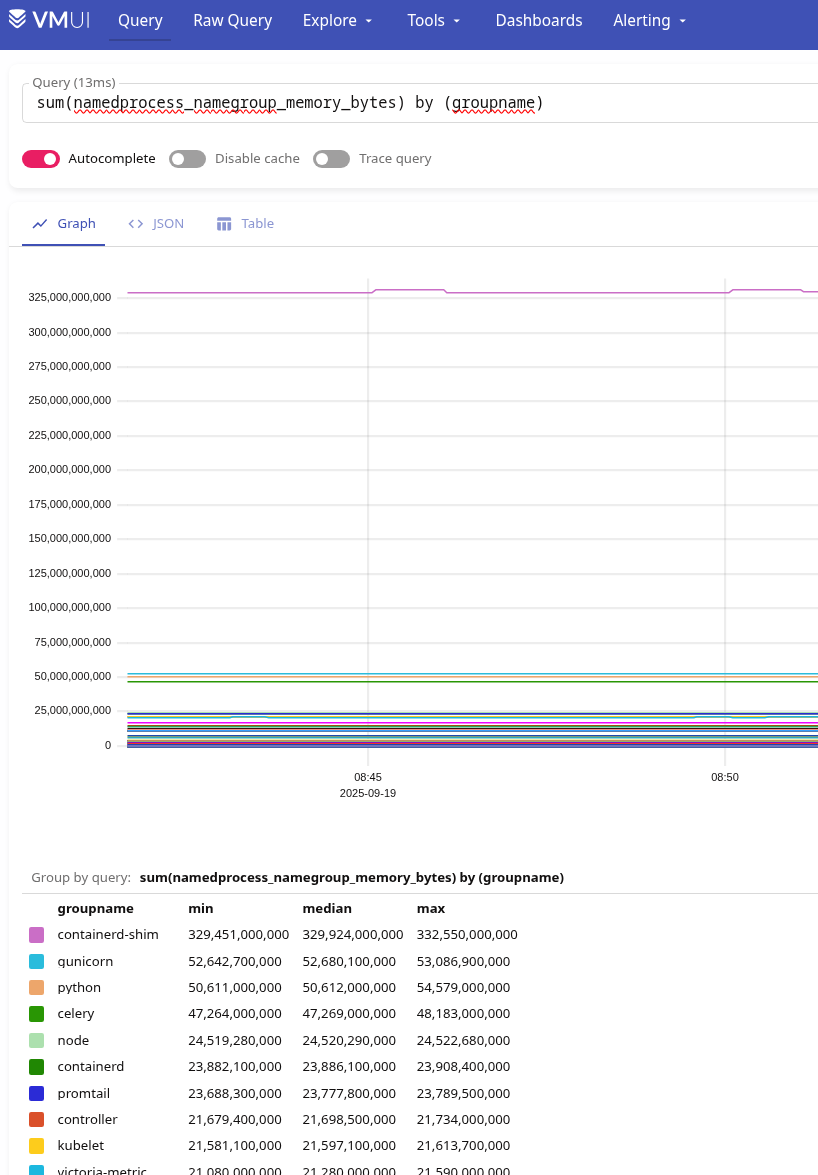
We check whether there are metrics, for example, for namedprocess_namegroup_memory_bytes:
Creating Name Groups
We now have data on all processes – we don’t need it.
Specifically, in our case, we are interested in statistics on our Backend API processes, Python processes.
We have three main ones: the Backend API itself, Celery Workers, and Livekit itself, and each service runs in its own Pods from separate Deployments.
Find processes in the submissions and see how they are launched.
Backend API:
root@backend-api-deployment-5695989cb5-rjhv9:/app# ps aux
USER         PID %CPU %MEM    VSZ   RSS TTY      STAT START   TIME COMMAND
root           1  0.0  0.2  40348 34712 ?        Ss   07:59   0:02 /usr/local/bin/python /usr/local/bin/gunicorn challenge_backend.run_api:app [...]
root           7  1.2  2.5 2075368 414564 ?      Sl   07:59   1:32 /usr/local/bin/python /usr/local/bin/gunicorn challenge_backend.run_api:app [...]
root           8  1.1  2.6 1999384 422228 ?      Sl   07:59   1:23 /usr/local/bin/python /usr/local/bin/gunicorn challenge_backend.run_api:app [...]
root           9  1.2  2.6 2002492 429192 ?      Sl   07:59   1:30 /usr/local/bin/python /usr/local/bin/gunicorn challenge_backend.run_api:app [...]
...
Celery workers:
root@backend-celery-workers-deployment-5bc64557c8-zbq2j:/app# ps aux
USER         PID %CPU %MEM    VSZ   RSS TTY      STAT START   TIME COMMAND
root           1  0.2  1.4 544832 236720 ?       Ss   07:27   0:24 /usr/local/bin/python /usr/local/bin/celery -A celery_app.app worker [...]
...
Ta Livekit:
root@backend-livekit-agent-deployment-7d9bf86564-qgjzb:/app# ps aux
USER         PID %CPU %MEM    VSZ   RSS TTY      STAT START   TIME COMMAND
root           1  0.4  1.8 2112944 294772 ?      Ssl  07:06   0:46 python -m cortex.livekit_agent.main start
root          24  0.0  0.0  15788 12860 ?        S    07:06   0:00 /usr/local/bin/python -c from multiprocessing.resource_tracker import main;main (34)
root          25  0.0  0.6 342976 102852 ?       S    07:06   0:02 /usr/local/bin/python -c from multiprocessing.forkserver import main [...]
...
Add the configuration for process-exporter – describe nameMatchers:
...
process-exporter:
  enabled: true
  tolerations:
    operator: Exists
    effect: NoSchedule
  - key: CriticalAddonsOnly
  config:
    # metrics will be broken down by thread name as well as group name
    threads: true
    # any process that otherwise isn't part of its own group becomes part of the first group found (if any) when walking the process tree upwards
    children: true
    # means that on each scrape the process names are re-evaluated
    recheck: false
    # remove_empty_groups drop empty groups if no processes found
    remove_empty_groups: true
    nameMatchers:
      # gunicorn (python + uvicorn workers)
      - name: "gunicorn"
        exe:
          - /usr/local/bin/python
        cmdline:
          - ".*gunicorn.*"

      # celery worker
      - name: "celery-worker"
        exe:
          - /usr/local/bin/python
        cmdline:
          - ".*celery.*worker.*"

      # livekit agent
      - name: "livekit-agent"
        exe:
          - python
          - /usr/local/bin/python
        cmdline:
          - ".*cortex.livekit_agent.main.*"

      # livekit multiprocessing helpers
      - name: "livekit-multiproc"
        exe:
          - /usr/local/bin/python
        cmdline:
          - ".*multiprocessing.*"
Here, in exe is a list of executables (there can be several), and in cmdline are the arguments with which the process is launched.
That is, for Livekit, we have exe – “/usr/local/bin/python“, and cmdline – it’s “-c from multiprocessing.resource_tracker [...] ” or “-c from multiprocessing.forkserver [...]“.
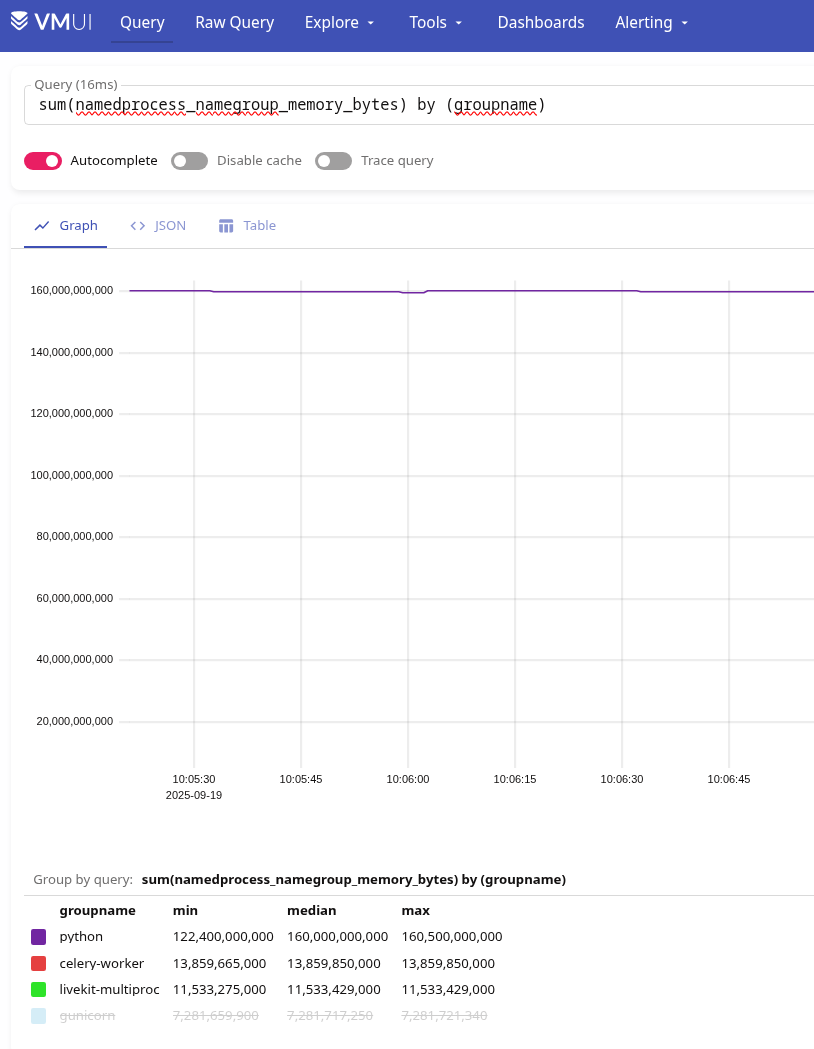
Let’s deploy, and now there are only three groups left:
But there are nuances.
First, statistics are collected from each node across the entire group of processes.
That is, if we do the following:
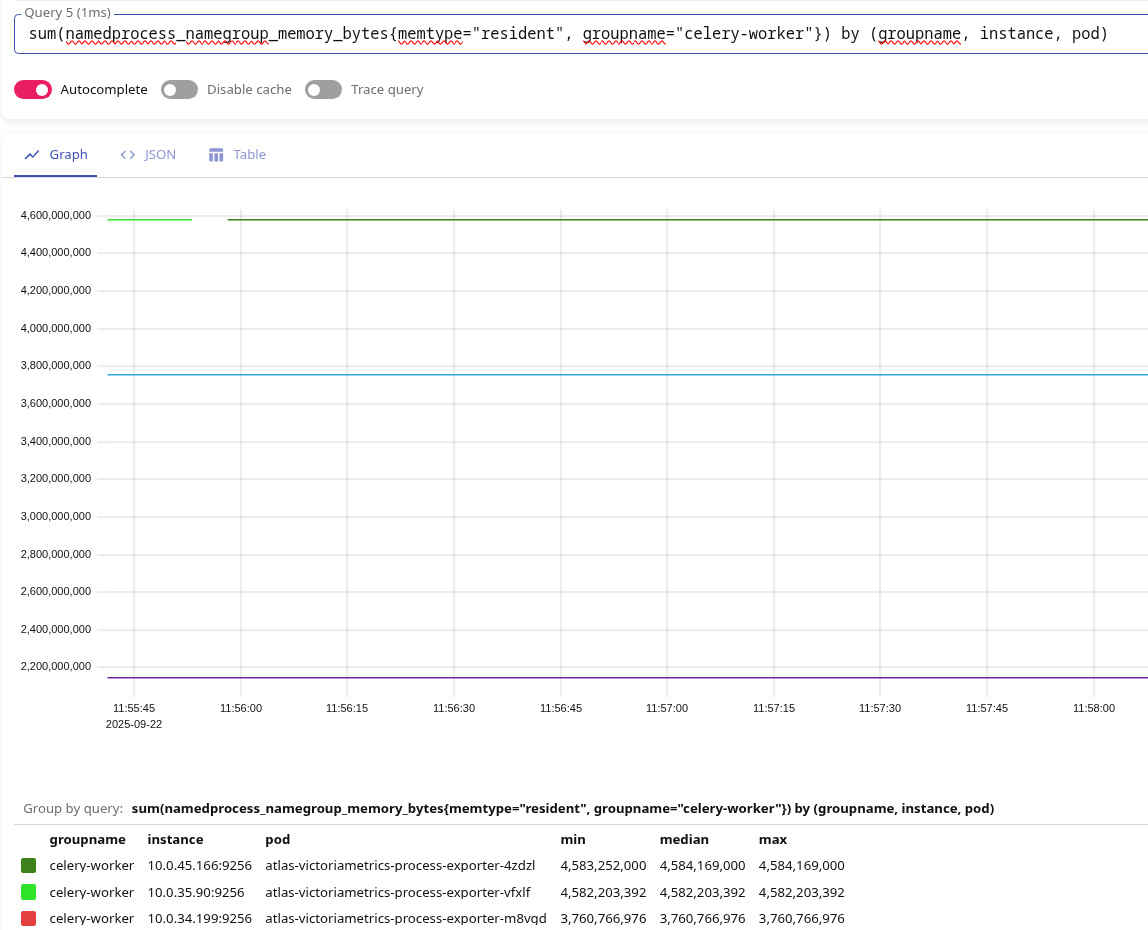
sum(namedprocess_namegroup_memory_bytes{memtype="resident", groupname="celery-worker"}) by (groupname, instance, pod)
This will give us the sum of all RSSs of all Celery workers on the node where the corresponding process-exporter Pod is running:
The second problem is that Process Exporter does not have a label named WorkerNode from which metrics are collected.
Therefore, we can only search manually here – by Pod IP (label instance) we can find its Node:
$ kk get pod -o wide | grep 10.0.45.166
atlas-victoriametrics-process-exporter-4zdzl                      1/1     Running     0              6m51s   10.0.45.166   ip-10-0-40-195.ec2.internal   <none>           <none>
And then see what kind of holes there are on this node:
$ kk describe node ip-10-0-40-195.ec2.internal | grep celery
  dev-backend-api-ns          backend-celery-workers-deployment-5bc64557c8-hqhz4                 200m (5%)     0 (0%)      1500Mi (10%)     0 (0%)         3h28m
  dev-backend-api-ns          backend-celery-workers-long-running-deployment-57d7cb9984-nlfs4    200m (5%)     0 (0%)      1500Mi (10%)     0 (0%)         3h12m
  prod-backend-api-ns         backend-celery-workers-deployment-5597dfd875-m7c2n                 500m (12%)    0 (0%)      1500Mi (10%)     0 (0%)         99m
  staging-backend-api-ns      backend-celery-workers-long-running-deployment-5bb44795b7-pcmj2    200m (5%)     0 (0%)      1500Mi (10%)     0 (0%)         103m
And now let’s take a look at the processes and their RSS:
[root@ip-10-0-40-195 ec2-user]# ps -eo rss,cmd | grep celery
232888 /usr/local/bin/python /usr/local/bin/celery -A celery_app.app worker --loglevel=info -Q default
241656 /usr/local/bin/python /usr/local/bin/celery -A celery_app.app worker --loglevel=info -Q default
...
239232 /usr/local/bin/python /usr/local/bin/celery -A celery_app.app worker --loglevel=info -Q default
252240 /usr/local/bin/python /usr/local/bin/celery -A celery_app.app worker --loglevel=info -Q default
 2416 grep --color=auto celery
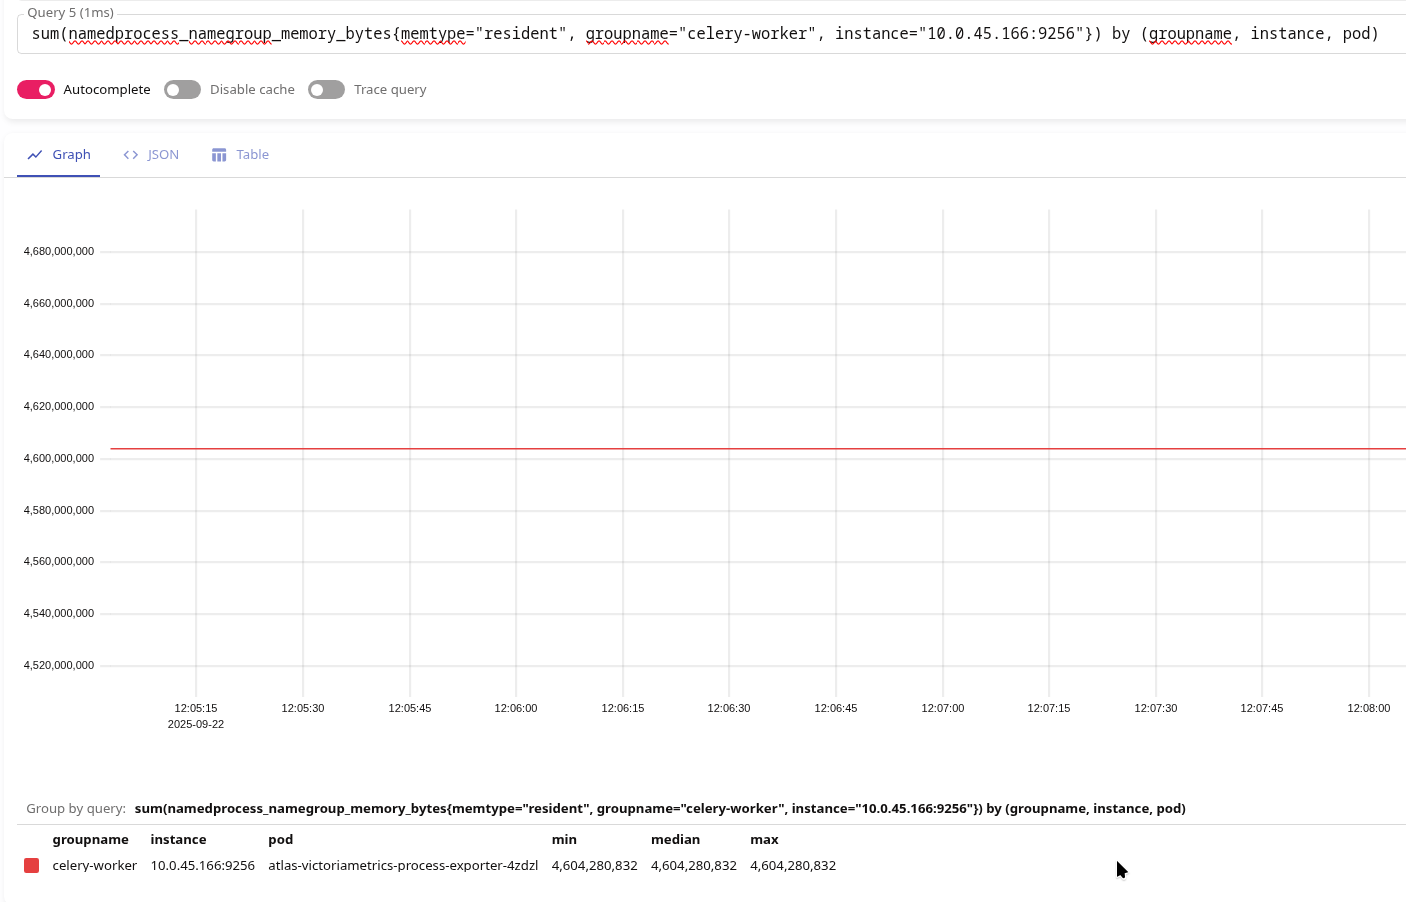
On the graph, we have 4,604,280,832 bytes here:
Let’s calculate it ourselves:
[root@ip-10-0-40-195 ec2-user]# ps -eo rss,cmd | grep celery | grep -v grep | awk '{sum += $1} END {print sum*1024 " bytes"}'
4608430080 bytes
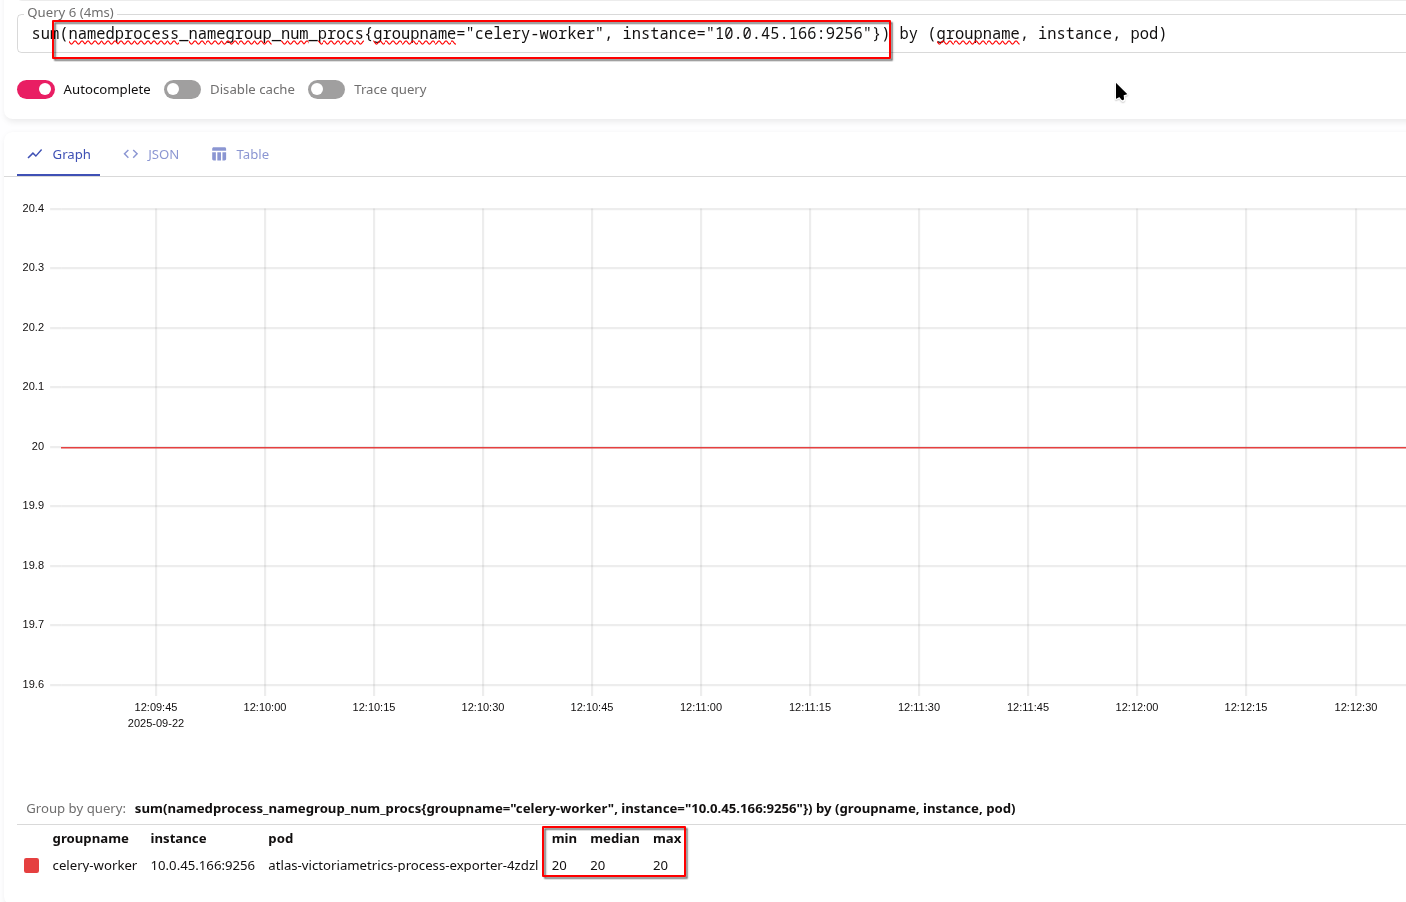
Returning to the issue of there being no information on each process: we can obtain an average value for each one, because we have the metric namedprocess_namegroup_num_procs:
Let’s check again on the node itself:
[root@ip-10-0-40-195 ec2-user]# ps aux | grep celery | grep -v grep | wc -l
20
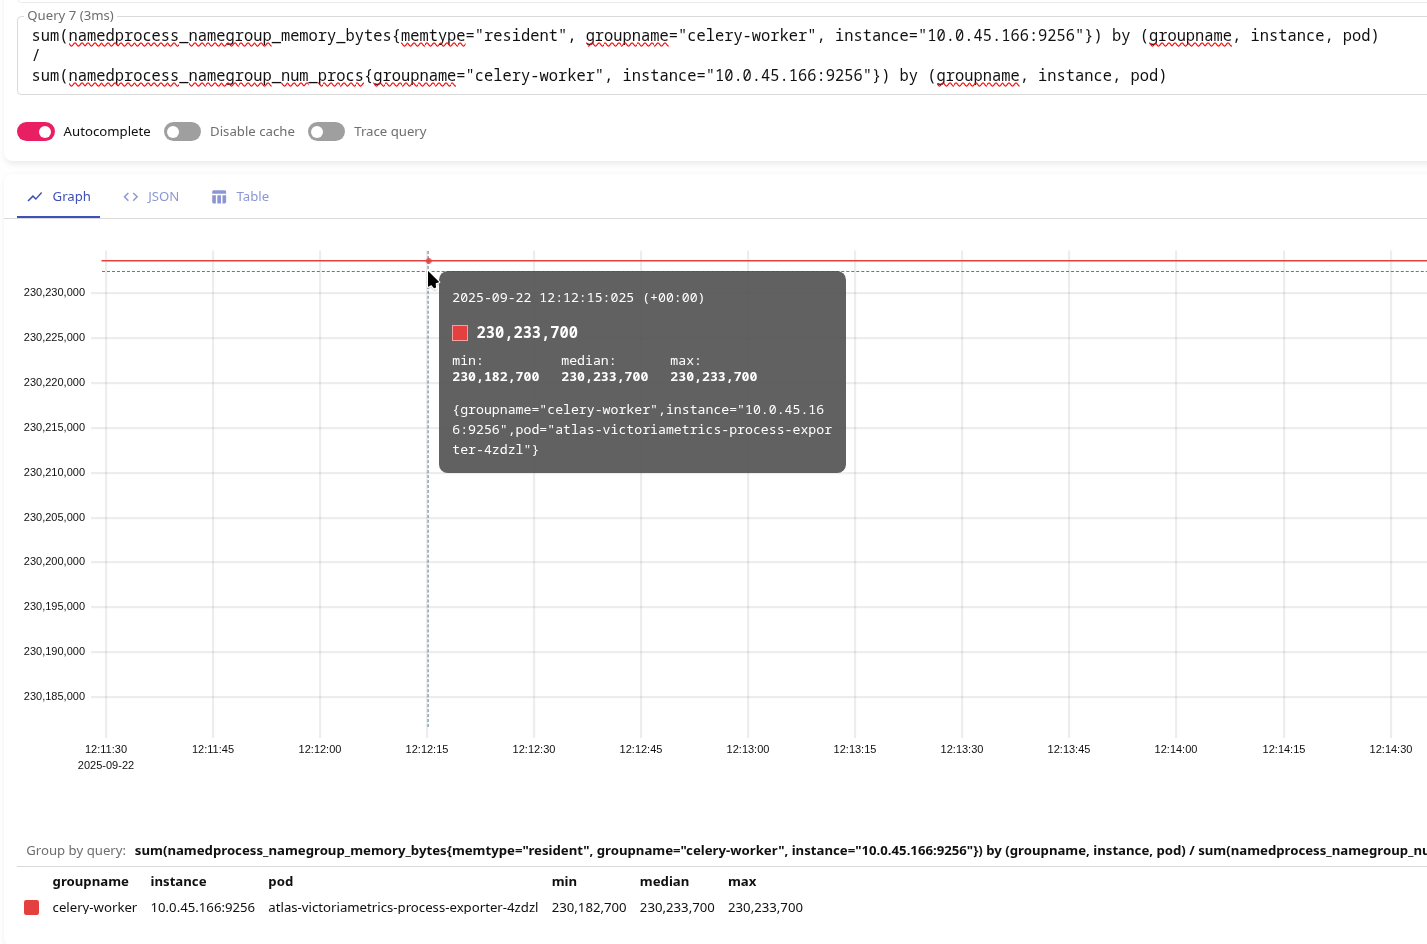
And we can make such a request:
sum(namedprocess_namegroup_memory_bytes{memtype="resident", groupname="celery-worker", instance="10.0.45.166:9256"}) by (groupname, instance, pod)
/
sum(namedprocess_namegroup_num_procs{groupname="celery-worker", instance="10.0.45.166:9256"}) by (groupname, instance, pod)
Result ~230 MB:
As we saw in ps -eo rss,cmd.
Name Group Template variables and information about each process
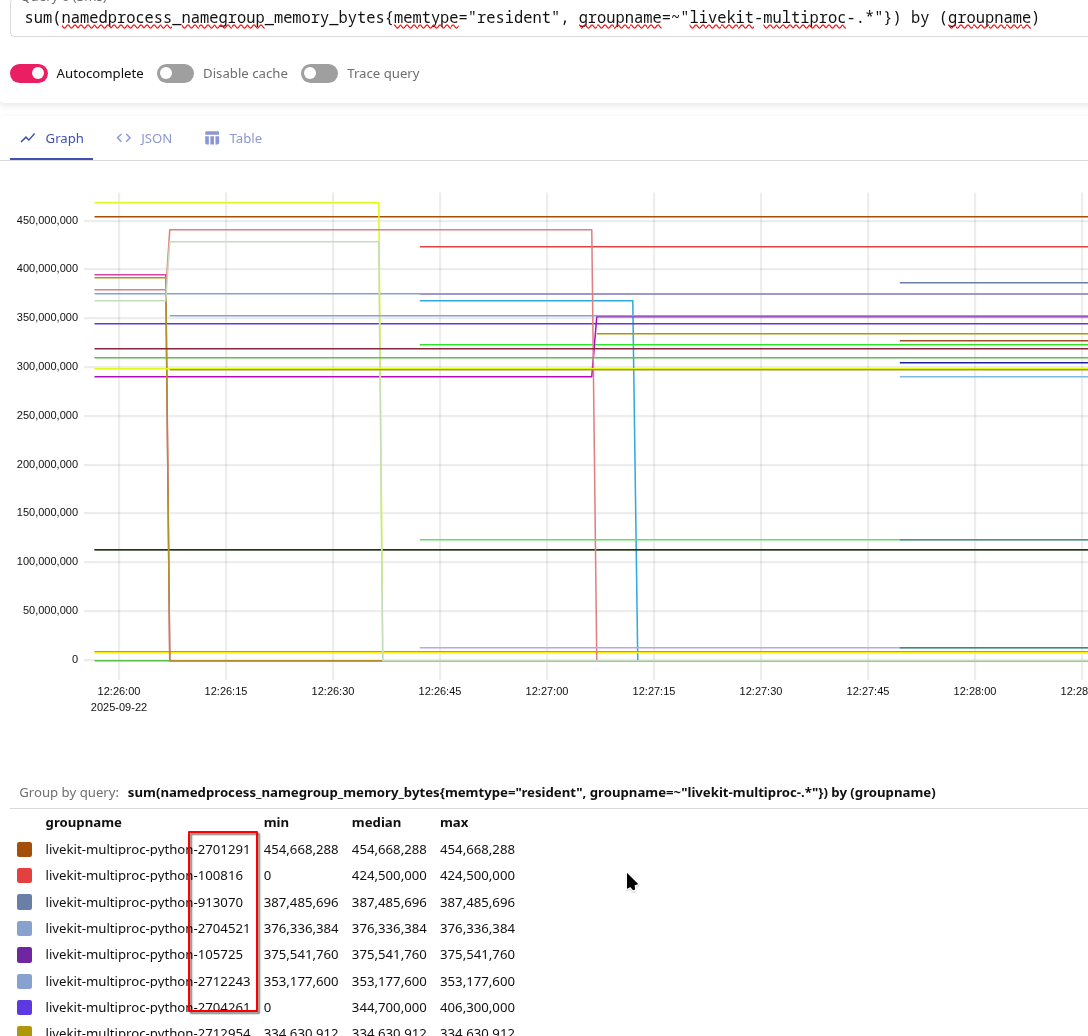
Or, if we really want to see statistics for each process, we can use dynamic names for groupname with {{.PID}} – then a separate group will be formed for each process, see Using a config file: group name:
...
    nameMatchers:
      # gunicorn (python + uvicorn workers)
      - name: "gunicorn-{{.Comm}}-{{.PID}}"
        exe:
          - python
          - /usr/bin/python
          - /usr/local/bin/python
        cmdline:
          - ".*gunicorn.*"

      # celery worker
      - name: "celery-worker-{{.Comm}}-{{.PID}}"
        exe:
          - python
          - /usr/bin/python
          - /usr/local/bin/python
        cmdline:
          - ".*celery.*worker.*"

      # livekit agent
      - name: "livekit-agent-{{.Comm}}-{{.PID}}"
        exe:
          - python
          - /usr/bin/python
          - /usr/local/bin/python
        cmdline:
          - ".*livekit_agent.*"

      # livekit multiprocessing helpers
      - name: "livekit-multiproc-{{.Comm}}-{{.PID}}"
        exe:
          - python
          - /usr/bin/python
          - /usr/local/bin/python
        cmdline:
          - ".*multiprocessing.*"
As a result, we have the following groups:
But this option is only OK if you need to debug something and disable it, because it will lead to a High cardinality issue.
The result of our debate
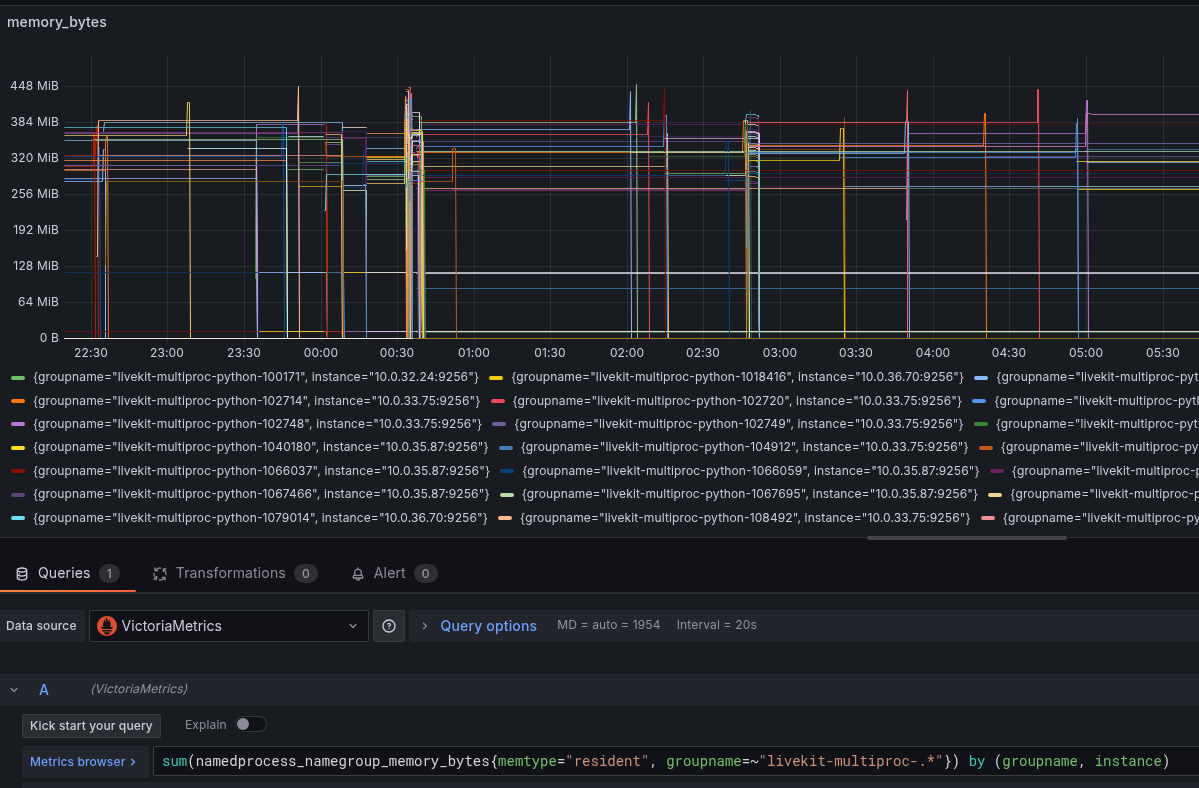
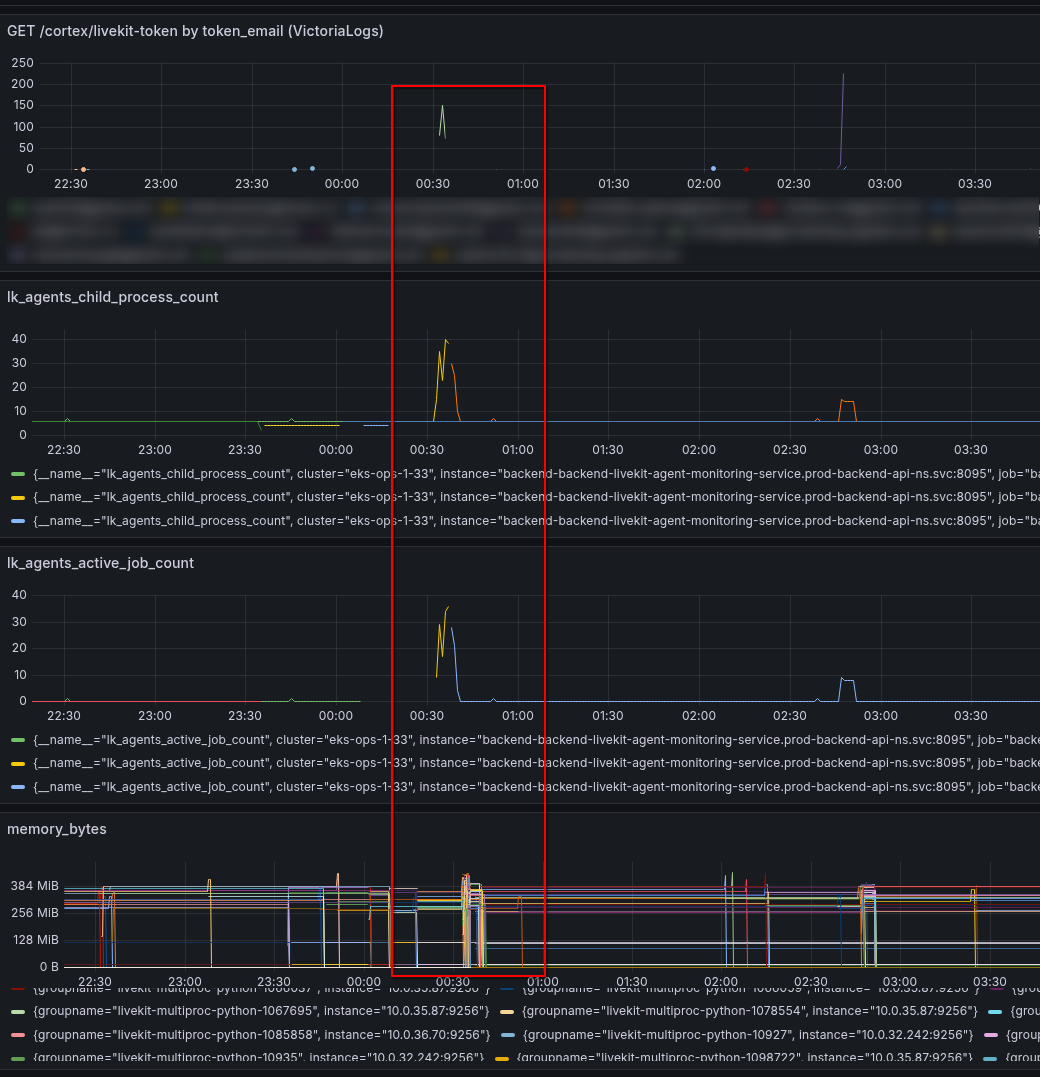
Actually, what we needed to find out was whether memory was “leaking” in a single process, or whether multiple processes were simply being created in a single Pod.
To do this, Grafana created a graph with the following query:
sum(namedprocess_namegroup_memory_bytes{memtype="resident", groupname=~"livekit-multiproc-.*"}) by (groupname, instance)
We added graphs with Livekit metrics – lk_agents_active_job_count and lk_agents_child_process_count, and separately – a graph from VictoriaLogs, where we display the number of API requests for each user by the field token_email:
namespace: "prod-backend-api-ns" "GET /cortex/livekit-token" | unpack_json fields (token_email) | stats by (token_email) count()
And as a result, we have the following picture:
Here we see that the same user starts making a bunch of requests to connect to Livekit, which creates a bunch of processes in Livekit Pod (a new Livekit Job for each request), and as a result, the total amount of memory in the Pod goes through the roof, because 40 processes at ~380 MB each is ~15 gigabytes of memory.
However, in each specific process, memory is maintained at a level of 300-400 megabytes.
It remains to figure out why the processes are crashing, but that’s a task for the developers.
![]()

