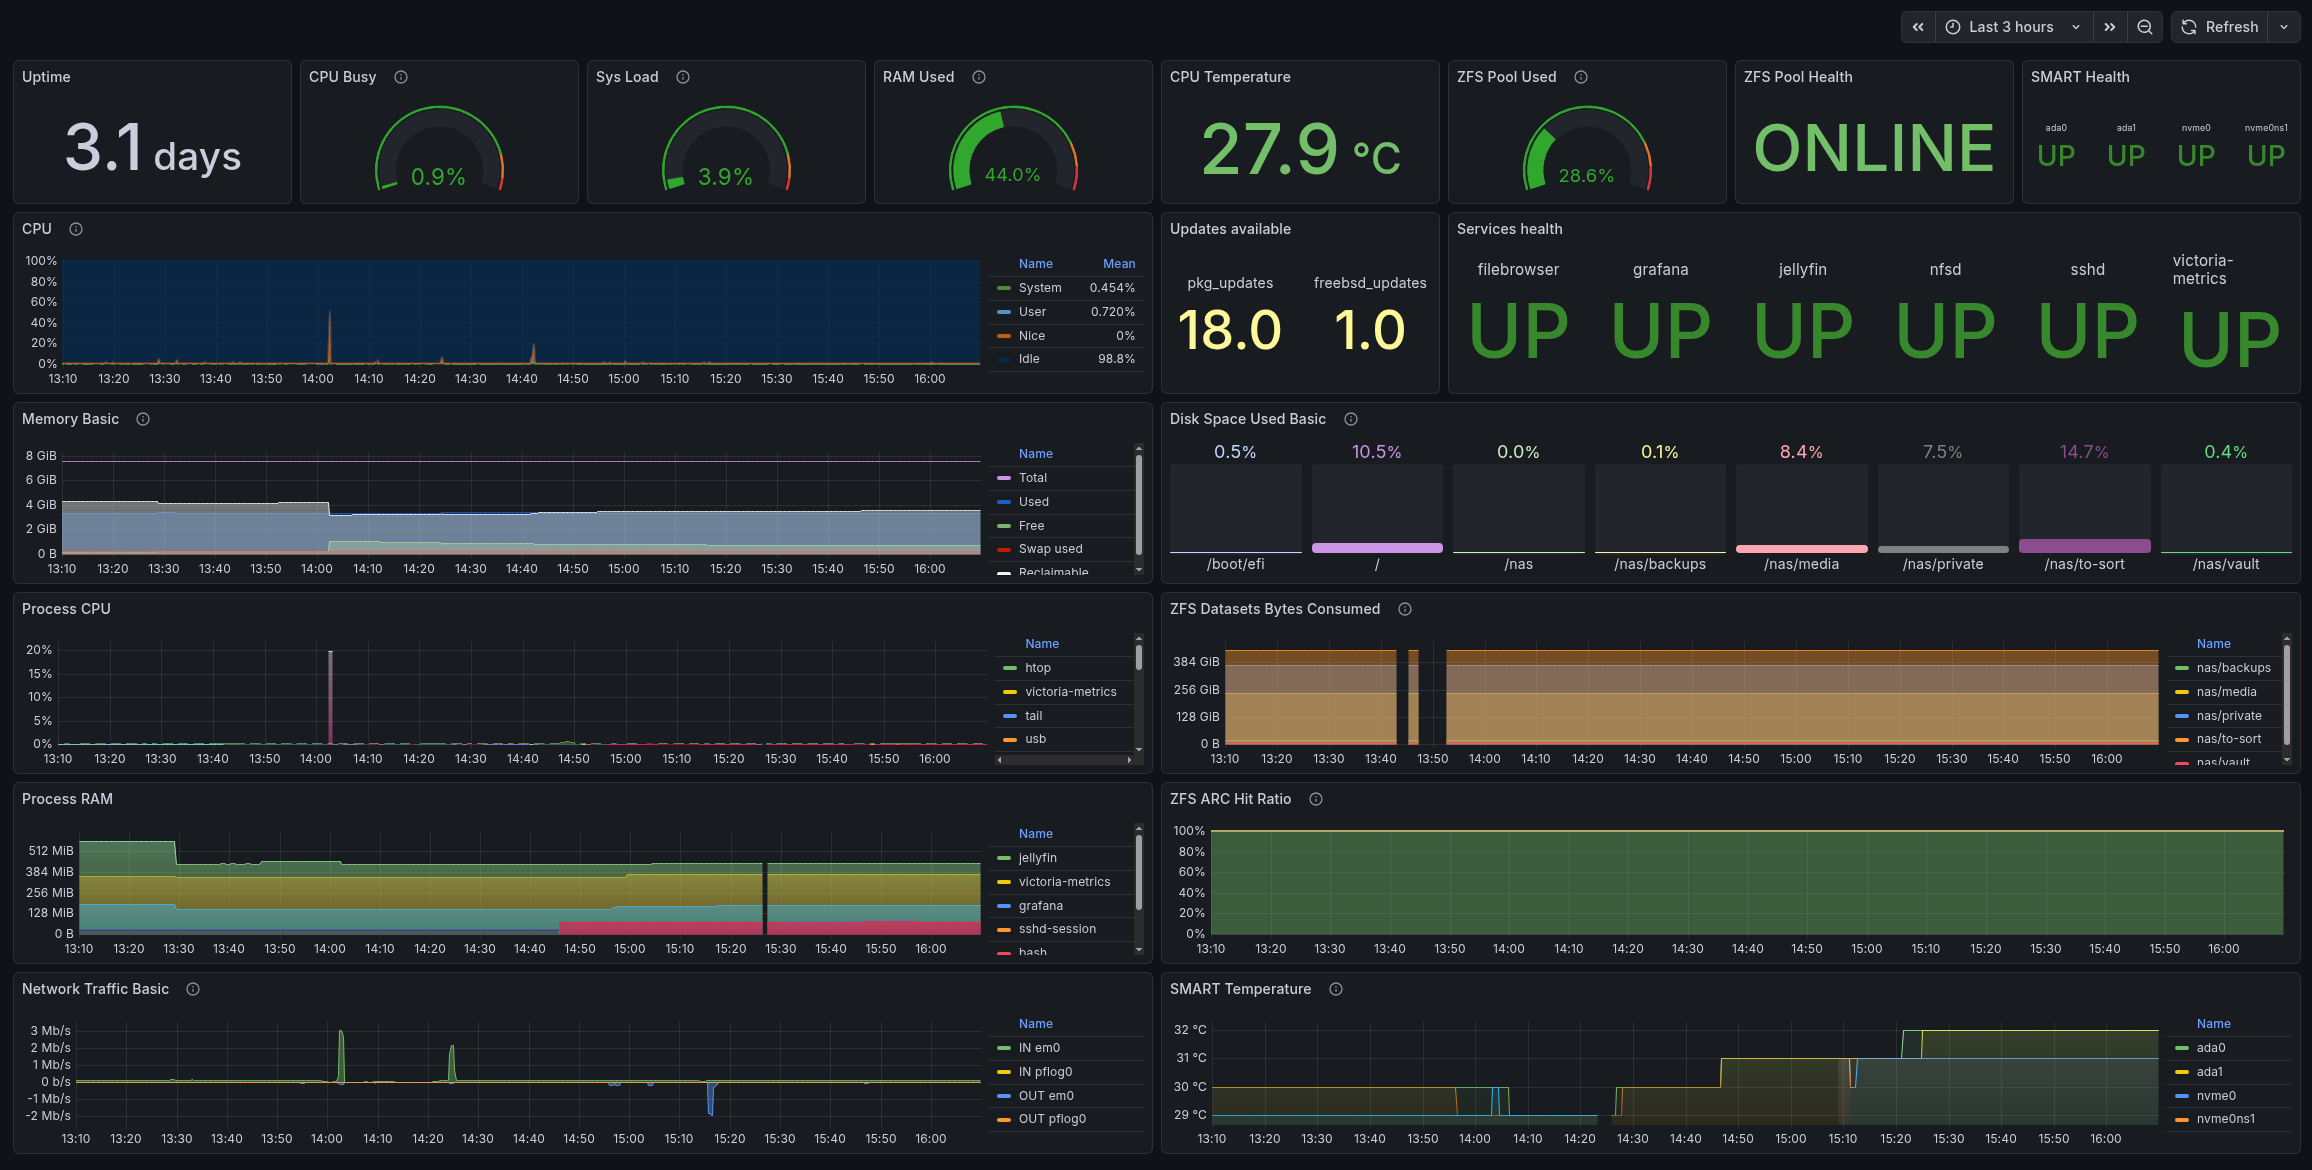
 In the previous post FreeBSD: Home NAS, part 10 – monitoring with VictoriaMetrics and Grafana, we configured VictoriaMetrics,
 node_exporter, Grafana and created a basic dashboard and basic alerts.
Now, I want to add a bit more monitoring – to see process CPU/RAM data, SMART information, and ZFS details.
Everything written here has been added to the setevoy2/nas-monitoring repository: it contains both scripts and the Grafana dashboard.
All parts of the series on setting up a home NAS on FreeBSD:
- FreeBSD: Home NAS, part 1 – configuring ZFS mirror (RAID1)
- FreeBSD: Home NAS, part 2 – introduction to Packet Filter (PF) firewall
- FreeBSD: Home NAS, part 3 – WireGuard VPN, Linux peer, and routing
- FreeBSD: Home NAS, part 4 – Local DNS with Unbound
- FreeBSD: Home NAS, part 5 – ZFS pool, datasets, snapshots, and ZFS monitoring
- FreeBSD: Home NAS, part 6 – Samba server and client connections
- FreeBSD: Home NAS, part 7 – NFSv4 and use with Linux clients
- FreeBSD: Home NAS, part 8 – NFS and Samba data backup with restic
- FreeBSD: Home NAS, part 9 – data backup to AWS S3 and Google Drive with rclone
- FreeBSD: Home NAS, part 10 – monitoring with VictoriaMetrics and Grafana
- (current) FreeBSD: Home NAS, part 11 – extended monitoring with additional exporters
- FreeBSD: Home NAS, part 12: synchronizing data with Syncthing
- FreeBSD: Home NAS, Part 13: Planning Data Storage and Backups
- FreeBSD: Home NAS, part 14 – logs with VictoriaLogs and alerts with VMAlert
- FreeBSD: Home NAS, Part 15: Automating Backups – scripts, rsync, rclone
- (to be continued)
Contents
Installing custom exporters
Not all exporters have ports or are available in the repository – so I will describe how I made my own “pseudo FreeBSD port”.
Installing ZFS exporter
The exporter repository is zfs_exporter.
Actually, there is another exporter in the ports – py-prometheus-zfs, but I had already set it up with this one, and it turned out to be a fairly good – and interesting – solution, so I’ll save the configuration details to the blog.
I used the same solution for go-ecoflow-exporter as well.
So, we have a GitHub repository for the exporter; the repository has releases where you can download a ready-made build – but not all of them support ready-to-use files for FreeBSD.
However, everyone has the code, and most services are in Go – so it’s easy to build them yourself.
The idea is quite simple:
build.shscript: download or update the exporter codeMakefile: to runbuild.shand copy the exporter binary itself and itsrc.dscript
Create the directory structure:
# mkdir -p /opt/exporters/zfs_exporter/{rc.d,src}
Creating build.sh
Add a script – it will clone the repository and run go build.
I didn’t bother with a VERSION file – we just take the master branch and build from it.
Write /opt/exporters/zfs_exporter/build.sh:
#!/bin/sh

# stop on first error
set -e

BASE_DIR="/opt/exporters/zfs_exporter"
SRC_DIR="${BASE_DIR}/src/zfs_exporter"
BIN_NAME="zfs_exporter"
REPO_URL="https://github.com/pdf/zfs_exporter.git"

# ensure src dir exists
mkdir -p "${BASE_DIR}/src"

# clone repo if it does not exist
if [ ! -d "${SRC_DIR}" ]; then
    git clone "${REPO_URL}" "${SRC_DIR}"
fi

cd "${SRC_DIR}"

# always update sources
git pull

# build binary into BASE_DIR
go build -o "${BASE_DIR}/${BIN_NAME}"
Set execution permissions:
# chmod +x /opt/exporters/zfs_exporter/build.sh
Run it:
# /opt/exporters/zfs_exporter/build.sh
Check it:
# ll /opt/exporters/zfs_exporter/src/
total 8
drwxr-xr-x  6 root setevoy  512B Feb  9 13:32 zfs_exporter
And the binary file:
# file /opt/exporters/zfs_exporter/zfs_exporter
/opt/exporters/zfs_exporter/zfs_exporter: ELF 64-bit LSB executable, x86-64, version 1 (FreeBSD) ...
You can run it for verification:
# /opt/exporters/zfs_exporter/zfs_exporter
time=2026-02-09T13:42:30.119+02:00 level=INFO source=zfs_exporter.go:40 msg="Starting zfs_exporter" version="(version=, branch=, revision=7af698c8844864eb1e724ed08c47e5a7b4bbcc53)"
time=2026-02-09T13:42:30.120+02:00 level=INFO source=zfs_exporter.go:41 msg="Build context" context="(go=go1.24.12, platform=freebsd/amd64, user=, date=, tags=unknown)"
...
time=2026-02-09T13:42:30.120+02:00 level=INFO source=tls_config.go:354 msg="Listening on" address=[::]:9134
...
Now add a Makefile to make installation and updates easier.
Creating the Makefile
All build and update logic will be in build.sh, while the Makefile simply calls the script and handles the file installation into the system:
# simple makefile for zfs_exporter

PREFIX=/usr/local
BIN_NAME=zfs_exporter
BASE_DIR=/opt/exporters/zfs_exporter

.PHONY: build install clean

build:
  $(BASE_DIR)/build.sh

install:
  install -m 0755 $(BASE_DIR)/$(BIN_NAME) $(PREFIX)/bin/$(BIN_NAME)

clean:
  rm -f $(BASE_DIR)/$(BIN_NAME)
We can use it as follows:
# cd /opt/exporters/zfs_exporter
# make build

// or
# make -C /opt/exporters/zfs_exporter build

// or
# make -f /opt/exporters/zfs_exporter/Makefile build
Now we have the following exporter structure:
# tree /opt/exporters/zfs_exporter
/opt/exporters/zfs_exporter
├── Makefile
├── build.sh
├── rc.d
├── src
│    └── zfs_exporter
│        ├── CHANGELOG.md
│        ├── LICENSE
...
│        └── zfs_exporter.go
└── zfs_exporter
Run make build to check:
# make build
/opt/exporters/zfs_exporter/build.sh
Already up to date.
And make install:
# make install
install -m 0755 /opt/exporters/zfs_exporter/zfs_exporter /usr/local/bin/zfs_exporter
Check again, this time from /usr/local/bin:
# /usr/local/bin/zfs_exporter
...
time=2026-02-09T13:44:59.651+02:00 level=INFO source=tls_config.go:354 msg="Listening on" address=[::]:9134
...
Creating the rc.d script
Write the file /opt/exporters/zfs_exporter/rc.d/zfs_exporter:
#!/bin/sh

# PROVIDE: zfs_exporter
# REQUIRE: DAEMON
# KEYWORD: shutdown

. /etc/rc.subr

name="zfs_exporter"
rcvar="zfs_exporter_enable"

command="/usr/local/bin/zfs_exporter"
pidfile="/var/run/${name}.pid"

# defaults (override in rc.conf)
: ${zfs_exporter_enable:=no}
: ${zfs_exporter_listen_address:=":9134"}
: ${zfs_exporter_extra_flags:=""}
: ${zfs_exporter_log_file:="/var/log/zfs_exporter.log"}

start_cmd="${name}_start"
stop_cmd="${name}_stop"
status_cmd="${name}_status"

zfs_exporter_start()
{
    echo "Starting ${name}"
    /bin/sh -c "${command} --web.listen-address=${zfs_exporter_listen_address} ${zfs_exporter_extra_flags} > ${zfs_exporter_log_file} 2>&1 & echo \$! > ${pidfile}"
}

zfs_exporter_stop()
{
    if [ -f "${pidfile}" ]; then
        kill "$(cat ${pidfile})"
        rm -f "${pidfile}"
        echo "Stopped ${name}"
    else
        echo "${name} is not running"
    fi
}

zfs_exporter_status()
{
    if [ -f "${pidfile}" ] && kill -0 "$(cat ${pidfile})" 2>/dev/null; then
        echo "${name} is running (pid $(cat ${pidfile}))"
    else
        echo "${name} is not running"
        return 1
    fi
}

load_rc_config $name
run_rc_command "$1"
Set execution permissions:
# chmod +x /opt/exporters/zfs_exporter/rc.d/zfs_exporter
Add its copying to /usr/local/etc/rc.d into the install target of our Makefile:
# simple makefile for zfs_exporter

PREFIX=/usr/local
BIN_NAME=zfs_exporter
BASE_DIR=/opt/exporters/zfs_exporter
RC_DIR=$(PREFIX)/etc/rc.d

.PHONY: build install clean

build:
  $(BASE_DIR)/build.sh

install:
  install -m 0755 $(BASE_DIR)/$(BIN_NAME) $(PREFIX)/bin/$(BIN_NAME)
  install -m 0755 $(BASE_DIR)/rc.d/$(BIN_NAME) $(RC_DIR)/$(BIN_NAME)

clean:
  rm -f $(BASE_DIR)/$(BIN_NAME)
Run it:
# make install
install -m 0755 /opt/exporters/zfs_exporter/zfs_exporter /usr/local/bin/zfs_exporter
install -m 0755 /opt/exporters/zfs_exporter/rc.d/zfs_exporter /usr/local/etc/rc.d/zfs_exporter
Add to /etc/rc.conf:
# sysrc zfs_exporter_enable="YES"
zfs_exporter_enable:  -> YES
Start the service:
# service zfs_exporter start
Starting zfs_exporter
Check the status:
# service zfs_exporter status
zfs_exporter is running (pid 91712)
Check the log:
# tail -f /var/log/zfs_exporter.log
time=2026-02-09T13:52:07.033+02:00 level=INFO source=zfs_exporter.go:40 msg="Starting zfs_exporter" version="(version=, branch=, revision=7af698c8844864eb1e724ed08c47e5a7b4bbcc53)"
...
time=2026-02-09T13:52:07.033+02:00 level=INFO source=tls_config.go:354 msg="Listening on" address=[::]:9134
...
And the metrics:
# curl -s localhost:9134/metrics | grep zfs_ | head -5
# HELP zfs_dataset_available_bytes The amount of space in bytes available to the dataset and all its children.
# TYPE zfs_dataset_available_bytes gauge
zfs_dataset_available_bytes{name="nas",pool="nas",type="filesystem"} 2.723599372288e+12
zfs_dataset_available_bytes{name="nas/backups",pool="nas",type="filesystem"} 2.723599372288e+12
zfs_dataset_available_bytes{name="nas/media",pool="nas",type="filesystem"} 2.723599372288e+12
VMAgent was described in the previous post in the section Installing VMAgent – let’s add metrics collection from the new exporter to it.
Edit /usr/local/etc/prometheus/prometheus.yml, adding the new target:
...
  - job_name: "zfs_exporter"
    static_configs:
      - targets:
          - "127.0.0.1:9134"
...
Restart vmagent and check the metrics in VictoriaMetrics:
Exporter upgrade with make
Here we have just a few steps:
# service zfs_exporter stop

# make -C /opt/exporters/zfs_exporter build

# make -C /opt/exporters/zfs_exporter install

# service zfs_exporter start
No VERSION, tags, or releases – everything is as simple as possible.
You can add this to the Makefile:
...

upgrade:
        service zfs_exporter stop || true
        $(MAKE) build
        $(MAKE) install
        service zfs_exporter start
Installing go-ecoflow-exporter
I did the same for go-ecoflow-exporter, but there are a few differences here because we need to pass a bunch of environment variables.
To do this, in the script /opt/exporters/ecoflow_exporter/rc.d/ecoflow_exporter, add export:
...
ecoflow_exporter_start()
{
    echo "Starting ${name}"

    export \
        EXPORTER_TYPE \
        ECOFLOW_EMAIL \
        ECOFLOW_PASSWORD \
        ECOFLOW_DEVICES \
        MQTT_DEVICE_OFFLINE_THRESHOLD_SECONDS \
        DEBUG_ENABLED \
        METRIC_PREFIX \
        SCRAPING_INTERVAL \
        PROMETHEUS_ENABLED \
        PROMETHEUS_PORT

    /bin/sh -c "${command} --listen ${ecoflow_exporter_listen_address} ${ecoflow_exporter_extra_flags} > ${ecoflow_exporter_log_file} 2>&1 & echo \$! > ${pidfile}"
}
...
And the values are provided via /etc/rc.conf.d and the file /etc/rc.conf.d/ecoflow_exporter:
# cat /etc/rc.conf.d/ecoflow_exporter
ecoflow_exporter_enable="YES"

EXPORTER_TYPE="mqtt"
...
PROMETHEUS_PORT="2112"
The file name in rc.conf.d must match the name in rc.d, i.e.:
# cat /usr/local/etc/rc.d/ecoflow_exporter | grep name=
name="ecoflow_exporter"
Add a new target to VMAgent:
...
  - job_name: "ecoflow_exporter"
    static_configs:
      - targets:
          - "127.0.0.1:2112"
...
Installing smartctl_exporter
It is available in the ports – smartctl_exporter and in the FreeBSD repository, so just install it with pkg:
# pkg install -y smartctl_exporter
Enable startup:
# sysrc smartctl_exporter_enable="YES"
Start the service:
# service smartctl_exporter start
Check the metrics:
# curl -s 127.0.0.1:9633/metrics | grep smart | grep -v \# | head -5
smartctl_device{ata_additional_product_id="unknown",ata_version="ACS-4 T13/BSR INCITS 529 revision 5",device="ada0" ...
Add VMAgent target:
...
  - job_name: smartctl_exporter
    static_configs:
      - targets:
          - 127.0.0.1:9633
...
However, smartctl_exporter by default collects information only for /dev/ada* – but I also have NVMe.
In the rc.d script of the exporter, there is a glob:
...
smartctl_exporter_devices (string):           Shell glob (like /dev/ada[0-9]) for all devices
...
Define the disks in /etc/rc.conf:
...
smartctl_exporter_devices="/dev/ada* /dev/nvme0"
...
For NVMe, I used the explicit name without a glob to avoid pulling in partitions like /dev/nvme0ns1.
Node Exporter and Textfile
Despite using node_exporter in Kubernetes for years, I didn’t know it had such an interesting feature as Textfile; there are even entire collections, see node-exporter-textfile-collector-scripts.
What I wanted to see was information on process CPU/RAM, and initially, I thought about just using process_exporter, as I did in Kubernetes (see Kubernetes: monitoring processes with process-exporter).
But process_exporter doesn’t work with FreeBSD because it collects all information from the /proc directory, which can be enabled – but it still won’t be Linux-proc.
So I did it differently – through node_exporter and textfiles, which I use to collect CPU temperature and process information.
Verify the directory from which node_exporter reads metric files:
root@setevoy-nas:~ # ps aux | grep node_exporter
nobody            2511   0.0  0.2   1264028  13012  -  S    Fri17       1:17.17 /usr/local/bin/node_exporter --web.listen-address=:9100 --collector.textfile.directory=/var/tmp/node_exporter
--collector.textfile.directory=/var/tmp/node_exporter – Okay, it’s enabled, we can add data.
Script for CPU temperature, process CPU and RAM
Write the script /usr/local/bin/process_resources_exporter.sh:
#!/bin/sh

OUT="/var/tmp/node_exporter/process_resources.prom"

# reset file once
{
  echo "# HELP local_process_memory_bytes resident memory size per process"
  echo "# TYPE local_process_memory_bytes gauge"

  echo "# HELP local_process_cpu_percent cpu usage percent per process"
  echo "# TYPE local_process_cpu_percent gauge"

  echo "# HELP node_cpu_temperature_celsius CPU/system temperature via ACPI"
  echo "# TYPE node_cpu_temperature_celsius gauge"
} > "$OUT"

# ----
# top processes by memory (aggregate by process name)
# ----
ps -axo comm,rss | grep -vE '^(idle|pagezero|kernel)' | awk '
{
  gsub(/ /,"_",$1)
  mem[$1] += $2
}
END {
  for (p in mem)
    printf "local_process_memory_bytes{process=\"%s\"} %d\n", p, mem[p] * 1024
}
' | sort -k2 -nr | head -10 >> "$OUT"

# ----
# top processes by cpu (aggregate by process name)
# ----
ps -axo comm,%cpu | grep -vE '^(idle|pagezero|kernel)' | awk '
{
  gsub(/ /,"_",$1)
  cpu[$1] += $2
}
END {
  for (p in cpu)
    printf "local_process_cpu_percent{process=\"%s\"} %.2f\n", p, cpu[p]
}
' | sort -k2 -nr | head -10 >> "$OUT"

# ----
# cpu temperature via ACPI
# ----
TEMP=$(sysctl -n hw.acpi.thermal.tz0.temperature 2>/dev/null | tr -d 'C')

if [ -n "$TEMP" ]; then
  echo "node_cpu_temperature_celsius $TEMP" >> "$OUT"
fi
Run it for a test:
# chmod +x /usr/local/bin/process_resources_exporter.sh

# /usr/local/bin/process_resources_exporter.sh
Check the /var/tmp/node_exporter/process_resources.prom file with metrics:
# cat /var/tmp/node_exporter/process_resources.prom
# HELP local_process_memory_bytes resident memory size per process
# TYPE local_process_memory_bytes gauge
# HELP local_process_cpu_percent cpu usage percent per process
# TYPE local_process_cpu_percent gauge
# HELP node_cpu_temperature_celsius CPU/system temperature via ACPI
# TYPE node_cpu_temperature_celsius gauge
local_process_memory_bytes{process="jellyfin"} 456441856
...
local_process_cpu_percent{process="syslogd"} 0.00
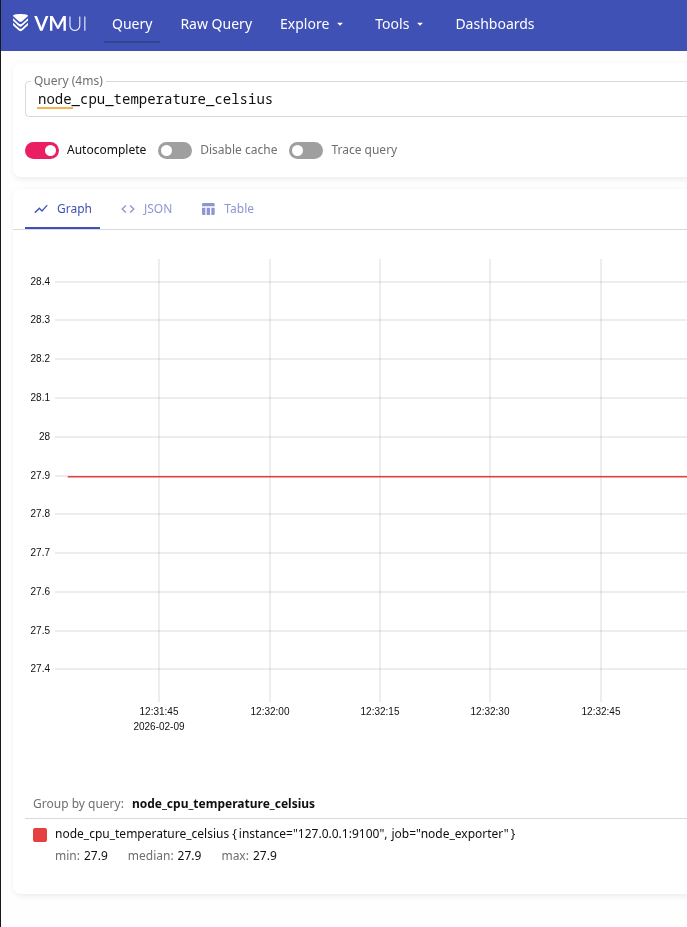
node_cpu_temperature_celsius 27.9
And the exporter imports metrics from it:
Add the script to cron; once a minute should be sufficient:
* * * * * /usr/local/bin/process_resources_exporter.sh
Script for freebsd_update and pkg updates
Similarly, you can add information about available updates.
The script /usr/local/bin/updates_exporter.sh:
#!/bin/sh

OUT="/var/tmp/node_exporter/updates.prom"

# header
{
  echo "# HELP node_freebsd_update_available FreeBSD base system updates available (1=yes, 0=no)"
  echo "# TYPE node_freebsd_update_available gauge"

  echo "# HELP node_pkg_updates_available Number of pkg updates available"
  echo "# TYPE node_pkg_updates_available gauge"
} > "$OUT"

# --------
# freebsd-update
# --------
FREEBSD_UPDATES=0

# freebsd-update fetch returns:
# - exit 0 even if no updates
# - but prints "No updates needed to update system"
if freebsd-update fetch | grep -q "No updates needed"; then
  FREEBSD_UPDATES=0
else
  FREEBSD_UPDATES=1
fi

echo "node_freebsd_update_available $FREEBSD_UPDATES" >> "$OUT"

# --------
# pkg updates
# --------
# pkg version -l "<" lists outdated packages
PKG_UPDATES=$(pkg version -l "<" 2>/dev/null | wc -l | tr -d ' ')

# fallback safety
PKG_UPDATES=${PKG_UPDATES:-0}

echo "node_pkg_updates_available $PKG_UPDATES" >> "$OUT"
Set chmod, add to cron – but here, once per hour – and verify the metrics in VictoriaMetrics:
Script for Services health
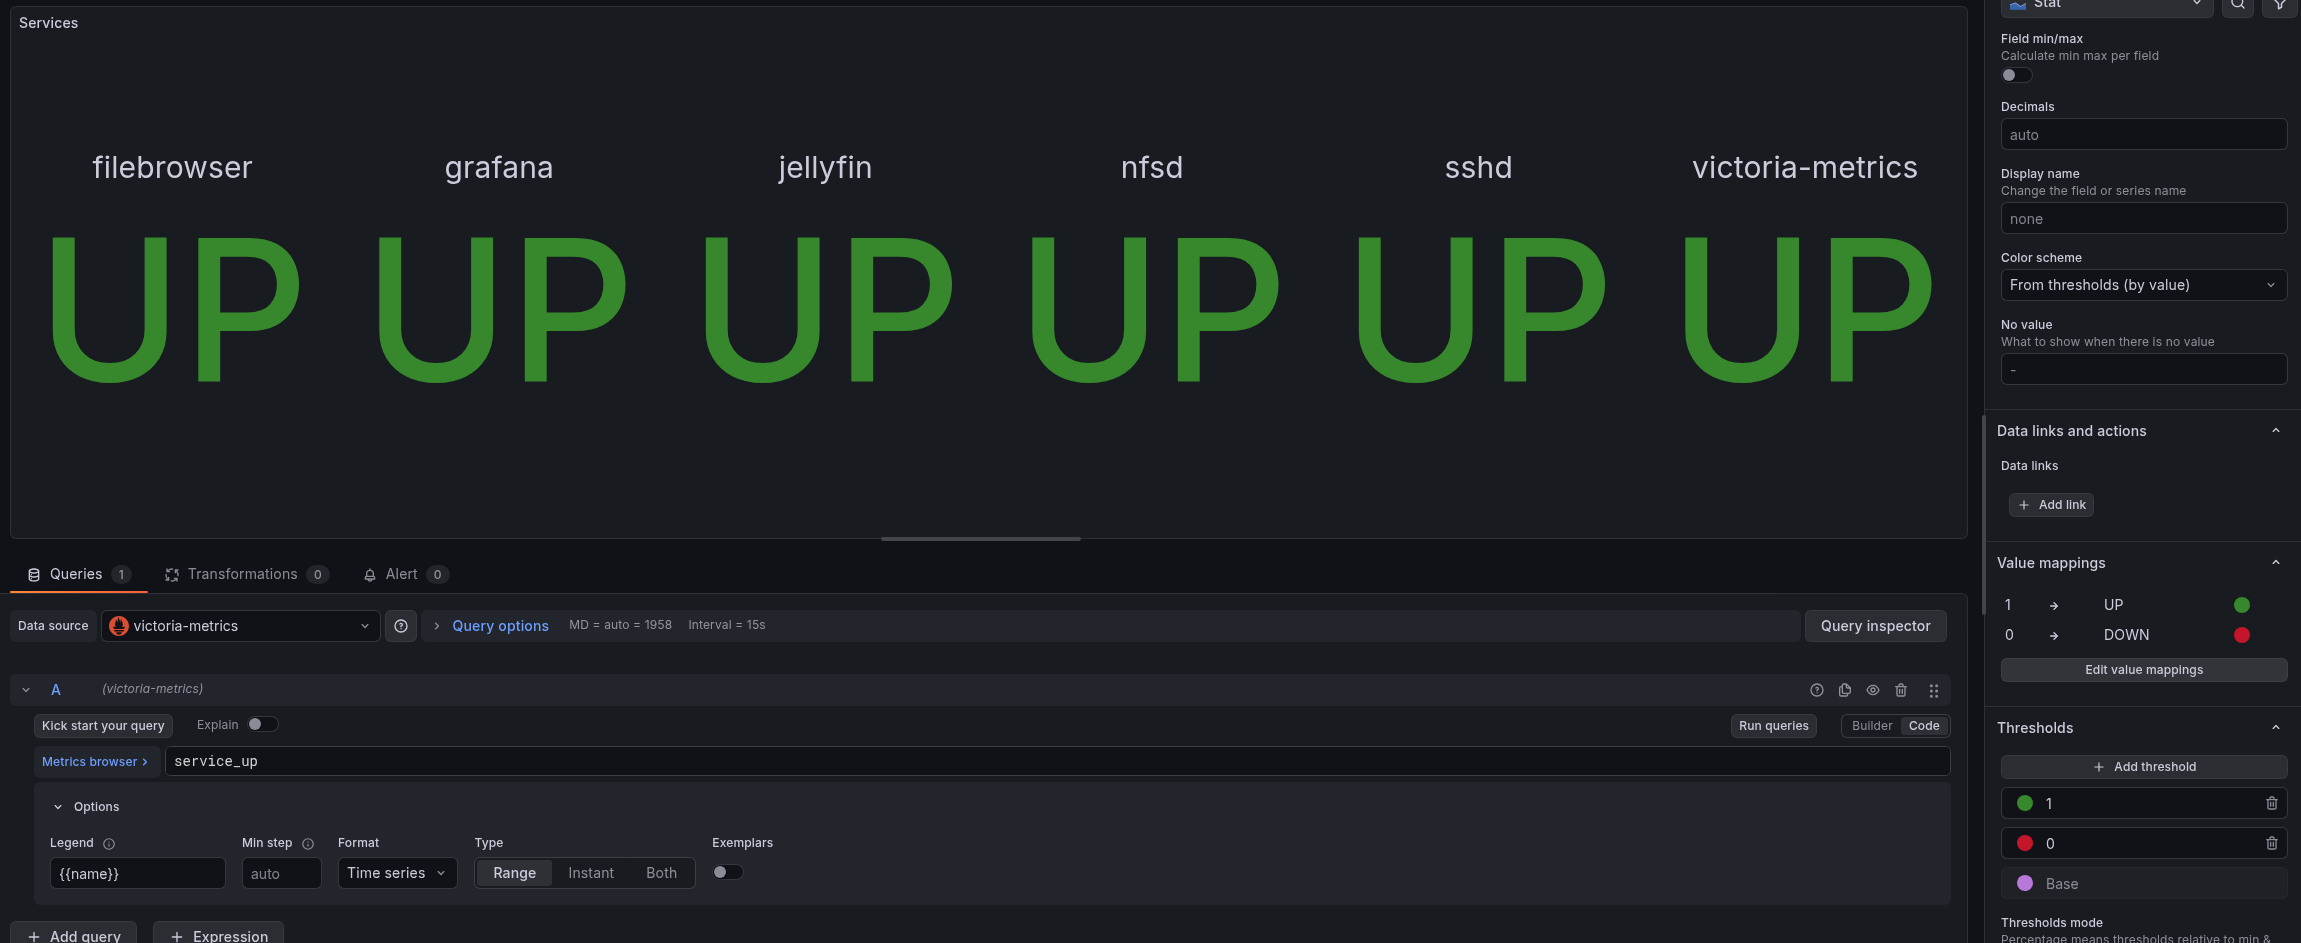
Here we check that services are running; if everything is OK, we write 1 to the service_up metric, otherwise 0.
Script /usr/local/bin/service_status_exporter.sh:
#!/bin/sh

DIR="/var/tmp/node_exporter"
OUT="$DIR/service_status.prom"
TMP="$DIR/service_status.prom.tmp"

# ------------
# helpers
# ------------

check_proc() {
  pgrep -f "$1" >/dev/null 2>&1
}

check_port() {
  host="$1"
  port="$2"
  nc -z "$host" "$port" >/dev/null 2>&1
}

# ----------------
# write metrics (atomic)
# ----------------

cat < "$TMP"
# HELP service_up Service availability status (1 = up, 0 = down)
# TYPE service_up gauge
EOF

# jellyfin
if check_port 127.0.0.1 8096; then
  echo 'service_up{name="jellyfin"} 1' >> "$TMP"
else
  echo 'service_up{name="jellyfin"} 0' >> "$TMP"
fi

# filebrowser
if check_port 127.0.0.1 8080; then
  echo 'service_up{name="filebrowser"} 1' >> "$TMP"
else
  echo 'service_up{name="filebrowser"} 0' >> "$TMP"
fi

# grafana
if check_port 127.0.0.1 3000; then
  echo 'service_up{name="grafana"} 1' >> "$TMP"
else
  echo 'service_up{name="grafana"} 0' >> "$TMP"
fi

# victoria-metrics
if check_port 127.0.0.1 8428; then
  echo 'service_up{name="victoria-metrics"} 1' >> "$TMP"
else
  echo 'service_up{name="victoria-metrics"} 0' >> "$TMP"
fi

# sshd (port only)
if check_port 127.0.0.1 22; then
  echo 'service_up{name="sshd"} 1' >> "$TMP"
else
  echo 'service_up{name="sshd"} 0' >> "$TMP"
fi

# nfsd (process only)
if check_proc nfsd; then
  echo 'service_up{name="nfsd"} 1' >> "$TMP"
else
  echo 'service_up{name="nfsd"} 0' >> "$TMP"
fi

# atomic replace
mv "$TMP" "$OUT"
And metrics:
Grafana dashboard – new graphs
And now let’s add all this to Grafana.
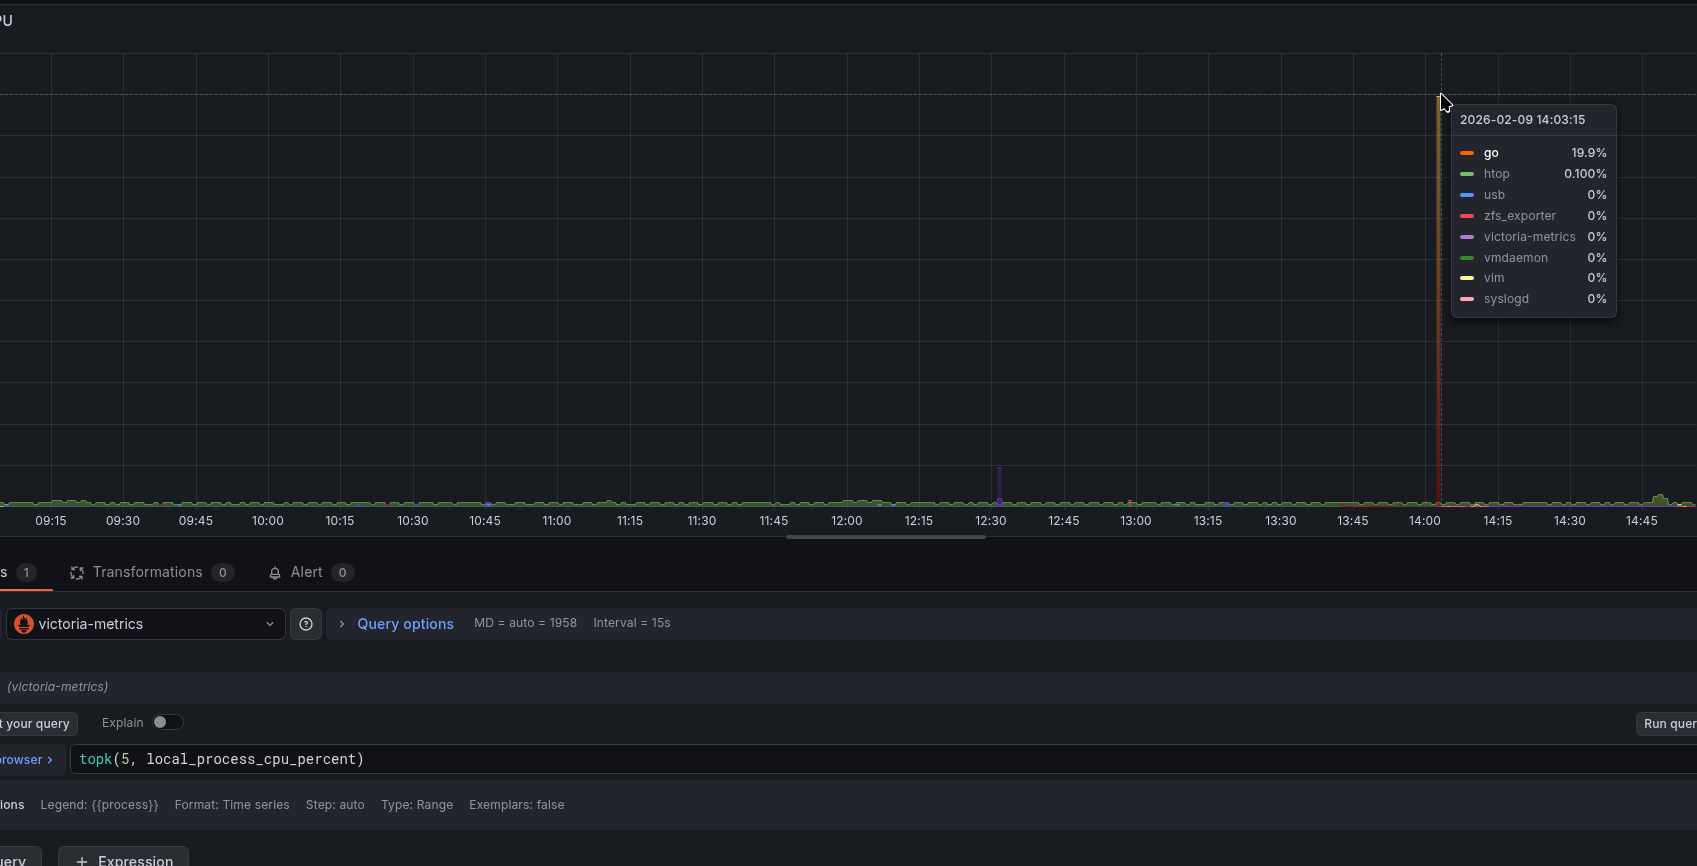
CPU by process graph:
topk(5, local_process_cpu_percent)
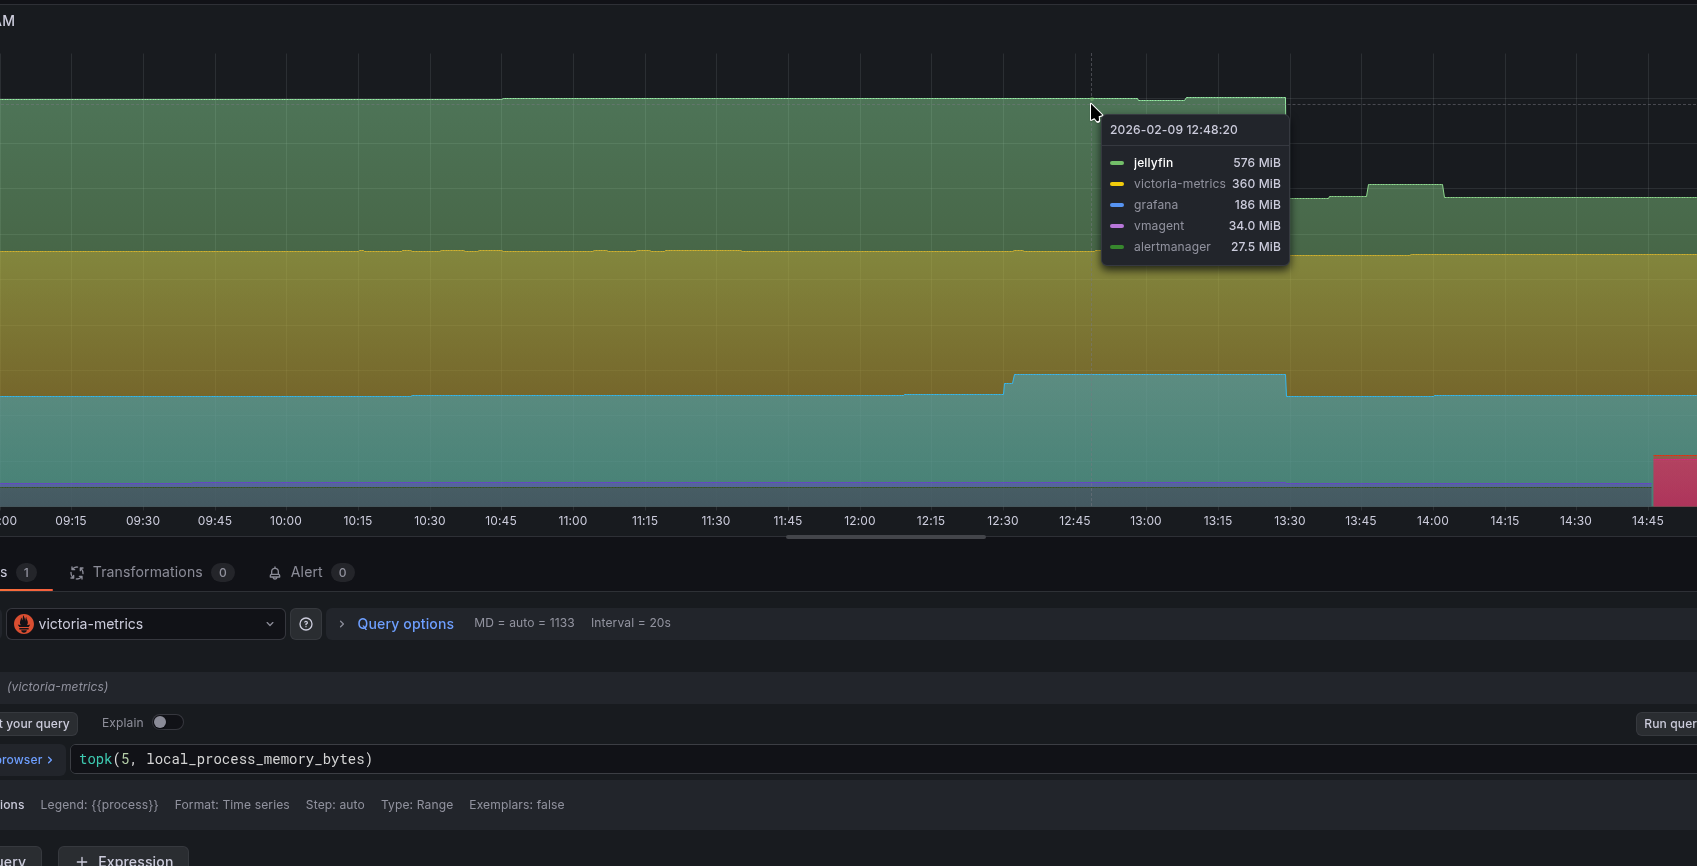
Similarly for memory:
Disk status from SMART:
smartctl_device_smart_status
Service states:
And everything together now:
All that’s left is to add alerts – and, in principle, the monitoring is ready.
![]()

