 Finally got around to monitoring.
I was interested in running a standard stack with VictoriaMetrics + Grafana + Alertmanager not in the usual Kubernetes with a Helm chart, but simply on the host.
However, the approach is the same as monitoring services in AWS/Kubernetes – on FreeBSD, we will have VictoriaMetrics for metrics, Grafana for visualization, and VMAlert plus Alertmanager for alerts.
Although for monitoring my EcoFlow devices I set up alerts via Grafana Alerts (tried them for the first time – not bad), the standard approach where all Alert Rules are described in files still appeals to me more.
All parts of the series on setting up a home NAS on FreeBSD:
- FreeBSD: Home NAS, part 1 – configuring ZFS mirror (RAID1)
- FreeBSD: Home NAS, part 2 – introduction to Packet Filter (PF) firewall
- FreeBSD: Home NAS, part 3 – WireGuard VPN, Linux peer, and routing
- FreeBSD: Home NAS, part 4 – Local DNS with Unbound
- FreeBSD: Home NAS, part 5 – ZFS pool, datasets, snapshots, and ZFS monitoring
- FreeBSD: Home NAS, part 6 – Samba server and client connections
- FreeBSD: Home NAS, part 7 – NFSv4 and use with Linux clients
- FreeBSD: Home NAS, part 8 – NFS and Samba data backup with restic
- FreeBSD: Home NAS, part 9 – data backup to AWS S3 and Google Drive with rclone
- (current) FreeBSD: Home NAS, part 10 – monitoring with VictoriaMetrics and Grafana
- FreeBSD: Home NAS, part 11 – extended monitoring with additional exporters
- FreeBSD: Home NAS, part 12: synchronizing data with Syncthing
- FreeBSD: Home NAS, Part 13: Planning Data Storage and Backups
- FreeBSD: Home NAS, part 14 – logs with VictoriaLogs and alerts with VMAlert
- FreeBSD: Home NAS, Part 15: Automating Backups – scripts, rsync, rclone
- (to be continued)
Since this is a small home NAS accessible only in the local network via VPN, I will do this without FreeBSD Jails. I might get to know them closer another time, as in all my years of using FreeBSD (since… 2007? around then), I have never actually tinkered with jails.
Let’s go.
Contents
Installing VictoriaMetrics
VictoriaMetrics is available in the FreeBSD ports and repository, although the ports differ slightly from the usual scheme – we will look at these nuances later.
Install VictoriaMetrics itself from the FreeBSD repository:
root@setevoy-nas:~ # pkg install -y victoria-metrics
Check what and where it installed:
root@setevoy-nas:~ # pkg info -l victoria-metrics | grep -E 'bin|rc.d'
        /usr/local/bin/victoria-metrics
        /usr/local/etc/rc.d/victoria-metrics
The file /usr/local/etc/rc.d/victoria-metrics contains a list of flags we can pass via /etc/rc.conf:
root@setevoy-nas:~ # cat /usr/local/etc/rc.d/victoria-metrics | grep victoria_metrics
# PROVIDE: victoria_metrics
name="victoria_metrics"
rcvar="victoria_metrics_enable"
logfile="${logdir}/victoria_metrics.log"
victoria_metrics_args=${victoria_metrics_args-"--storageDataPath=/var/db/victoria-metrics --retentionPeriod=1 --httpListenAddr=:8428"}
victoria_metrics_user="victoria-metrics"
Data will be stored in /var/db/victoria-metrics; we’ll need to add this to the backups later.
Add the service startup to /etc/rc.conf:
root@setevoy-nas:~ # sysrc victoria_metrics_enable="yes"
victoria_metrics_enable:  -> yes
Start it:
root@setevoy-nas:~ # service victoria-metrics start
Check the ports:
root@setevoy-nas:~ # netstat -an | grep 8428
tcp4       0      0 *.8428                 *.*                    LISTEN
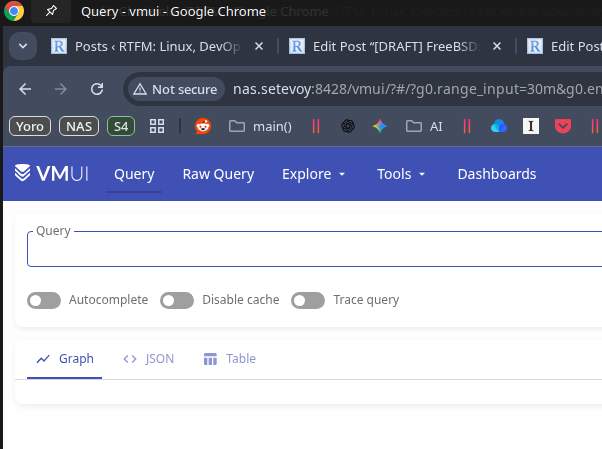
Open it in a browser – everything works:
Installing node_exporter
To see some metrics in VictoriaMetrics, let’s install the familiar node_exporter:
root@setevoy-nas:~ # pkg install -y node_exporter
Enable its startup:
root@setevoy-nas:~ # sysrc node_exporter_enable="yes"
node_exporter_enable:  -> yes
Start it:
root@setevoy-nas:~ # service node_exporter start
Starting node_exporter.
Check the port:
root@setevoy-nas:~ # netstat -an | grep 9100
tcp46      0      0 *.9100                 *.*                    LISTEN
Installing VMAgent
There are a few differences here, as there is no separate FreeBSD port for VMAgent – instead, there is a general vmutils package that installs several components at once:
root@setevoy-nas:~ # pkg install -y vmutils
Check what it added:
root@setevoy-nas:~ # pkg info -l vmutils | grep bin
        /usr/local/bin/vmagent
        /usr/local/bin/vmalert
        /usr/local/bin/vmauth
        /usr/local/bin/vmbackup
        /usr/local/bin/vmctl
        /usr/local/bin/vmrestore
However, vmutils only installs one rc.d script, for vmagent itself:
root@setevoy-nas:~ # pkg info -l vmutils | grep rc.d
        /usr/local/etc/rc.d/vmagent
Therefore, we will write our own for VMAlert later.
Add vmagent to rc.conf:
root@setevoy-nas:~ # sysrc vmagent_enable="yes"
vmagent_enable:  -> yes
Don’t start it yet – let’s configure metric scraping from the node_exporter first.
Check the options vmagent starts with by looking at the default config file:
root@setevoy-nas:~ # cat /usr/local/etc/rc.d/vmagent
#!/bin/sh
...
vmagent_args=${vmagent_args-"--remoteWrite.tmpDataPath=/var/db/vmagent --promscrape.config=/usr/local/etc/prometheus/prometheus.yml --remoteWrite.url=http://127.0.0.1:8428/api/v1/write --memory.allowedPercent=80"}
...
Add job="node_exporter" to /usr/local/etc/prometheus/prometheus.yml:
global:
  scrape_interval: 15s

scrape_configs:

  - job_name: vmagent
    scrape_interval: 60s
    scrape_timeout: 30s
    metrics_path: "/metrics"
    static_configs:
    - targets:
      - 127.0.0.1:8429
      labels:
        project: vmagent

  - job_name: "node_exporter"
    static_configs:
      - targets:
          - "127.0.0.1:9100"
Verify the syntax:
root@setevoy-nas:~ # service vmagent checkconfig; echo $?
0
Start the service:
root@setevoy-nas:~ # service vmagent start
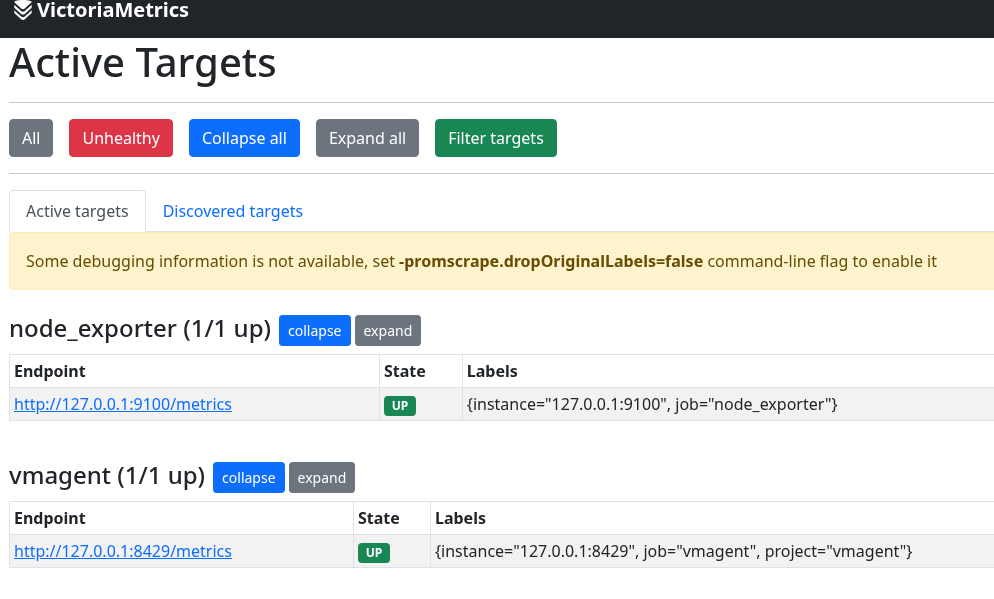
Check VMAgent /targets at http://nas.setevoy:8429/targets:
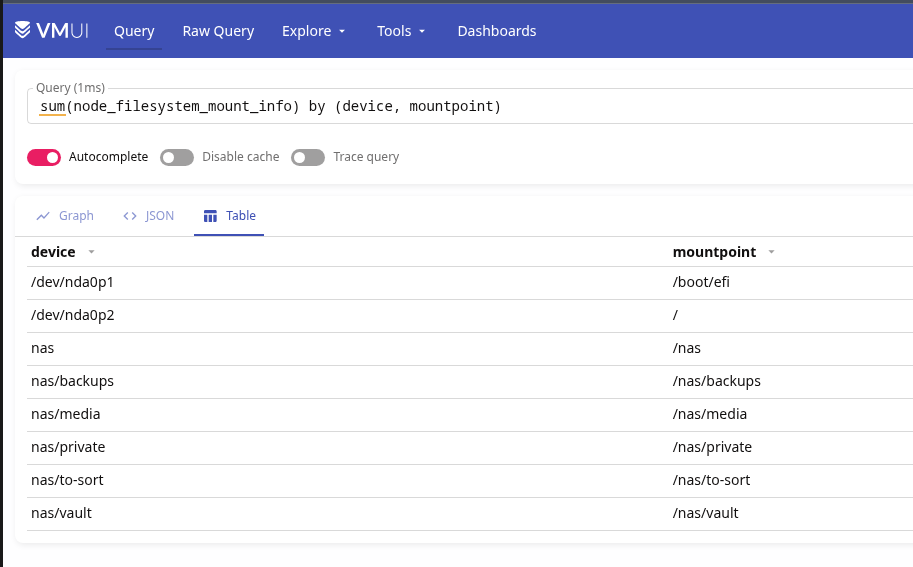
And metrics in VictoriaMetrics:
Installing Grafana
Install this from the repository as well:
root@setevoy-nas:~ # pkg install -y grafana
Config file – /usr/local/etc/grafana/grafana.ini.
Enable its startup:
root@setevoy-nas:~ # sysrc grafana_enable="yes"
grafana_enable:  -> yes
Start it:
root@setevoy-nas:~ # service grafana start
Starting grafana.
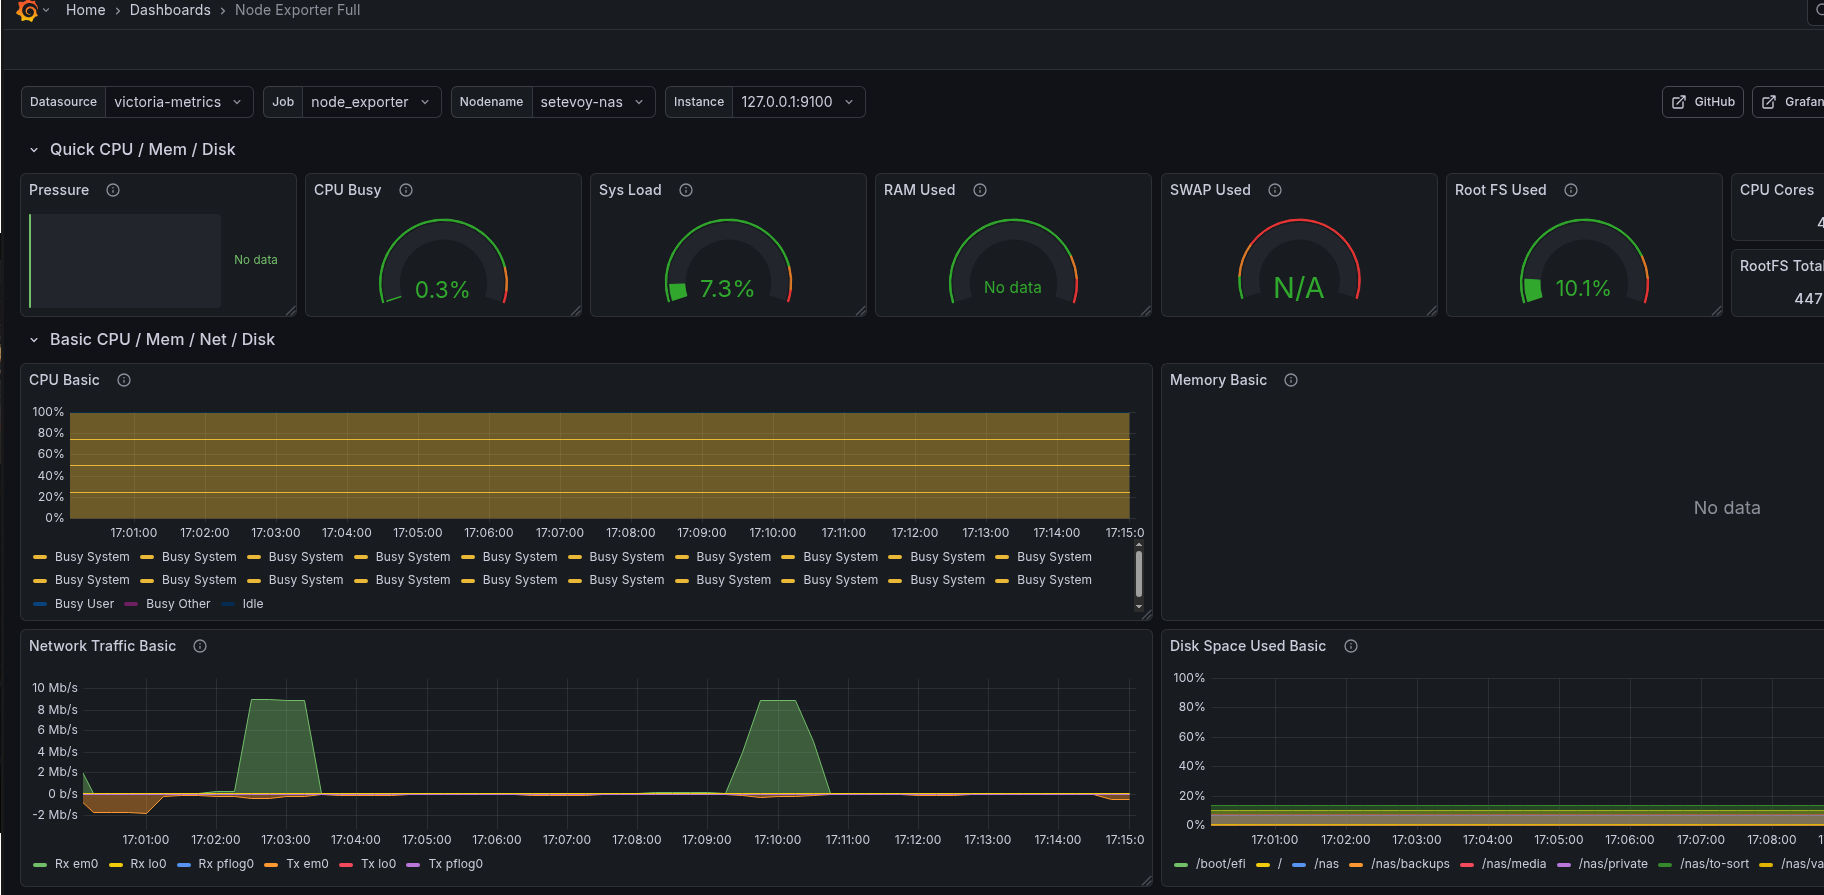
For testing, you can use a ready-made dashboard – Node Exporter Full.
VictoriaMetrics Grafana data source on FreeBSD
Add the datasource:
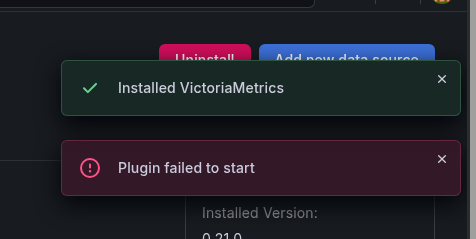
But I immediately hit an error:
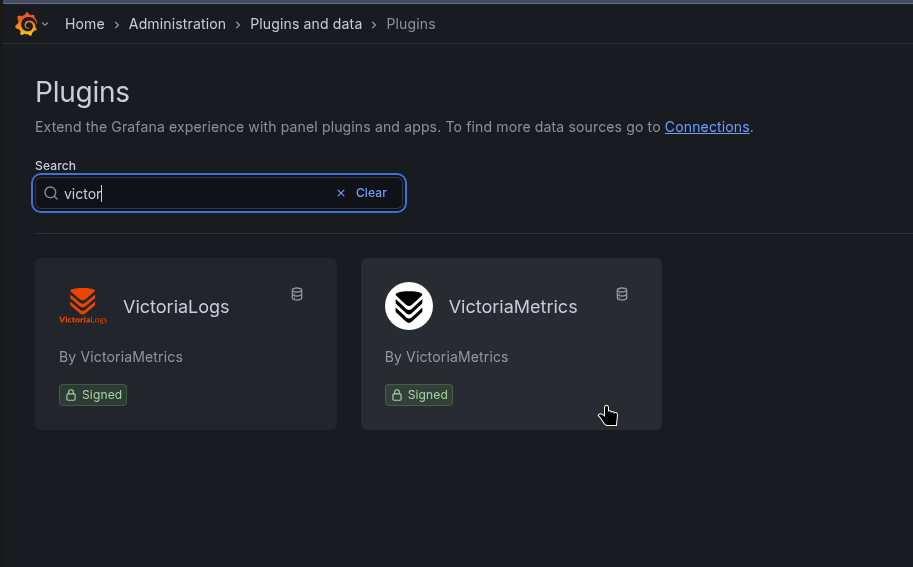
Although the plugin is 100% signed, as it’s not the first time I’ve used it in work projects:
I tried adding allow_loading_unsigned_plugins to /usr/local/etc/grafana/grafana.ini:
...
allow_loading_unsigned_plugins = victoriametrics-metrics-datasource
...
Or installing from the Grafana CLI:
root@setevoy-nas:~ # grafana cli plugins install victoriametrics-metrics-datasource
Grafana-server Init Failed: Could not find config defaults, make sure homepath command line parameter is set or working directory is homepat
Didn’t help.
Then I checked the Grafana logs:
...
logger=installer.fs t=2026-02-06T17:09:29.946038823+02:00 level=info msg="Downloaded and extracted victoriametrics-metrics-datasource v0.21.0 zip successfully to /var/db/grafana/plugins/victoriametrics-metrics-datasource"
logger=plugins.backend.start t=2026-02-06T17:09:30.466419686+02:00 level=error msg="Could not start plugin backend" pluginId=victoriametrics-metrics-datasource error="fork/exec /var/db/grafana/plugins/victoriametrics-metrics-datasource/victoriametrics_metrics_backend_plugin_freebsd_amd64: no such file or directory"
...
“victoriametrics_metrics_backend_plugin_freebsd_amd64: no such file or directory”
Oh, c’mon…
I didn’t investigate further – we can simply use the standard Prometheus plugin (but I’ll ask the VictoriaMetrics developers about this issue later).
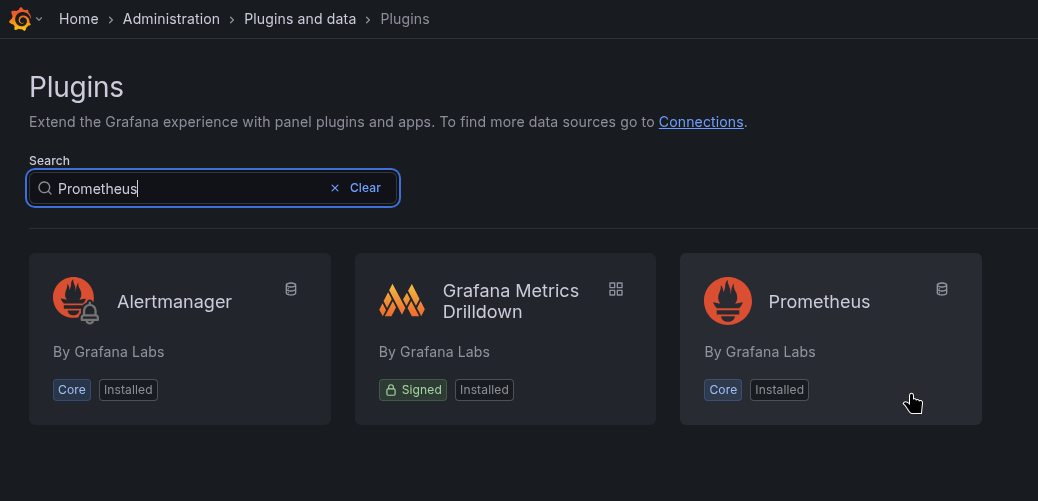
Actually, if memory serves, before VictoriaMetrics had its own Grafana plugin, we used the default Prometheus one that comes bundled with Grafana:
Add a new data source:
Name it victoria-metrics, and set the URL:
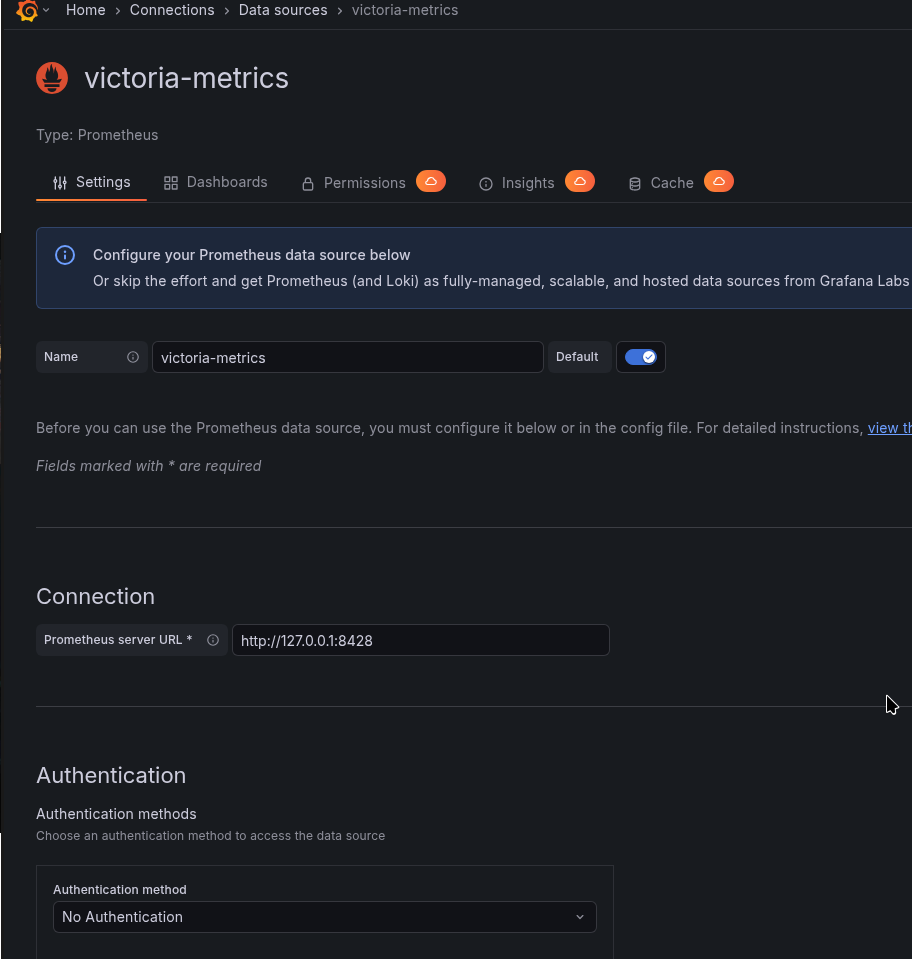
And now everything works:
Setting up Alerting
I use Arch ntfy.sh BTW.
It’s a very cool and simple service. It has a web interface and a mobile app. I might write about it separately sometime because I’m absolutely delighted with it.
You can set up alerts through Telegram – I might add that later, but for now, ntfy.sh is more than enough.
So, we already have VMlert – it calculates the rules we set and sends them to Alertmanager.
Installing Alertmanager
Also from the FreeBSD repository:
root@setevoy-nas:~ # pkg install -y alertmanager
Enable its startup:
root@setevoy-nas:~ # sysrc alertmanager_enable="yes"
alertmanager_enable:  -> yes
Remove the default file, as it has a lot of unnecessary stuff:
root@setevoy-nas:~ # mv /usr/local/etc/alertmanager/alertmanager.yml /usr/local/etc/alertmanager/alertmanager.yml-default
Write our own config /usr/local/etc/alertmanager/alertmanager.yml:
global:
  resolve_timeout: 5m

route:
  receiver: "ntfy"
  group_by: ["alertname"]
  group_wait: 10s
  group_interval: 5m
  repeat_interval: 4h

receivers:
  - name: "ntfy"
    webhook_configs:
      - url: "https://ntfy.sh/setevoy-alertmanager-alerts"
        http_config:
          authorization:
            type: Bearer
            credentials: "tk_v9c***f2p"
        send_resolved: true
Start Alertmanager:
root@setevoy-nas:~ # service alertmanager restart
Check its dashboard at http://nas.setevoy:9093/#/alerts:
Installing VMAlert
The vmalert binary is already installed from the vmutils package, but there is no rc.d script for it:
root@setevoy-nas:~ # pkg info -l vmutils | grep rc.d
        /usr/local/etc/rc.d/vmagent
root@setevoy-nas:~ # pkg info -l vmutils | grep bin
        /usr/local/bin/vmagent
        /usr/local/bin/vmalert
        /usr/local/bin/vmauth
        /usr/local/bin/vmbackup
        /usr/local/bin/vmctl
        /usr/local/bin/vmrestore
So we’ll write our own /usr/local/etc/rc.d/vmalert – it’s simple enough to vibecode without issues:
#!/bin/sh

# PROVIDE: vmalert
# REQUIRE: LOGIN
# KEYWORD: shutdown

. /etc/rc.subr

name="vmalert"
rcvar="vmalert_enable"

load_rc_config $name

: ${vmalert_enable:="NO"}
: ${vmalert_user:="victoria-metrics"}
: ${vmalert_args:="--datasource.url=http://127.0.0.1:8428 --notifier.url=http://127.0.0.1:9093 --rule=/usr/local/etc/vmalert/*.yml"}

pidfile="/var/run/${name}.pid"
command="/usr/sbin/daemon"
procname="/usr/local/bin/vmalert"

command_args="-f -p ${pidfile} ${procname} ${vmalert_args}"

start_cmd="vmalert_start"
stop_cmd="vmalert_stop"

vmalert_start()
{
  echo "Starting vmalert"
  ${command} ${command_args}
}

vmalert_stop()
{
  echo "Stopping vmalert"
  kill `cat ${pidfile}`
}

run_rc_command "$1"
Set execution permissions:
# chmod +x /usr/local/etc/rc.d/vmalert
Add to system startup:
root@setevoy-nas:~ # sysrc vmalert_enable="yes"
vmalert_enable:  -> yes
And start it:
root@setevoy-nas:~ # service vmalert start
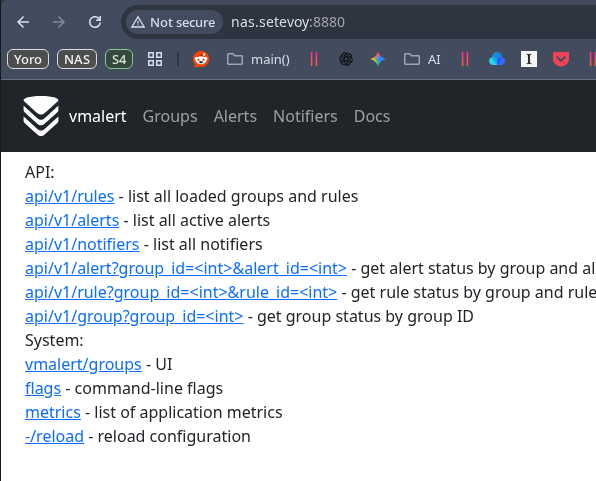
Check it at http://nas.setevoy:8880:
Adding alerts
Now we can throw in some alerts.
Create the file /usr/local/etc/vmalert/node-alerts.yml:
root@setevoy-nas:~ # mkdir -p /usr/local/etc/vmalert/
Define an alert:
groups:
  - name: node-exporter-alerts
    rules:
      - alert: NodeExporterDown
        expr: up{job="node_exporter"} == 0
        for: 1m
        labels:
          severity: critical
        annotations:
          summary: "node_exporter down on {{ $labels.instance }}"
          description: "node_exporter is not reachable for more than 1 minute"
Restart vmalert:
root@setevoy-nas:~ # service vmalert restart
To test, stop node_exporter:
root@setevoy-nas:~ # service node_exporter stop
Stopping node_exporter.
Waiting for PIDS: 1965.
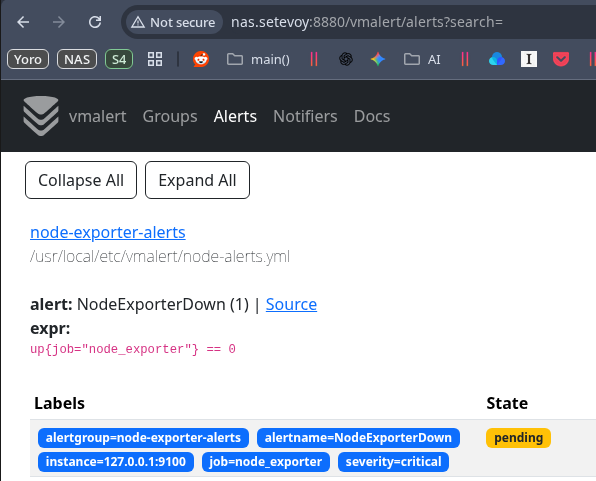
And we get the alert in VMAlert:
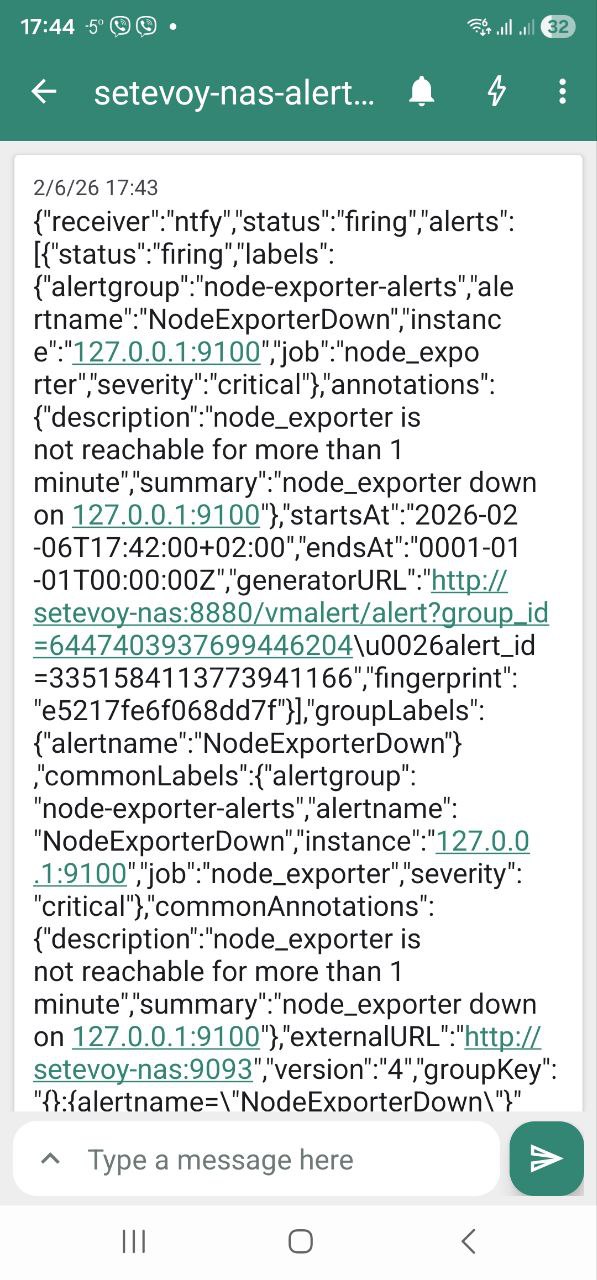
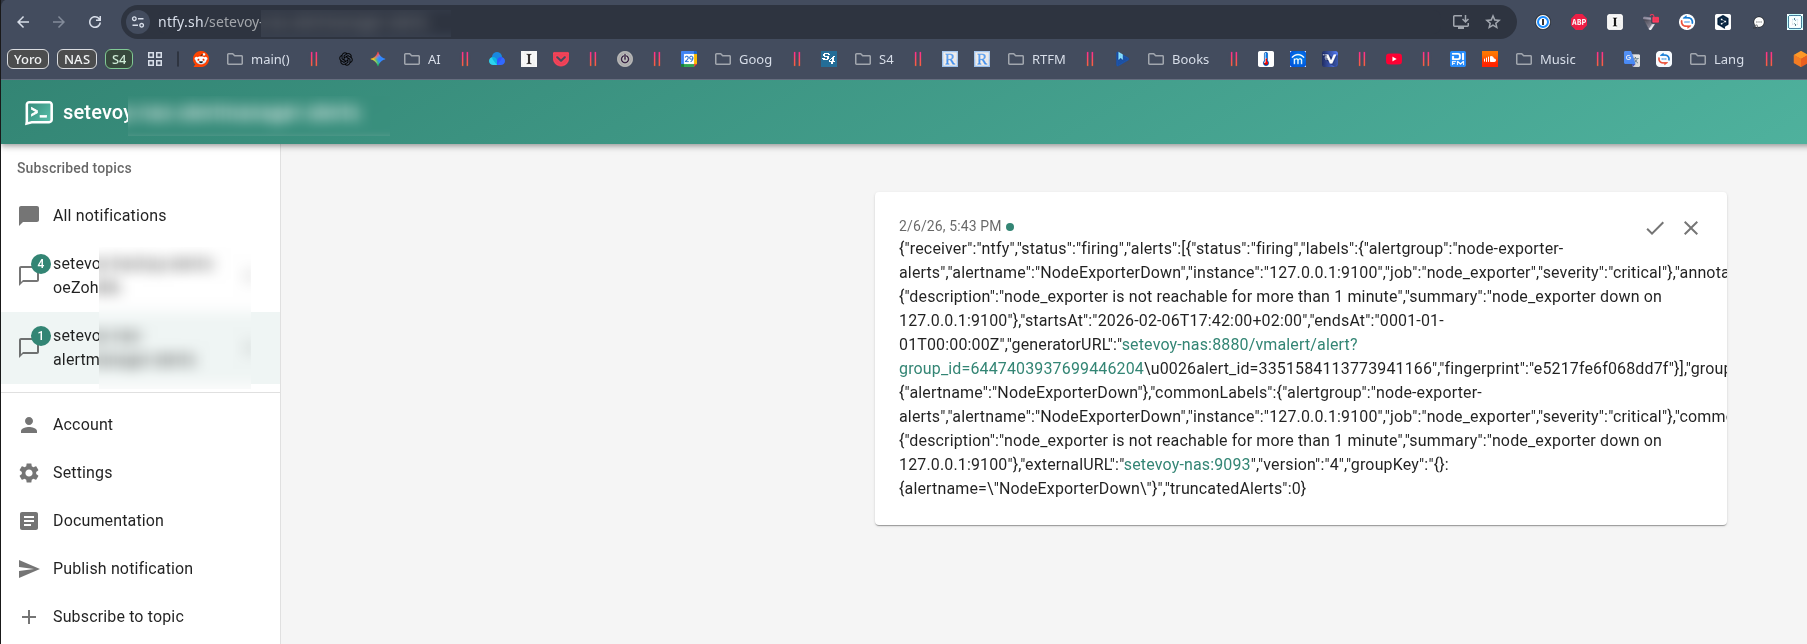
And a notification from ntfy.sh.
On the phone:
Tuning Grafana dashboard and node_exporter Memory graphs
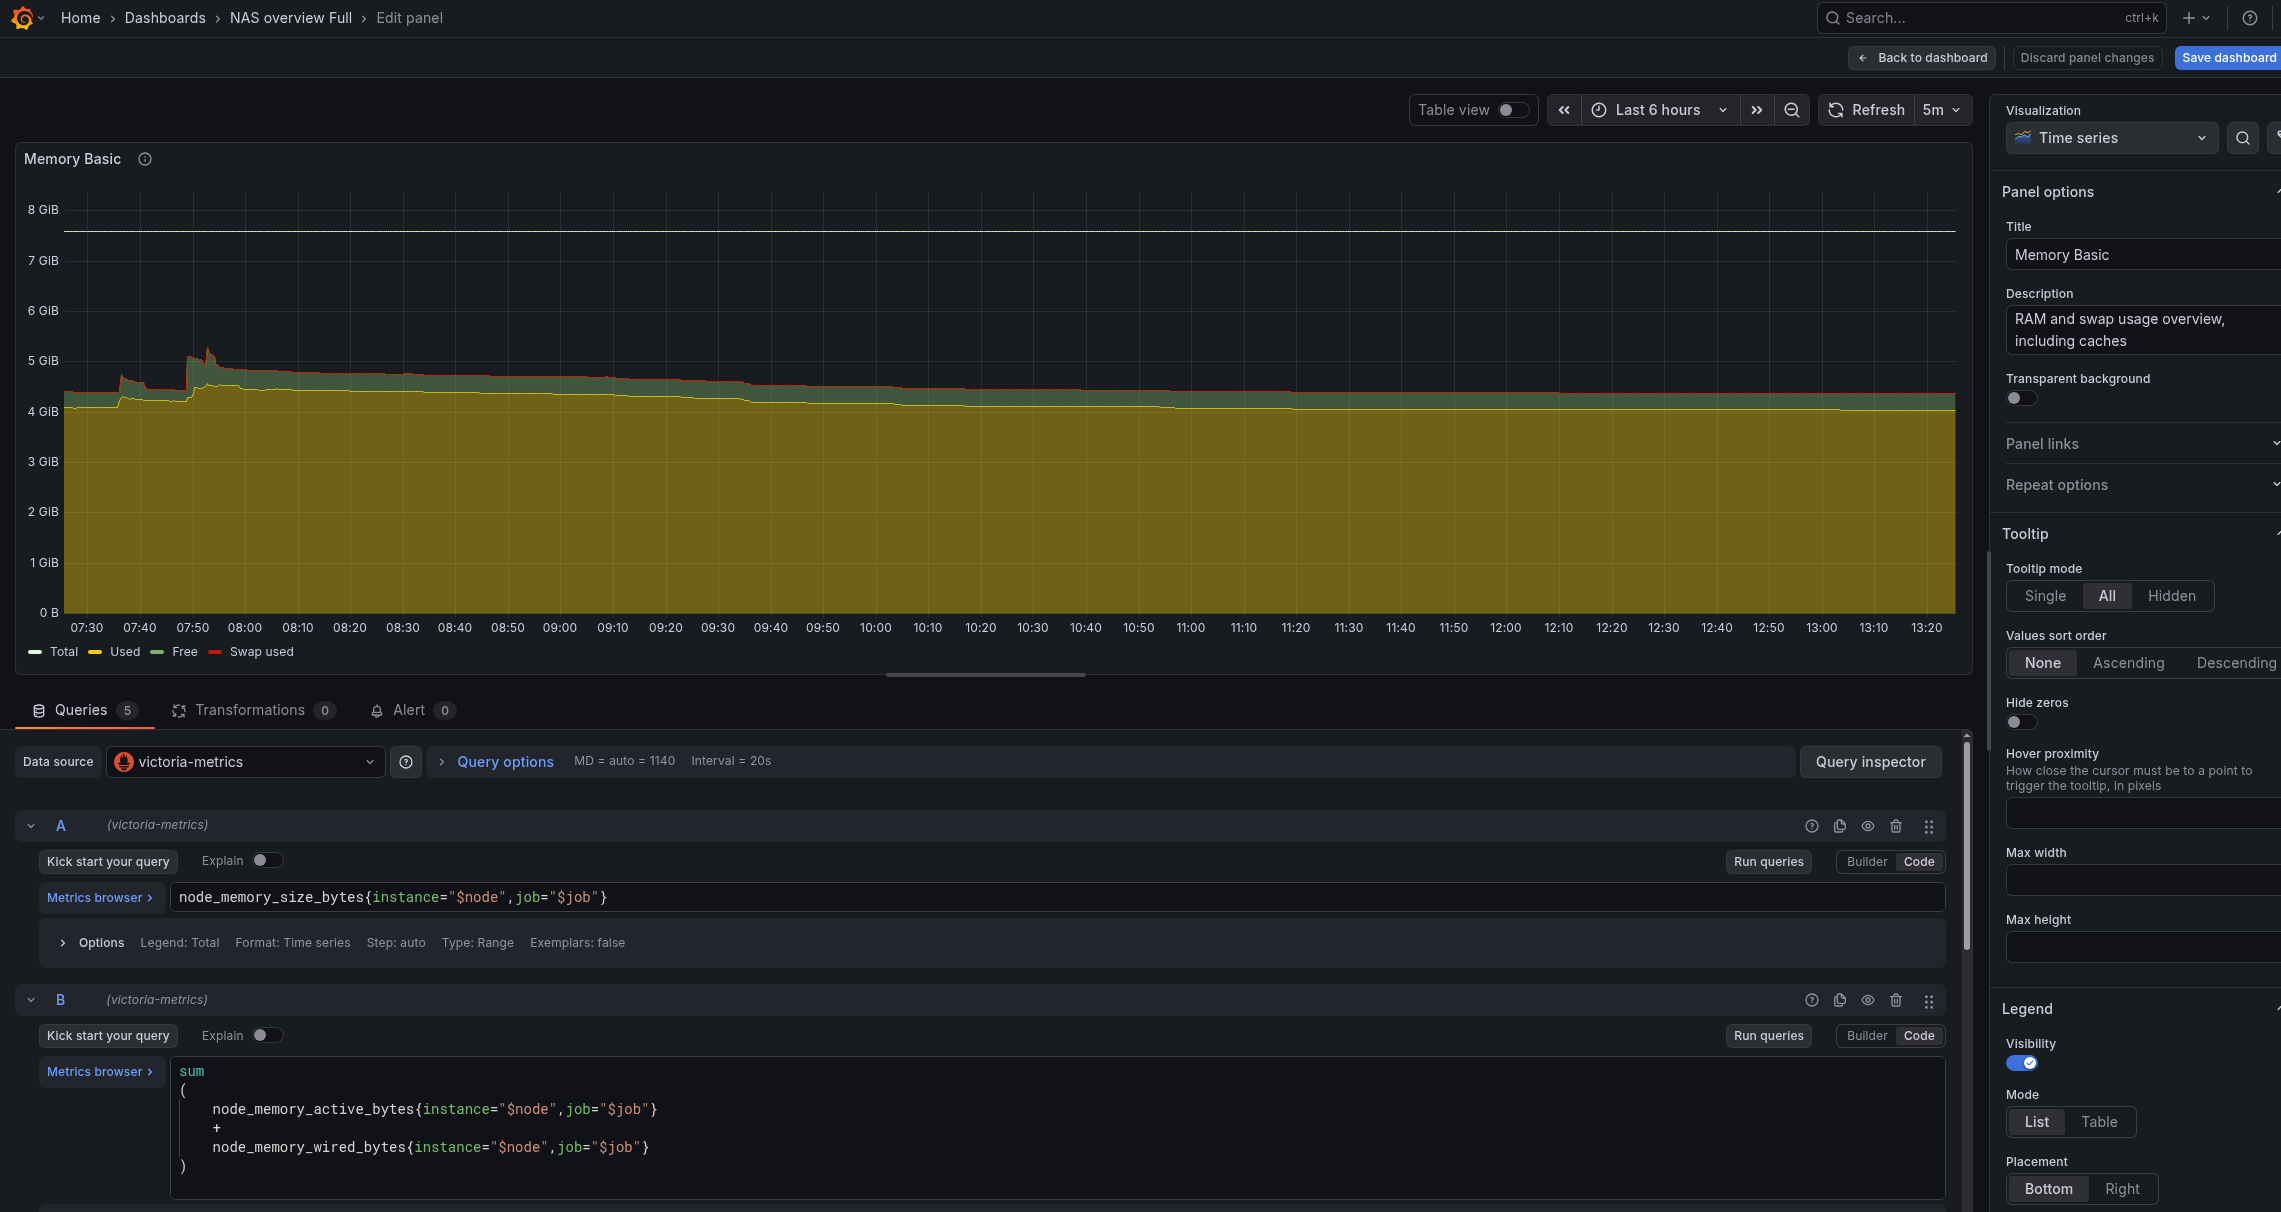
The default dashboard is tuned for Linux, and on FreeBSD, to display charts in “Memory Basic” correctly, we need to tune the queries and metrics a bit.
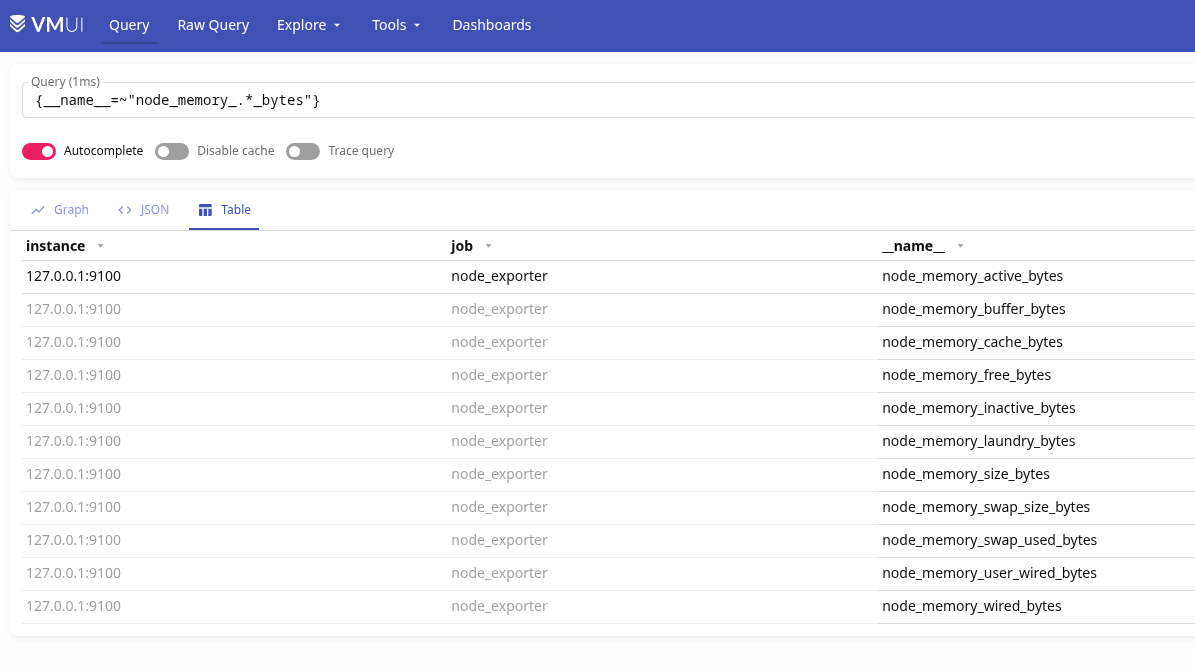
Check available memory metrics from node_exporter:
{__name__=~"node_memory_.*_bytes"}
The primary ones are:
node_memory_size_bytes: total RAMnode_memory_free_bytes: actually freenode_memory_cache_bytes: filesystem cache (reclaimable)node_memory_buffer_bytes: buffers (reclaimable)node_memory_inactive_bytes: inactive pages (reclaimable)node_memory_active_bytes: actively usednode_memory_wired_bytes: non-reclaimable memory (kernel, drivers)
What matters to us are total memory, node_memory_free_bytes, and node_memory_active_bytes.
Free RAM in FreeBSD is truly free memory, meaning everything outside caches, inactive, wired, buffers, etc.
Therefore, we can build the visualization panel with these queries:
- Total memory:
node_memory_size_bytes
- Used memory – what is actually occupied and cannot be freed:
sum
(
    node_memory_active_bytes
    +
    node_memory_wired_bytes
)
- Free memory – everything outside all kinds of caches/buffers and other occupied memory:
node_memory_free_bytes{instance="$node",job="$job"}
- Swap used (though I don’t have any):
node_memory_swap_used_bytes{instance="$node",job="$job"}
- Display % of occupied memory relative to total:
(
  node_memory_active_bytes
  + node_memory_wired_bytes
)
/
node_memory_size_bytes
* 100
As a result, we have these memory graphs:
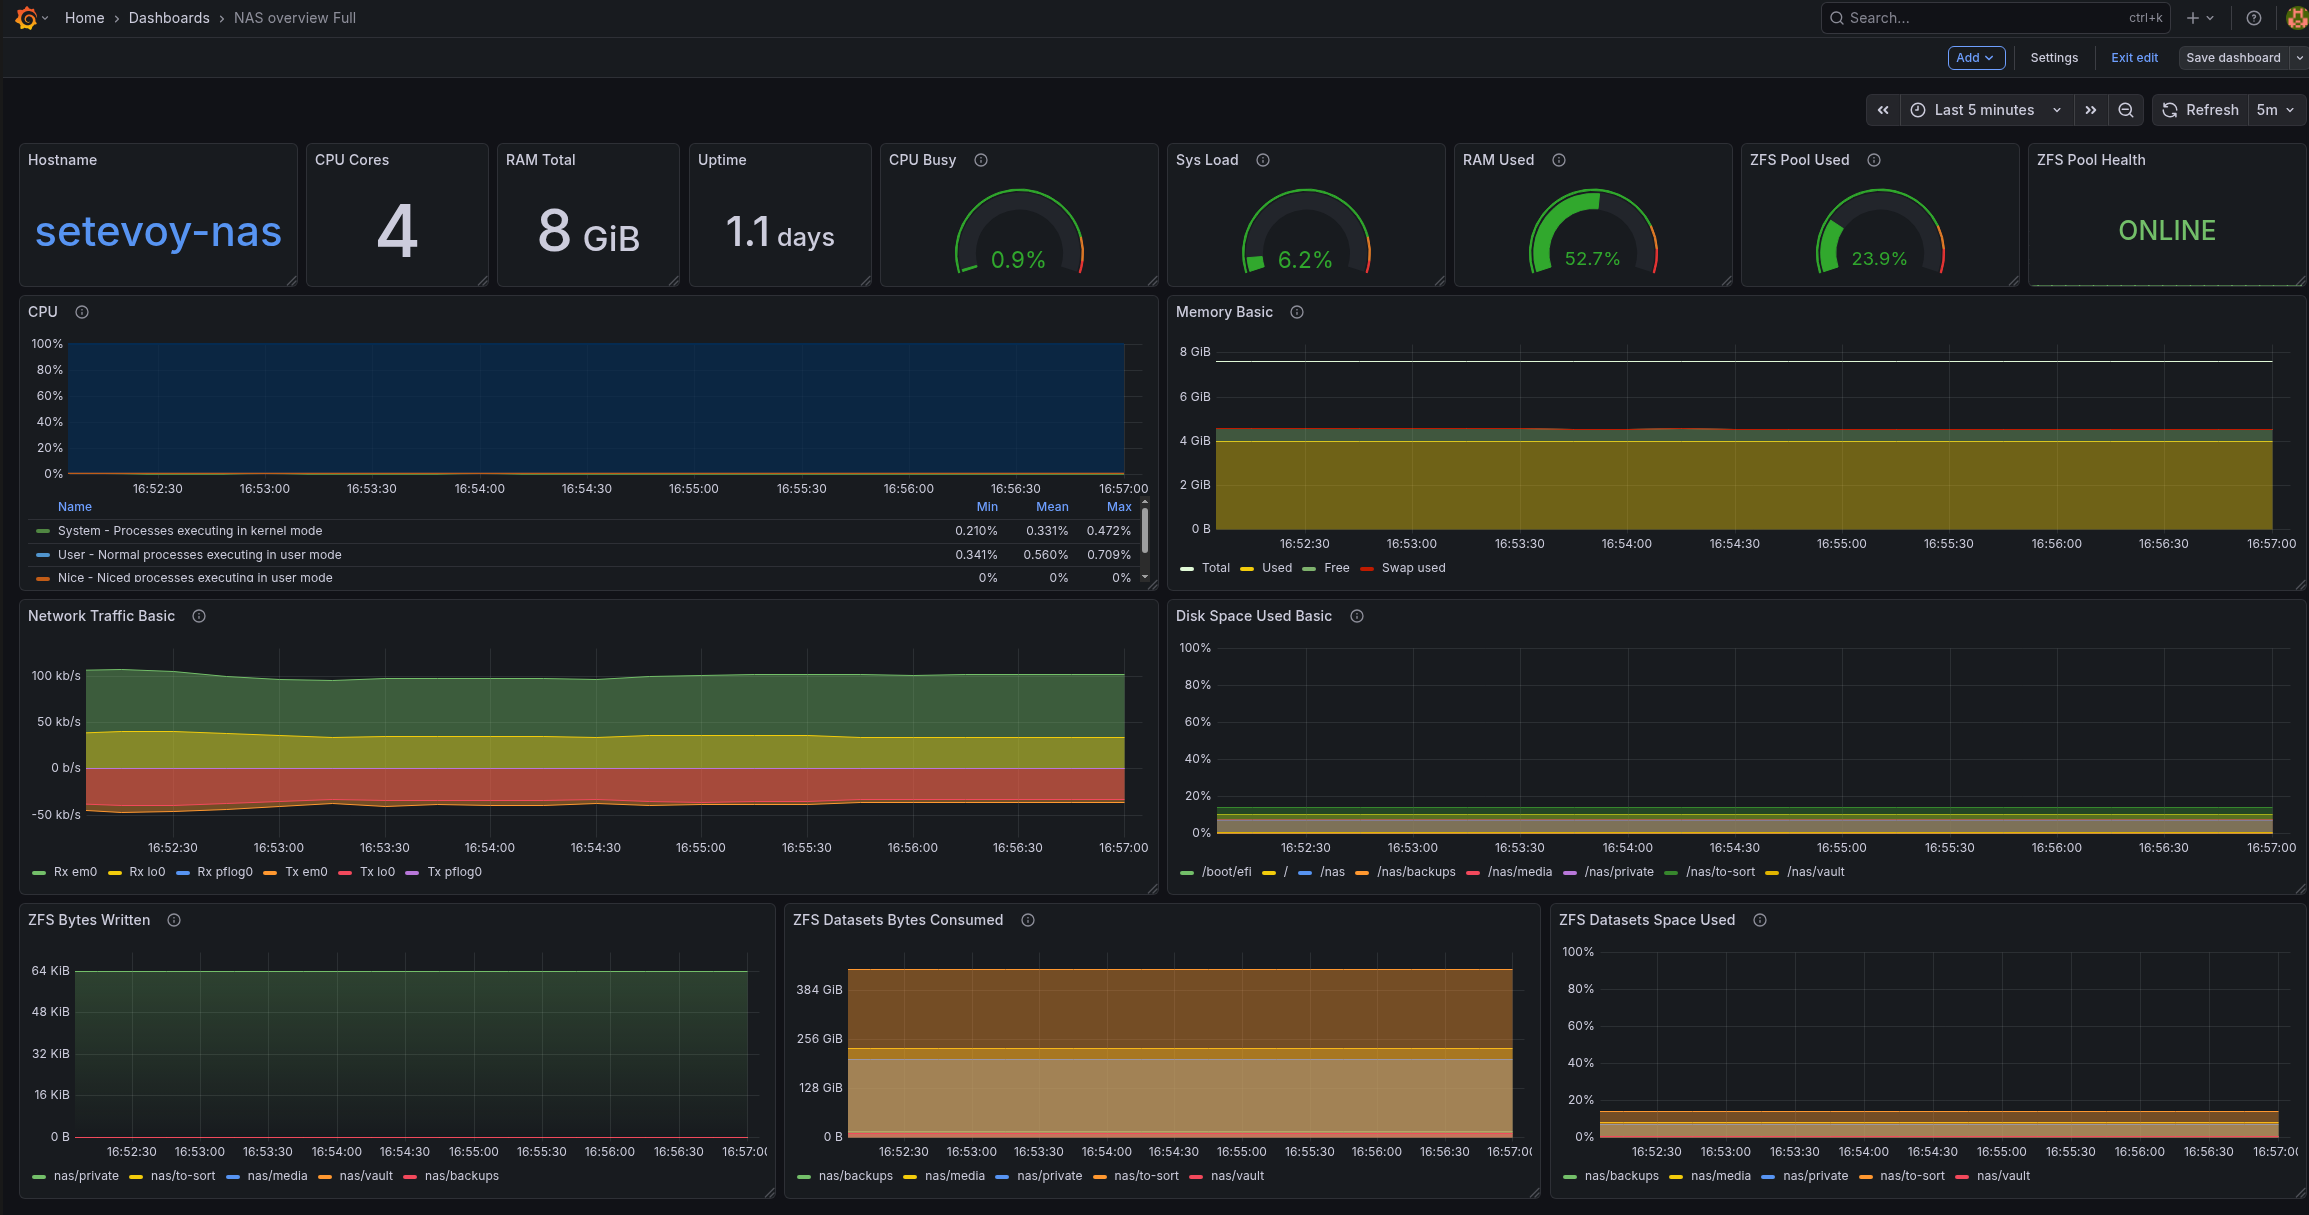
And my entire dashboard currently looks like this (here is the ZFS Exporter already added):
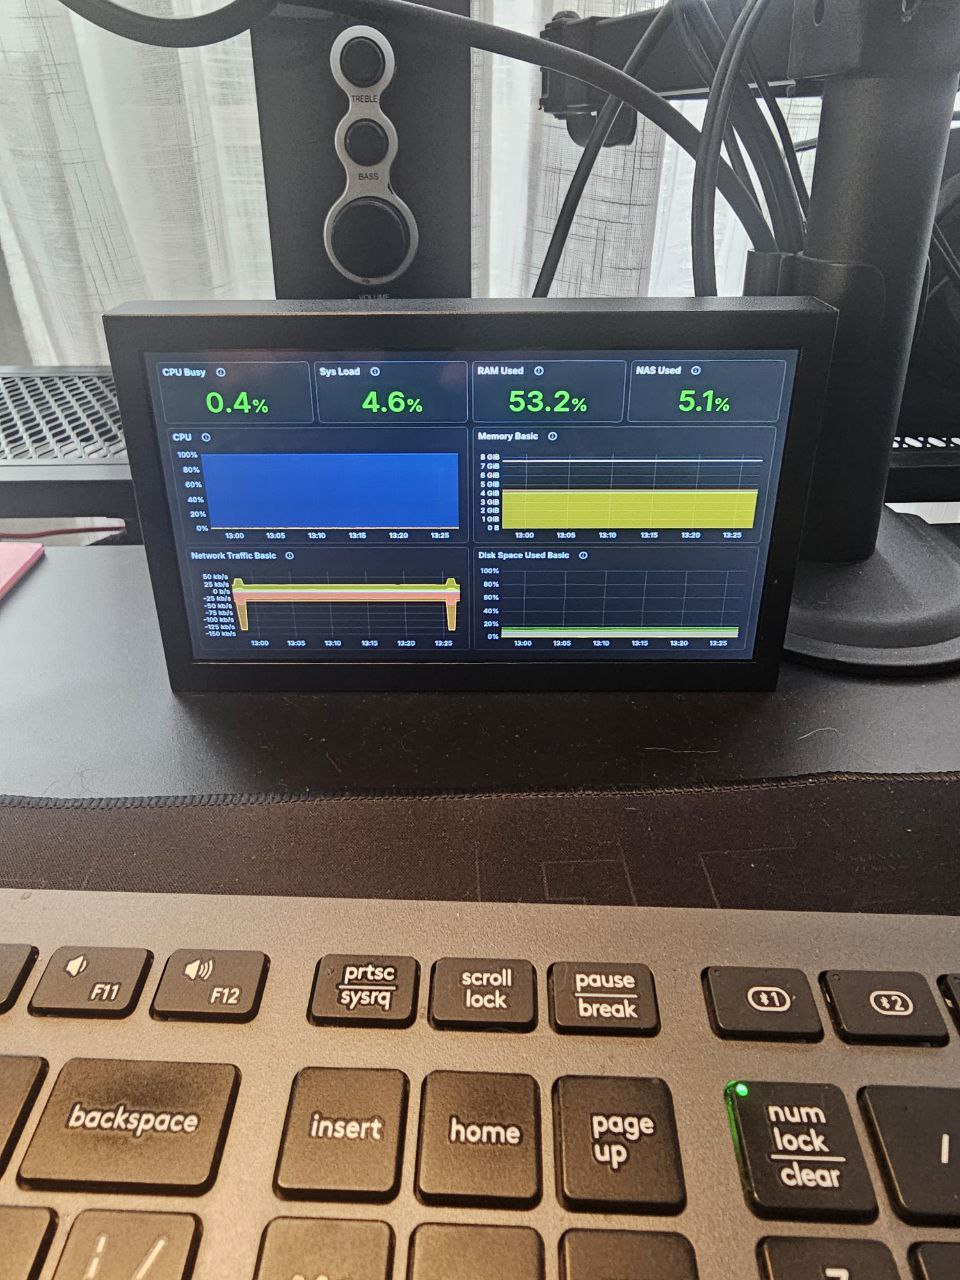
I also have a “Small” version – for display on a 7-inch monitor that will be placed in the server cabinet:
Later I will add more useful graphs and statuses to the dashboard.
Finally, for monitoring the system and NAS, it will be useful to add more exporters like smartctl_exporter, zfs_exporter, and so on.
![]()
