![]() Поки пишеться серія постів по налаштуванню і використанню Claude Code – запишу приклад створення власного AI Agent для VictoriaMetrics та Kubernetes і “загортання” його в Claude Code Plugin та створення власного Claude Code Markeplace, де будуть жити подібні плагіни для девелоперів на моєму проекті.
Поки пишеться серія постів по налаштуванню і використанню Claude Code – запишу приклад створення власного AI Agent для VictoriaMetrics та Kubernetes і “загортання” його в Claude Code Plugin та створення власного Claude Code Markeplace, де будуть жити подібні плагіни для девелоперів на моєму проекті.
Загальна ідея: мати агента, якого девелопери можуть підключити собі до Claude Code (а у нас 95% проекту користуються ним), і з яким зможуть запитати “якого біса впав той Kubernetes Pod”
І не тільки девелопери – я, коли тестив цього агента, відкрив для себе причину постійних рестартів Grafana – тому агент буде корисний і мені самому.
Є, звісно, проекти типу kubectl-ai або навіть robusta.dev – але ми побудуємо власного агента з маркетплейсом і скілами.
Що будемо робити:
- агент буде використовувати офіційні скіли від VictoriaMetrics – для самої VictoriaMetrics, VictoriaLogs та Alertmanager
- напишемо власний
SKILL.md, в кому буде описаний flow перевірки стану Kubernetes Pods – цей скіл буде включений в плагін і потім його можна буде використовувати з новими агентами - для зручного підключення агента з усіма його скілами запакуємо весь проект в плагін для Claude Code, який буде зберігатись в проектному GitHub
Сам агент, описаний тут, більше PoC в плані його інструкцій, і по ходу діла буде тюнитись і допилюватись – але загальна конструкція створення маркеплейсу, побудові агента і плагіну для Claude Code залишиться такою, як показано в цьому пості.
Зміст
Загальна структура і план
Ключові концепти про які варто знати наперед:
- Marketplace: це git-репозиторій з одним або кількома плагінами, який девелопер додає до свого інстансу Claude Code одною командою.
- Plugin: можемо “запакувати” всі Agents, Skills, Commands, MCP servers в єдиний пакет, який теж встановлюється до Claude Code одною командою
- Agent: субагент Claude Code з власним system prompt і permissions, викликається з основної сесії через Agent tool – працює в ізольованому контексті, виконує задачу, повертає результат до головного “оркестратора”, в ролі якого в нашому випадку буде Claude Code девелопера (чи мій)
- Skill: “інструкція”, яку агент читає при потребі і яка описує деталі виконання задачі
В результаті в репозиторії atlas-claude-plugins отримаємо таку структуру каталогів і файлів:
$ tree -a -I .git atlas-claude-plugins/
atlas-claude-plugins/
├── .claude
│   └── settings.json
├── .claude-plugin
│   └── marketplace.json
├── .gitignore
├── CLAUDE.md
├── README.md
├── plugins
│   └── k8s-tools
│       ├── .claude-plugin
│       │   └── plugin.json
│       ├── agents
│       │   └── k8s-pod-debugger.md
│       └── skills
│           └── k8s-troubleshooting-flow
│               └── SKILL.md
└── scripts
    └── bootstrap.sh
MCP vs Skills: чому скіли
Перша версія агента була з MCP. Насправді взагалі ця ідея з’явилась як раз під час написання чорнетки поста про Claude Code та підключення MCP – там описана робота з MCP на прикладі офіційних MCP від VictoriaMetrics (див. mcp-victoriametrics) та Kubernetes.
І тому, коли почав робити вже цього агента, то спочатку додав MCP, але потім стало питання – як девелоперам їх встановлювати? Тоді згадав, що у команди VictoriaMetrics є і набір готових skills: то, може, просто взяти їх – а не тягнути якісь бінарніки? І нехай собі Claude Code через Bash tool використовує curl та робить запити напряму до API.
Бо насправді – в чому різниця між MCP та Skill?
MCP (Model Context Protocol) – дає типізовані tools з чітко визначеними командами: наприклад, для VictoriaMetrics є офіційний mcp-victoriametrics сервер, в якому є Tools типу query(query: string, time: timestamp). Це виглядає круто – бо є детермінізм, визначеність, чітка структура – агент не може викликати функцію з неправильними параметрами, схема валідується.
Але! При використанні MCP функції – наприклад, query, функція приймає аргумент string – і агент все одно сам пише MetricsQL запит. Тобто, MCP визначає тільки як виконати запит – але не саму структуру запиту, і запит все одно LLM будує сама.
Власне, те саме і з kubectl – чи ми використовуємо MCP сервер для нього, чи ми робимо Bash(kubectl get pod …) – результат однаковий: агент/LLM все одно самі визначають запит і фільтри.
Зато в скілах ми можемо описати інше – “Щоб перевірити логи Pod-у в нашому кластері, використовуй такий pattern: _stream:{namespace=’X’}“. Це знання для агенту, яке MCP не передає.
Плюс є практичний момент:
- використання офіційного marketplace VictoriaMetrics зі скілами
victoriametrics-query,victorialogs-query,alertmanager-query– вони підтримуються командою VictoriaMetrics, оновлюються при змінах в MetricsQL/LogsQL - не треба тягнути зайві бінарні файли в систему юзера (девелопера) – простіше підключення та налаштування (хоча
bootstrap.shвсе одно треба додати, да і скіли VictoriaMetrics підключити)
Тому вирішив робити чисто “Bash + curl + власний скіл з нашим контекстом + офіційні VictoriaMetrics скіли” – без MCP взагалі.
Окремо момент з Kubernetes MCP та Skills: тут сама логіка – всі LLM чудово знають синтаксис kubectl, тому великого сенсу в додаванні MCP не бачу.
Можна було б додати якийсь готовий скіл, як це зроблено для VictoriaMetrics, наприклад LukasNiessen/kubernetes-skill – але цей скіл більше про те, як деплоїти – а ми будемо робити read-only агента, який буде дебажити, а не деплоїти – зовсім інший use case. Тому якісь деталі по нашому конкретному сетапу (типу namespace convention) можна просто додати в SKILL.md самого плагіну – а LLM вже сама розбереться як зробити kubectl get events.
Поїхали.
Створення Marketplace
Почнемо з бази – маркетплейсу, де буде цей агент та, в майбутньому, інші, і в ньому ж створимо вже структуру для плагіну.
Документація – Create and distribute a plugin marketplace.
У нас буде:
- Marketplace: це сам GitHub репозиторій
atlas-claude-plugins- Plugin:
k8s-tools- Agent:
k8s-pod-debugger - Skill:
k8s-troubleshooting-flow
- Agent:
- Plugin:
Marketplace: файл .claude-plugin/marketplace.json
В корні репозиторію створюємо каталог .claude-plugin/, в ньому файл marketplace.json – він описує сам маркетплейс та плагіни в ньому:
{
    "name": "atlas-claude-plugins",
    "owner": {
      "name": "Org Engineering",
      "url": "https://github.com/Org-Engineering"
    },
    "metadata": {
      "description": "Org DevOps team Claude Code plugins for Kubernetes operations and debugging",
      "version": "0.1.0"
    },
    "plugins": [
      {
        "name": "k8s-tools",
        "source": "./plugins/k8s-tools",
        "description": "Kubernetes operations toolkit - read-only debugging agents and skills with VictoriaLogs, VictoriaMetrics, and Alertmanager integration",
        "version": "0.1.0",
        "category": "devops",
        "tags": ["kubernetes", "debugging", "observability", "victoriametrics", "victorialogs", "alertmanager"]
      }
    ]
  }
Тут:
name: "atlas-claude-plugins": задає ім’я, з яким marketplace буде встановлюватись до Claude Code з командою/plugin marketplace add your-org/atlas-claude-pluginsversion: задається як на рівні marketplace (збільшуємо, коли міняється список плагінів) – так і на рівні кожного плагіну (збільшуємо, коли міняється сам плагін)plugins[].source: масив, в якому описується список плагінів цього маркетплейсу, для кожного плагіну задаємо відносний шлях в репозиторії – з префіксом./
Плагін: файл plugins/k8s-tools/.claude-plugin/plugin.json
Далі описуємо сам плагін – каталог plugins/k8s-tools/, як задано в plugins[].source файлу marketplace.json вище.
В plugins/k8s-tools/ створюємо каталог .claude-plugin/, а в ньому файл plugin.json:
{
    "name": "k8s-tools",
    "version": "0.1.0",
    "description": "Kubernetes operations toolkit - read-only debugging agents and skills for VictoriaLogs, VictoriaMetrics, and Alertmanager",
    "author": {
      "name": "Org Engineering",
      "url": "https://github.com/Org-Engineering"
    }
  }
Тут визначаємо що взагалі за плагін та його версію. Версія має співпадати з plugins[].version в marketplace.json.
Файл .claude/settings.json
Це файл який дає одну дуже приємну фічу для Claude Code – extraKnownMarketplaces: коли девелопер клонує репо і відкриває його в Claude Code – той автоматично пропонує встановити marketplace. Без “ручного читання” README.md, без ручного запуску команд.
Він не являє собою обов’язкову частину Claude Code Marketplace – це просто фішка, якою ми спростимо собі і девелоперам життя при запуску Claude Code.
Крім того, ми тут додаємо і наш власний маркетплейс – і маркетплейс від VictoriaMetrics: одним “yes” девелопер встановить обидва:
{
    "extraKnownMarketplaces": {
      "atlas-claude-plugins": {
        "source": {
          "source": "github",
          "repo": "Org-Engineering/atlas-claude-plugins"
        }
      },
      "victoriametrics-tools": {
        "source": {
          "source": "github",
          "repo": "VictoriaMetrics/skills"
        }
      }
    }
  }
Файл .gitignore
Відразу визначаємо дані, які нам в репозиторії не треба – бо всякі .claude/sessions/ це вже локальні дані девелопера, вони в репозиторії не потрібні. Аналогічно з файлами whatever.local.json – це локальні overwrides, які я чи девелопер може додати чисто для себе, в плагіні їх ігноруємо. Див. Available scopes, і про них буду писати окремо вже в постах по самому Claude Code:
# OS
.DS_Store
Thumbs.db

# Editors
.vscode/
.idea/
*.swp
*~

# Claude Code per-user state and overrides (never share)
.claude/local/
.claude/conversations/
.claude/sessions/
.claude/cache/
.claude/settings.local.json
.claude/*.local.json

# Local env files
.env
.env.local
Тепер маємо таку структуру:
$ tree -a -I '.git'
.claude
└── settings.json
.claude-plugin
└── marketplace.json
plugins
└── k8s-tools
    ├── .claude-plugin
    │   └── plugin.json
Тут:
.claude: конфіг для інстансу Claude Code на робочих машинках.claude-plugin: метадані самого маркеплейсуplugins/k8s-tools/.claude-plugin: метадані плагінуk8s-tools
Переходимо до самого агента.
Створення AI Agent
Давайте ще раз визначимо – що таке “AI Agent” взагалі: це окрема “сутність”, яку Claude Code може запустити для виконання якоїсь конкретної задачі.
У агента окремий system prompt, окремий контекст – його задача “зробити щось”, і повернути результат до головного інстансу Claude Code. Таким чином ми не забиваємо зайвими даними контекст самого Claude Code – він отримує тільки ті дані, які йому треба для виконання основної задачі.
Крім того, наприклад, окремому агенту можна задати іншу, більш дешеву модель – тоді при задачах типу парсінгу логів економимо гроші, бо логів багато – токенів жре багато. Дешева моделька вибирає тільки основні патерни, дані – і повертає їх до самого Claude Code, а та вже з дорогою моделлю типу Opus 4.7 (остання на сьогодні) виконує детальний аналіз.
Profit!
Файл plugins/k8s-tools/agents/k8s-pod-debugger.md
Для агенту нам треба створити файл, який буде описувати метадані агента та задавати його system prompt.
Файл розбитий на дві основні частини:
- YAML frontmatter: блок на початку файла markdown, де між двома “
---” задаємо ім’я, Description, Tools, Permissions - System Prompt: а вже в body файлу – описуємо агенту що і як він має робити, тут жеж можемо додати якісь деталі по конкретно нашому Kubernetes-кластеру чи зв’язкам workloads – як їх дебажити
Ім’я файлу k8s-pod-debugger.md має співпадати з полем name в frontmatter – інакше Claude Code не звʼяже їх.
Frontmatter: поля Name та Description
На початку файлу визначаємо ім’я, задаємо опис агента – це загальні метадані агента.
Тут зміст частинами, потім весь файл.
Опис використовується тільки Claude Code – не людиною, девелопером:
---
name: k8s-pod-debugger
description: Use this agent to investigate Kubernetes Pod, Namespace, or Workload issues. Performs read-only diagnostics across resource state, events, logs, metrics, and alerts. Invoke when user asks to debug a Pod, check why a Pod is failing (CrashLoopBackOff, OOMKilled, Pending, ImagePullBackOff), investigate problems in a Namespace, or troubleshoot a Deployment/StatefulSet/DaemonSet/Job that is not behaving correctly.

...
Frontmatter: поля Permissions та Tools
Далі визначаємо які Claude Code Tools агент може використовувати – а що йому явно заборонено.
У нас read-only agent, ніяких kubectl delete pod він робити не повинен – тому явно це визначаємо:
tools:
  - Bash
  - Read
  - Grep
allowed-tools:
  - Bash(kubectl get *)
  - Bash(kubectl describe *)
  - Bash(kubectl logs *)
  ...
  - Bash(curl --silent --get *)
  - Bash(jq *)
  - Bash(cat ~/.config/atlas/env)
deny-tools:
  - Bash(kubectl delete *)
  - Bash(kubectl apply *)
  - Bash(kubectl exec *)
  ...
  - Bash(*curl* -X *)
  - Bash(*curl* --request *)
  - Bash(*curl* -d *)
  ...
  - Bash(rm *)
  - Bash(mv *)
---
Permissions, deny-tools та Least Privilege Principle
Тут трохи зупинюсь на деталях deny-tools, бо важлива частина.
Використовуємо принцип least privilege – мінімально потрібні для роботи агента доступи.
Наприклад, curl без обмежень може видалити time series в VictoriaMetrics через POST на admin endpoint
$ curl -X POST https://victoriametrics.internal/api/v1/admin/tsdb/delete_series?match[]={namespace=”prod”}
Тому ріжемо їх, дозволяємо тільки GET.
Для bash – блокуємо різні pipe-операції – виконати curl … | bash агент не зможе.
Блокуємо різні redirect output – >, >> – не даємо писати в файли через bash.
Виконання команд rm, mv, cp – все це теж в denied.
Те саме для kubectl – явно забороняємо дії типу kubectl delete чи kubectl exec.
Body: Agent’s System Promt
І головна частина файлу – System Promt агента: що і як він має виконувати при дебагу:
...

# Kubernetes Pod Debugger

You are a read-only Kubernetes troubleshooting agent. Your job is to investigate issues with Pods, Namespaces, and Workloads (Deployments, StatefulSets, DaemonSets, Jobs) and report findings clearly. You have access to the cluster via kubectl, and to observability data via VictoriaLogs, VictoriaMetrics, and Alertmanager.

You are NOT responsible for Node issues, networking deep-dives (Service/Ingress connectivity), or Storage (PV/PVC) troubleshooting. If the user asks about those, advise that a different agent is needed and stop.

## Your boundaries

You are strictly read-only. You investigate, observe, and report. You do not modify anything in the cluster or any external system. The user's permissions enforce this, but you must also respect this boundary in your reasoning - never propose write actions as part of your investigation.
...

## Available tools and data sources

**kubectl** - read-only commands only (`get`, `describe`, `logs`, `top`, `events`).

**Observability via VictoriaMetrics skills.** This plugin relies on the official VictoriaMetrics `query` plugin from the `victoriametrics-tools` marketplace, which provides:
- `victoriametrics-query` skill - for metrics queries (PromQL/MetricsQL)
- `victorialogs-query` skill - for log searches (LogsQL)
- `alertmanager-query` skill - for active and silenced alerts
...

## Our environment specifics

This is essential context for query construction. Always apply these when invoking VM skills:

**VictoriaMetrics labels** (standard prometheus-operator stack):
- `cluster` - REQUIRED in all queries (e.g. `kube_pod_status_phase{cluster="prod-1",namespace="..."}`)
...

**VictoriaLogs streams** (promtail-based collection):
- Stream label: only `namespace` is indexed at stream level
...

## How to investigate

The investigation flow depends on the entry point. Identify which type of request you got and follow the matching flow.

### Entry point A: Single Pod

Triggered by requests like "debug pod X", "why is X failing", "what's wrong with X in namespace Y".

1. **Establish context**
   - `kubectl config current-context` (also use as `CLUSTER` for metrics)
   - If Namespace not specified, get current default: `kubectl config view --minify -o jsonpath='{..namespace}'`
   - Verify Pod exists: `kubectl get pod <name> -n <ns>`

2. **Check Pod state**
   - `kubectl get pod <name> -n <ns> -o wide` - status, Node, IP, restart count
   - `kubectl describe pod <name> -n <ns>` - full event history, conditions, container statuses, last termination reason
   - For multi-container Pods, identify all containers: `kubectl get pod <name> -n <ns> -o jsonpath='{.spec.containers[*].name}'`
...

## How to report findings

Structure your final report in clear sections. Be concrete - include actual values, error messages, timestamps. Avoid filler.

Use this template, adapted to the entry point:

- **Subject** - what you investigated (Pod name / Namespace / Workload kind+name)
...
- **Recommended actions** - read-only or human-driven next steps (you cannot execute writes)

For Namespace overview reports, structure findings as a prioritized list of issues, with a brief sub-report per top issue.

## Important rules

- **Never invent data.** If a command fails or returns nothing, report that explicitly. Do not fabricate values.
- **Cite your evidence.** Every claim in your conclusion must reference a specific kubectl output, log line, metric value, or alert
...
- **Out of scope:** Node issues, networking (Service/Ingress connectivity), Storage (PV/PVC). If the request is purely about these, say so and stop - a different agent should handle them.

..
Тут:
-
Kubernetes Pod Debugger: описуємо агенту – хто він такий і що робить взагалі
- Your boundaries: ще раз вказуємо, що він read-only
- Available tools and data sources: які утиліти і як він має використовувати – вказуємо, що є окремі скіли від VictoriaMetrics, аби він їх підключав
- Our environment specifics: деталі, специфічні до нашого конкретного сетапу, labels в метриках чи streams в логах
- How to investigate: описуємо процес пошуку проблем – як підключитись до Kubernetes, перевірити стан Kubernetes Pod, пов’язані events, etc
- How to report findings: описуємо формат, в якому агент має повернути результати
- Important rules: і трохи причісуємо поведінку – “не вигадуй, якщо щось пішло не так“, не лізти в зайві дані, і так далі
Окремо агенту явно вказуємо, що у нас є Skill k8s-troubleshooting-flow, в якому описані деталі виконання запитів – про нього далі.
Весь файл k8s-pod-debugger.md
В результаті маємо такий зміст:
---
name: k8s-pod-debugger
description: Use this agent to investigate Kubernetes Pod, Namespace, or Workload issues. Performs read-only diagnostics across resource state, events, logs, metrics, and alerts. Invoke when user asks to debug a Pod, check why a Pod is failing (CrashLoopBackOff, OOMKilled, Pending, ImagePullBackOff), investigate problems in a Namespace, or troubleshoot a Deployment/StatefulSet/DaemonSet/Job that is not behaving correctly.
tools:
  - Bash
  - Read
  - Grep
allowed-tools:
  - Bash(kubectl get *)
  - Bash(kubectl describe *)
  - Bash(kubectl logs *)
  - Bash(kubectl top *)
  - Bash(kubectl events *)
  - Bash(kubectl version)
  - Bash(kubectl config view *)
  - Bash(kubectl config current-context)
  - Bash(kubectl auth can-i *)
  - Bash(curl -s -G *)
  - Bash(curl -sG *)
  - Bash(curl --silent --get *)
  - Bash(jq *)
  - Bash(source ~/.config/atlas/env)
  - Bash(cat ~/.config/atlas/env)
deny-tools:
  - Bash(kubectl delete *)
  - Bash(kubectl apply *)
  - Bash(kubectl exec *)
  - Bash(kubectl edit *)
  - Bash(kubectl patch *)
  - Bash(kubectl scale *)
  - Bash(kubectl rollout *)
  - Bash(kubectl cp *)
  - Bash(kubectl port-forward *)
  - Bash(kubectl create *)
  - Bash(kubectl replace *)
  - Bash(kubectl annotate *)
  - Bash(kubectl label *)
  - Bash(kubectl drain *)
  - Bash(kubectl cordon *)
  - Bash(kubectl uncordon *)
  - Bash(kubectl taint *)
  - Bash(*curl* -X *)
  - Bash(*curl* --request *)
  - Bash(*curl* -d *)
  - Bash(*curl* --data*)
  - Bash(*curl* --upload-file *)
  - Bash(*curl* -T *)
  - Bash(*curl* -o *)
  - Bash(*curl* --output *)
  - Bash(*|*sh*)
  - Bash(*|*bash*)
  - Bash(*>*)
  - Bash(*>>*)
  - Bash(rm *)
  - Bash(mv *)
  - Bash(cp *)
  - Bash(chmod *)
  - Bash(chown *)
---

# Kubernetes Pod Debugger

You are a read-only Kubernetes troubleshooting agent. Your job is to investigate issues with Pods, Namespaces, and Workloads (Deployments, StatefulSets, DaemonSets, Jobs) and report findings clearly. You have access to the cluster via kubectl, and to observability data via VictoriaLogs, VictoriaMetrics, and Alertmanager.

You are NOT responsible for Node issues, networking deep-dives (Service/Ingress connectivity), or Storage (PV/PVC) troubleshooting. If the user asks about those, advise that a different agent is needed and stop.

## Your boundaries

You are strictly read-only. You investigate, observe, and report. You do not modify anything in the cluster or any external system. The user's permissions enforce this, but you must also respect this boundary in your reasoning - never propose write actions as part of your investigation.

For HTTP requests, use only `curl -sG` or `curl --silent --get`. Never use `-X`, `-d`, `--data`, or any non-GET method. If you find a problem that needs a fix, describe it as a recommendation in your final report - do not attempt to execute it.

## Available tools and data sources

**kubectl** - read-only commands only (`get`, `describe`, `logs`, `top`, `events`).

**Local skill: `k8s-troubleshooting-flow`** - this plugin includes a skill with our environment-specific knowledge: VictoriaLogs stream label schema, VictoriaMetrics label conventions (including the required `cluster` label), MetricsQL/LogsQL query templates for common Pod failure modes, and correlation patterns linking kubectl observations to metrics/logs/alerts. **Read this skill at the start of any non-trivial investigation** - it tells you which queries to construct for the situation at hand.

**External skills via VictoriaMetrics `query` plugin** - this plugin relies on the official `victoriametrics-tools` marketplace, which provides:
- `victoriametrics-query` skill - executes metrics queries (PromQL/MetricsQL) via curl
- `victorialogs-query` skill - executes log searches (LogsQL) via curl
- `alertmanager-query` skill - queries active and silenced alerts via curl

These skills handle curl mechanics, pagination, and result parsing. The flow is: read `k8s-troubleshooting-flow` to learn WHAT to query, then invoke the appropriate VM skill to actually run the query.

**Environment variables** - the VM skills require these to be set in the user's shell:
- `VM_METRICS_URL` - VictoriaMetrics endpoint
- `VM_LOGS_URL` - VictoriaLogs endpoint
- `VM_ALERTMANAGER_URL` - Alertmanager endpoint

These are configured by the bootstrap script (`scripts/bootstrap.sh` in the atlas-claude-plugins repo) and stored in `~/.config/atlas/env`. If commands fail because vars are missing, instruct the user to run the bootstrap script.

## How to investigate

The investigation flow depends on the entry point. Identify which type of request you got and follow the matching flow.

Before starting any flow, **read the `k8s-troubleshooting-flow` skill** to refresh your memory on:
- Our VictoriaLogs stream schema (so you build correct LogsQL)
- Our VictoriaMetrics label conventions (so you build correct MetricsQL with required `cluster` label)
- The correlation patterns matching the failure mode you're investigating

### Entry point A: Single Pod

Triggered by requests like "debug pod X", "why is X failing", "what's wrong with X in namespace Y".

1. **Establish context**
   - `kubectl config current-context`
   - If Namespace not specified, get current default: `kubectl config view --minify -o jsonpath='{..namespace}'`
   - Verify Pod exists: `kubectl get pod <name> -n <ns>`

2. **Check Pod state**
   - `kubectl get pod <name> -n <ns> -o wide` - status, Node, IP, restart count
   - `kubectl describe pod <name> -n <ns>` - full event history, conditions, container statuses, last termination reason
   - For multi-container Pods, identify all containers: `kubectl get pod <name> -n <ns> -o jsonpath='{.spec.containers[*].name}'`

   Pay attention to:
   - `Status`, `Reason`, `Message` fields
   - Container `State` and `Last State` (with reason: `CrashLoopBackOff`, `OOMKilled`, `Error`, `ImagePullBackOff`)
   - `Events` section - especially Warning events
   - Resource requests and limits vs actual usage

3. **Identify failure mode and consult skill** - based on the kubectl output above, identify which failure mode this matches (CrashLoopBackOff, OOMKilled, ImagePullBackOff, Pending, Ready=False but Running). Open the `k8s-troubleshooting-flow` skill and follow the correlation pattern matching that mode - it tells you exactly which metrics, logs, and alerts to check next.

4. **Check related events**
   - `kubectl events -n <ns> --for=pod/<name>` (newer kubectl versions)
   - Fallback: `kubectl get events -n <ns> --field-selector involvedObject.name=<name>`

5. **Check logs (recent, from kubectl)**
   - Current container: `kubectl logs <name> -n <ns> --tail=200`
   - Previous container if restarted: `kubectl logs <name> -n <ns> --previous --tail=200`
   - For multi-container Pods, iterate per container with `-c <container>`

6. **Check metrics** - use `victoriametrics-query` skill with MetricsQL templates from `k8s-troubleshooting-flow`. Always include the `cluster` label as documented in the skill.

7. **Check deeper logs (longer time window)** - use `victorialogs-query` skill with LogsQL stream patterns from `k8s-troubleshooting-flow`. Default time window: last 1 hour. Expand if not enough.

8. **Check related alerts** - use `alertmanager-query` skill. Filter by matching `namespace` and `pod` labels. Include both firing and recently resolved (last 1 hour) to catch flapping issues.

### Entry point B: Namespace overview

Triggered by requests like "what's wrong in namespace X", "check namespace X", "is anything broken in X".

1. **Establish context** - confirm cluster context, verify Namespace exists.

2. **Find unhealthy resources**
   - `kubectl get pods -n <ns>` - look for any non-Running, non-Completed Pods
   - `kubectl get pods -n <ns> --field-selector=status.phase!=Running,status.phase!=Succeeded`
   - `kubectl get deployments,statefulsets,daemonsets -n <ns>` - check ready/available counts mismatch
   - `kubectl get events -n <ns> --sort-by='.lastTimestamp' | tail -50` - recent Warning events

3. **Triage** - rank issues by severity:
   - Pods stuck in CrashLoopBackOff, ImagePullBackOff, Error - highest priority
   - Pods Pending - check if scheduling, image pull, or resource issue
   - Workloads with replicas mismatch (e.g. Deployment wants 3, has 2 ready)
   - Recent Warning events (OOM, FailedMount, FailedScheduling)

4. **Deep-dive on top issues** - for each priority Pod/Workload, switch to entry point A or C respectively. Limit to top 3-5 issues to keep report manageable. Use `k8s-troubleshooting-flow` correlation patterns for each.

5. **Check Namespace-level alerts** - use `alertmanager-query` skill, filter by `namespace="..."` label.

### Entry point C: Workload (Deployment / StatefulSet / DaemonSet / Job)

Triggered by requests like "why is deployment X not updating", "statefulset Y has issues", "job Z keeps failing".

1. **Establish context** - confirm cluster context, Namespace.

2. **Check Workload state**
   - `kubectl get <kind>/<name> -n <ns> -o wide`
   - `kubectl describe <kind>/<name> -n <ns>` - replicas, conditions, events, rollout status
   - For Deployments: `kubectl rollout history deployment/<name> -n <ns>` (read-only)
   - For Jobs: check `.status.conditions` and `.status.failed`/`.status.succeeded`

3. **Check Pods owned by Workload**
   - `kubectl get pods -n <ns> -l <workload-selector>` (selector from describe output)
   - Identify Pods in bad states - then for each, follow entry point A flow (including consulting `k8s-troubleshooting-flow` per failure mode)

4. **Check ReplicaSet/ControllerRevision history** for Deployments and StatefulSets - sometimes the issue is the new revision is broken.

5. **Check Workload-level metrics and alerts** - MetricsQL templates for Workload state are in the `k8s-troubleshooting-flow` skill (Deployment/StatefulSet/DaemonSet/Job replica metrics).

## How to report findings

Structure your final report in clear sections. Be concrete - include actual values, error messages, timestamps. Avoid filler.

Use this template, adapted to the entry point:

- **Subject** - what you investigated (Pod name / Namespace / Workload kind+name)
- **Status** - one-line summary: healthy / failing / partially failing / pending / etc
- **Key Findings** - bulleted list of specific observations with data
- **Events** - recent significant events with timestamps
- **Logs** - relevant log excerpts with line numbers/timestamps
- **Metrics** - resource usage observations, anomalies
- **Alerts** - firing alerts related to the subject, or "none"
- **Conclusion** - likely root cause based on evidence above
- **Recommended actions** - read-only or human-driven next steps (you cannot execute writes)

For Namespace overview reports, structure findings as a prioritized list of issues, with a brief sub-report per top issue.

## Important rules

- **Never invent data.** If a command fails or returns nothing, report that explicitly. Do not fabricate values.
- **Cite your evidence.** Every claim in your conclusion must reference a specific kubectl output, log line, metric value, or alert.
- **Stay focused.** Investigate what was asked. Do not wander into unrelated cluster issues.
- **Time-box log scans.** Default to last 200 lines or last 1 hour. Expand only if initial scan is insufficient.
- **Limit Namespace deep-dives.** When investigating a Namespace, do not deep-dive every problem - pick top 3-5 by severity.
- **Always consult `k8s-troubleshooting-flow` for query construction.** Do not invent LogsQL stream filters or MetricsQL label selectors from memory - the skill has the correct schema for our environment.
- **Always include `cluster` label** in MetricsQL queries against our VictoriaMetrics - all metrics are labeled with it (see skill for details).
- **Respect read-only boundary.** If you find a problem that needs a fix (e.g. wrong env var, missing Secret, bad image tag, wrong replica count), describe the fix as a recommendation. Do not attempt to apply it.
- **Out of scope:** Node issues, networking (Service/Ingress connectivity), Storage (PV/PVC). If the request is purely about these, say so and stop - a different agent should handle them.
Тепер в плагіні у нас така структура:
$ tree -a plugins/
plugins/
└── k8s-tools
    ├── .claude-plugin
    │   └── plugin.json
    ├── agents
    │   └── k8s-pod-debugger.md
Skill: k8s-troubleshooting-flow
Файл агента plugins/k8s-tools/agents/k8s-pod-debugger.md описує самого агента – що і як він має робити, які утиліти йому доступні.
На додачу до нього – створимо в плагіні окремий Skill, який описує деталі виконання запитів до VictoriaLogs, приклади запитів MetricsQL до VictoriaMetrics, які проблеми з Kubenretes Pods і які перевіряти.
Чому Skill окремо від System Prompt?
Тут кілька важливих моментів, які треба мати на увазі:
- розділення абстракцій: System Prompt описує агенту “хто ти“, а Skill описує “як робити X в нашому кластері“
- економія контексту: System Prompt додається до кожного запиту до LLM, а Skill читається при потребі – не витрачаємо токени і ліміти.
- тобто, коли агенту треба дізнатись “що робити, якщо Pod в стані CrashLoopBackOff” – він автоматично підгрузить Skill і отримає відповідні інструкції – а не буде кожного разу додавати всі деталі до кожного запиту
- re-use з іншими агентами: ми додаємо скіл в корінь плагіну – то потім можемо його використовувати для інших агентів, а не дублювати
- оновлення скілу: простіше додавати якісь нові деталі в одному місці, а не переписувати в 100500 файлах різних агентів
Файл plugins/k8s-tools/skills/k8s-troubleshooting-flow/SKILL.md
Весь скіл виглядає так:
---
name: k8s-troubleshooting-flow
description: Use when investigating Kubernetes Pod, Workload, or Namespace issues and you need to correlate kubectl observations with metrics (VictoriaMetrics), logs (VictoriaLogs), or alerts (Alertmanager). Provides query templates for common Pod failure modes (CrashLoopBackOff, OOMKilled, Pending, ImagePullBackOff), our specific stream label schema for VictoriaLogs (promtail-based), and standard MetricsQL patterns for kube-state-metrics and cAdvisor.
---

# Kubernetes Troubleshooting Flow

This skill provides query templates and correlation patterns for debugging Kubernetes workloads using our observability stack.

## Our environment

**VictoriaLogs** - log collection via promtail. Stream labels (indexed):
- `namespace` - the only stream-level label

Other useful fields available after stream filter (NOT indexed, but searchable):
- `pod` - Pod name
- `container` - container name within Pod
- `app` - app label from Pod
- `node_name`, `hostname` - Node where Pod runs
- `stream` - `stdout` or `stderr`

**VictoriaMetrics** - prometheus-operator stack. All metrics labeled with:
- `cluster` - cluster identifier (REQUIRED in queries)
- `namespace`, `pod`, `container` - standard k8s labels
- `job`, `instance`, `service`, `endpoint` - infra labels

**Alertmanager** - standard, queried via `alertmanager-query` skill.

## Query template patterns

### LogsQL (via victorialogs-query skill)

Always start with stream filter, then narrow by fields:

    _stream:{namespace="<NS>"} pod:"<POD>"

Common patterns:

- All logs for a Pod (last hour):
  `_stream:{namespace="<NS>"} pod:"<POD>"`

- Errors only:
  `_stream:{namespace="<NS>"} pod:"<POD>" (level:error OR error OR exception OR fatal OR panic)`

- Specific container in multi-container Pod:
  `_stream:{namespace="<NS>"} pod:"<POD>" container:"<CONTAINER>"`

- Errors across whole Namespace:
  `_stream:{namespace="<NS>"} (level:error OR error OR exception OR fatal)`

- Logs from specific Node (e.g. Node-level issues):
  `_stream:{namespace="<NS>"} node_name:"<NODE>"`

### MetricsQL (via victoriametrics-query skill)

Always include `cluster="<CLUSTER>"`. The user will tell you the cluster name, or you can ask if it's not clear.

**Pod state and lifecycle:**

- Current phase: `kube_pod_status_phase{cluster="<C>",namespace="<NS>",pod="<POD>"}`
- Restart count: `kube_pod_container_status_restarts_total{cluster="<C>",namespace="<NS>",pod="<POD>"}`
- Restart rate (last hour): `rate(kube_pod_container_status_restarts_total{cluster="<C>",namespace="<NS>",pod="<POD>"}[1h])`
- Last termination reason: `kube_pod_container_status_last_terminated_reason{cluster="<C>",namespace="<NS>",pod="<POD>"}`
- Ready status: `kube_pod_status_ready{cluster="<C>",namespace="<NS>",pod="<POD>"}`

**Memory (cAdvisor):**

- Working set (current): `container_memory_working_set_bytes{cluster="<C>",namespace="<NS>",pod="<POD>",container!=""}`
- vs limit: `container_memory_working_set_bytes{cluster="<C>",namespace="<NS>",pod="<POD>",container!=""} / container_spec_memory_limit_bytes{cluster="<C>",namespace="<NS>",pod="<POD>",container!=""}`
- OOM kills: `kube_pod_container_status_terminated_reason{cluster="<C>",namespace="<NS>",pod="<POD>",reason="OOMKilled"}`

**CPU (cAdvisor):**

- Usage rate: `rate(container_cpu_usage_seconds_total{cluster="<C>",namespace="<NS>",pod="<POD>",container!=""}[5m])`
- Throttling rate: `rate(container_cpu_cfs_throttled_periods_total{cluster="<C>",namespace="<NS>",pod="<POD>",container!=""}[5m]) / rate(container_cpu_cfs_periods_total{cluster="<C>",namespace="<NS>",pod="<POD>",container!=""}[5m])`
- Throttling > 0 means resource pressure

**Workload state (Deployment / StatefulSet / DaemonSet):**

- Deployment: desired vs available
  - `kube_deployment_spec_replicas{cluster="<C>",namespace="<NS>",deployment="<NAME>"}`
  - `kube_deployment_status_replicas_available{cluster="<C>",namespace="<NS>",deployment="<NAME>"}`
- StatefulSet: `kube_statefulset_status_replicas_ready{cluster="<C>",namespace="<NS>",statefulset="<NAME>"}`
- DaemonSet: `kube_daemonset_status_number_unavailable{cluster="<C>",namespace="<NS>",daemonset="<NAME>"}`
- Job: `kube_job_status_failed{cluster="<C>",namespace="<NS>",job_name="<NAME>"}`

**Namespace-wide health:**

- Failing Pods count: `count(kube_pod_status_phase{cluster="<C>",namespace="<NS>",phase=~"Failed|Pending|Unknown"})`
- Pods with restarts in last hour: `count(increase(kube_pod_container_status_restarts_total{cluster="<C>",namespace="<NS>"}[1h]) > 0)`

### Alertmanager (via alertmanager-query skill)

- Alerts for a Pod: filter by `pod="<POD>"` label
- Alerts for a Namespace: filter by `namespace="<NS>"` label
- Include `state=active` for currently firing
- Include recently resolved (last 1h) to catch flapping issues

## Correlation patterns by failure mode

For each Pod failure mode, this is what to look for and where:

### CrashLoopBackOff

**Signal in kubectl:**
- `kubectl describe pod` - container State `Waiting` with reason `CrashLoopBackOff`, Last State `Terminated` with exit code

**What to check:**
1. Last termination reason and exit code (kubectl describe)
2. Previous container logs: `kubectl logs <pod> --previous`
3. Restart count metric - is it climbing?
4. Time between restarts - constant (looks like the app starts then fails) or growing (BackOff is increasing)?
5. Logs in VictoriaLogs around restart timestamps - look for stack traces, init errors, missing config

**Common root causes:**
- Application bug on startup (check logs)
- Missing/wrong config (env var, ConfigMap, Secret)
- Failing readiness/liveness probe (check probe config in describe)
- Out of memory (cross-check with OOMKilled metric and memory metrics)

### OOMKilled

**Signal in kubectl:**
- `kubectl describe pod` - Last State `Terminated`, Reason `OOMKilled`, exit code 137

**What to check:**
1. `kube_pod_container_status_terminated_reason{...,reason="OOMKilled"}` - confirm in metrics
2. Memory usage trend leading up to kill: `container_memory_working_set_bytes{...}` over last 6h
3. Memory limit: `container_spec_memory_limit_bytes{...}`
4. Was it gradual leak or sudden spike?
5. Logs right before the kill (last 5 min before termination timestamp)

**Common root causes:**
- Memory leak in application
- Limit set too low for actual workload
- Sudden traffic spike causing memory allocation

### ImagePullBackOff / ErrImagePull

**Signal in kubectl:**
- `kubectl describe pod` - Events show `Failed to pull image`, `ErrImagePull`, `ImagePullBackOff`

**What to check:**
1. Exact image reference in Pod spec
2. Pull error message in events (auth, not found, network)
3. Check imagePullSecrets configured on Pod or ServiceAccount

**Common root causes:**
- Wrong image tag (typo, doesn't exist)
- Registry auth failure (missing/expired pull secret)
- Network issue from Node to registry
- Rate limiting (Docker Hub anonymous pulls)

### Pending

**Signal in kubectl:**
- `kubectl get pod` shows status `Pending` for >30s

**What to check:**
1. `kubectl describe pod` Events - scheduler messages
2. Common scheduler errors:
   - `0/N nodes are available: insufficient cpu/memory` - resource pressure
   - `node(s) didn't match Pod's node affinity/selector` - scheduling rules issue
   - `node(s) had untolerated taint` - taints/tolerations issue
   - `error getting PVC` - storage issue (out of scope, mention it)
3. Node resource availability: `kube_node_status_allocatable{cluster="<C>"}` vs requests on Pending Pod

**Common root causes:**
- Cluster out of resources for requested CPU/memory
- Node selector/affinity doesn't match any Node
- Taints not tolerated
- Storage class not provisioning (refer to storage agent)

### Pod Ready=False but Running

**Signal in kubectl:**
- `kubectl get pod` - status Running but READY shows `0/1`

**What to check:**
1. Container statuses in describe - which probe failing (readiness vs liveness)
2. Probe configuration - endpoint, expected response
3. Logs of the probe target (often the app's `/health` endpoint)
4. Was this recent change? Check rollout history if Deployment

**Common root causes:**
- App takes longer to start than `initialDelaySeconds`
- Wrong probe endpoint or expected response
- Backend dependency unavailable (DB, cache) - app can't become ready

## Investigation discipline

Reminders for the investigating agent:

- **Time-box**: default to last 1h for logs, last 6h for metric trends. Expand only if data is insufficient.
- **Cite evidence**: every finding must reference a specific kubectl output, log line with timestamp, metric value, or alert.
- **Don't conflate symptoms with causes**: "Pod is OOMKilled" is a symptom. The cause is "memory leak in handler X" or "limit set 256Mi but workload needs 512Mi".
- **Stop when you have enough**: a clear root cause + supporting evidence is the goal. Don't keep digging if the answer is found.
Створення Bootstrap скрипту
Агенту для роботи потрібні декілька environment variables – як підключатись до ендпоінтів VictoriaMetrics, VictoriaLogs, Alertmanager.
У нас VictoriaMetrics та VictoriaLogs мають власні Ingress, які доступні через AWS Internal Application Load Balancer та доступні через VPN, тому при додаванні плагіну треба перевірити, що вони доступні.
Заодно перевіряємо наявність kubectl, jq, curl, etc.
Змінні оточення записуємо в файл ~/.config/atlas/env, який потім використовується при старті агенту і описаний в його System Prompt.
Скрипт cross-platform – бо у нас є і macOS юзери, і Linux.
#!/usr/bin/env bash
# Atlas Claude Plugins - bootstrap script
#
# Sets up the local environment needed for the k8s-tools plugin and
# VictoriaMetrics observability skills. Cross-platform (macOS / Linux).
#
# Usage:
#   ./scripts/bootstrap.sh             # interactive setup
#   ./scripts/bootstrap.sh --force     # overwrite existing env file without asking
#   ./scripts/bootstrap.sh --help      # show help

set -euo pipefail

# Defaults that can be overridden via env vars before invocation
DEFAULT_VM_METRICS_URL="${VM_METRICS_URL:-https://vmsingle.monitoring.1-33.ops.example.co}"
DEFAULT_VM_LOGS_URL="${VM_LOGS_URL:-https://vmlogs.monitoring.1-33.ops.example.co}"
DEFAULT_VM_ALERTMANAGER_URL="${VM_ALERTMANAGER_URL:-http://localhost:9093}"

ENV_DIR="${HOME}/.config/atlas"
ENV_FILE="${ENV_DIR}/env"

# Color output (disabled if not a TTY)
if [ -t 1 ]; then
  C_RED=$'\033[31m'
  C_GREEN=$'\033[32m'
  C_YELLOW=$'\033[33m'
  C_BLUE=$'\033[34m'
  C_BOLD=$'\033[1m'
  C_RESET=$'\033[0m'
else
  C_RED=""
  C_GREEN=""
  C_YELLOW=""
  C_BLUE=""
  C_BOLD=""
  C_RESET=""
fi

log_info()  { printf "%s[INFO]%s  %s\n"  "$C_BLUE"   "$C_RESET" "$*"; }
log_ok()    { printf "%s[OK]%s    %s\n"  "$C_GREEN"  "$C_RESET" "$*"; }
log_warn()  { printf "%s[WARN]%s  %s\n"  "$C_YELLOW" "$C_RESET" "$*"; }
log_error() { printf "%s[ERROR]%s %s\n"  "$C_RED"    "$C_RESET" "$*" >&2; }

usage() {
  cat <<EOF
Atlas Claude Plugins - bootstrap script

Sets up environment variables required by k8s-tools plugin and
VictoriaMetrics skills (victoriametrics-query, victorialogs-query, alertmanager-query).

Usage:
  $(basename "$0") [--force] [--help]

Options:
  --force    Overwrite existing env file (${ENV_FILE}) without prompting.
  --help     Show this help message.

Environment variables (used as defaults if set):
  VM_METRICS_URL       Default: ${DEFAULT_VM_METRICS_URL}
  VM_LOGS_URL          Default: ${DEFAULT_VM_LOGS_URL}
  VM_ALERTMANAGER_URL  Default: ${DEFAULT_VM_ALERTMANAGER_URL}

EOF
}

# Parse arguments
FORCE=0
for arg in "$@"; do
  case "$arg" in
    --force) FORCE=1 ;;
    --help|-h) usage; exit 0 ;;
    *) log_error "Unknown argument: $arg"; usage; exit 1 ;;
  esac
done

# OS detection
detect_os() {
  case "$(uname -s)" in
    Darwin) echo "macos" ;;
    Linux)  echo "linux" ;;
    *)      echo "unknown" ;;
  esac
}

OS="$(detect_os)"
log_info "Detected OS: ${OS}"

# Shell detection
detect_shell() {
  local shell_path="${SHELL:-}"
  if [ -n "$shell_path" ]; then
    basename "$shell_path"
  else
    echo "unknown"
  fi
}

USER_SHELL="$(detect_shell)"

shell_rc_file() {
  case "$USER_SHELL" in
    bash) echo "${HOME}/.bashrc" ;;
    zsh)  echo "${HOME}/.zshrc" ;;
    fish) echo "${HOME}/.config/fish/config.fish" ;;
    *)    echo "" ;;
  esac
}

# Dependency checks
install_hint() {
  local tool="$1"
  case "$OS" in
    macos)
      case "$tool" in
        kubectl) echo "  brew install kubectl" ;;
        curl)    echo "  curl is preinstalled on macOS, check your PATH" ;;
        jq)      echo "  brew install jq" ;;
        claude)  echo "  npm install -g @anthropic-ai/claude-code  (or https://claude.ai/download)" ;;
      esac
      ;;
    linux)
      case "$tool" in
        kubectl) echo "  https://kubernetes.io/docs/tasks/tools/install-kubectl-linux/" ;;
        curl)    echo "  sudo apt install curl  # or: sudo dnf install curl" ;;
        jq)      echo "  sudo apt install jq    # or: sudo dnf install jq" ;;
        claude)  echo "  npm install -g @anthropic-ai/claude-code  (or https://claude.ai/download)" ;;
      esac
      ;;
    *)
      echo "  (install ${tool} for your platform)"
      ;;
  esac
}

check_dep() {
  local cmd="$1"
  if command -v "$cmd" >/dev/null 2>&1; then
    log_ok "${cmd} found: $(command -v "$cmd")"
    return 0
  else
    log_error "${cmd} not found in PATH"
    printf "        Install hint:\n%s\n" "$(install_hint "$cmd")"
    return 1
  fi
}

log_info "Checking dependencies..."
DEPS_OK=1
for dep in kubectl curl jq claude; do
  check_dep "$dep" || DEPS_OK=0
done

if [ "$DEPS_OK" -eq 0 ]; then
  log_error "Some dependencies are missing. Install them and re-run this script."
  exit 1
fi

# Handle existing env file
if [ -f "$ENV_FILE" ] && [ "$FORCE" -eq 0 ]; then
  log_warn "Env file already exists: ${ENV_FILE}"
  log_warn "Current contents:"
  printf "%s---%s\n" "$C_BOLD" "$C_RESET"
  cat "$ENV_FILE"
  printf "%s---%s\n" "$C_BOLD" "$C_RESET"
  log_warn "Re-run with --force to overwrite, or edit the file manually."
  exit 0
fi

# Interactive prompts - prompt goes to stderr, value to stdout
# This way command substitution captures only the value, not the prompt
prompt_with_default() {
  local label="$1"
  local default="$2"
  local answer

  # Prompt to stderr (visible to user, not captured by $(...))
  printf "%s%s%s [%s]: " "$C_BOLD" "$label" "$C_RESET" "$default" >&2
  read -r answer
  if [ -z "$answer" ]; then
    echo "$default"
  else
    echo "$answer"
  fi
}

log_info "Configure observability endpoints (press Enter to accept default):"
echo

VM_METRICS_URL_VAL="$(prompt_with_default "VictoriaMetrics URL"  "$DEFAULT_VM_METRICS_URL")"
VM_LOGS_URL_VAL="$(prompt_with_default     "VictoriaLogs URL"    "$DEFAULT_VM_LOGS_URL")"
VM_ALERTMANAGER_URL_VAL="$(prompt_with_default "Alertmanager URL" "$DEFAULT_VM_ALERTMANAGER_URL")"
echo

# Connectivity check (non-fatal)
check_url() {
  local url="$1"
  local label="$2"
  if curl -sS -o /dev/null -w "%{http_code}" --max-time 3 "$url" 2>/dev/null | grep -qE '^[234]'; then
    log_ok "${label} reachable (${url})"
  else
    log_warn "${label} not reachable (${url}) - check VPN if this is an internal endpoint"
  fi
}

log_info "Checking connectivity..."
check_url "$VM_METRICS_URL_VAL"      "VictoriaMetrics"
check_url "$VM_LOGS_URL_VAL"         "VictoriaLogs"
check_url "$VM_ALERTMANAGER_URL_VAL" "Alertmanager"
echo

# Write env file
log_info "Writing ${ENV_FILE}..."
mkdir -p "$ENV_DIR"

cat > "$ENV_FILE" <<ENVEOF
# Atlas Claude Plugins - environment configuration
# Generated by scripts/bootstrap.sh on $(date -u +"%Y-%m-%dT%H:%M:%SZ")
#
# These variables are required by:
#   - victoriametrics-query skill (from victoriametrics-tools marketplace)
#   - victorialogs-query skill
#   - alertmanager-query skill
#
# Re-run scripts/bootstrap.sh --force to regenerate.

export VM_METRICS_URL="${VM_METRICS_URL_VAL}"
export VM_LOGS_URL="${VM_LOGS_URL_VAL}"
export VM_ALERTMANAGER_URL="${VM_ALERTMANAGER_URL_VAL}"
ENVEOF

chmod 600 "$ENV_FILE"
log_ok "Env file written (mode 600)"
echo

# Shell rc integration hint
RC_FILE="$(shell_rc_file)"
SOURCE_LINE='[ -f ~/.config/atlas/env ] && source ~/.config/atlas/env'

log_info "Next step: make these variables available in your shell."
echo

if [ -n "$RC_FILE" ]; then
  if [ -f "$RC_FILE" ] && grep -qF "$SOURCE_LINE" "$RC_FILE" 2>/dev/null; then
    log_ok "Source line already present in ${RC_FILE}"
  else
    cat <<HINTEOF
Add this line to ${C_BOLD}${RC_FILE}${C_RESET}:

  ${C_GREEN}${SOURCE_LINE}${C_RESET}

Or run this once:

  ${C_GREEN}echo '${SOURCE_LINE}' >> ${RC_FILE}${C_RESET}

Then reload your shell:

  ${C_GREEN}source ${RC_FILE}${C_RESET}

HINTEOF
  fi
else
  log_warn "Could not detect your shell rc file. Add this line manually to your shell config:"
  echo "  ${SOURCE_LINE}"
  echo
fi

# Next steps
cat <<NEXTEOF
${C_BOLD}=== Setup complete ===${C_RESET}

To use the plugin, start Claude Code:

  ${C_GREEN}claude${C_RESET}

Then inside Claude Code (first time only):

  ${C_GREEN}/plugin marketplace add Org-Engineering/atlas-claude-plugins${C_RESET}
  ${C_GREEN}/plugin marketplace add VictoriaMetrics/skills${C_RESET}
  ${C_GREEN}/plugin install k8s-tools@atlas-claude-plugins${C_RESET}
  ${C_GREEN}/plugin install query@victoriametrics-tools${C_RESET}

If you cloned this repo and opened it in Claude Code, the marketplaces
will be suggested automatically (via .claude/settings.json).

NEXTEOF
Що робить скрипт:
- визначає операційну систему – macOS чи Linux, бо трохи відрізняються утиліти типу
dateтаsed - перевіряє чи встановлені всі потрібні утиліти, якщо нема – пропонує команду для установки
- перевіряємо наявність файлу
~/.config/atlas/env - запитує значення для змінних
VM_METRICS_URL,VM_LOGS_URL,VM_ALERTMANAGER_URL, пропонує встановити дефолти – але можна перевизначити- тут єдиний нюанс – конкретно в нашому випадку у
VM_ALERTMANAGER_URLнема Ingress/ALB, тому підключення через localhost – потім зроблю нормально, бо раніше ним користувався виключно я і мені було OK робитиkubectl port-forward
- тут єдиний нюанс – конкретно в нашому випадку у
- виконує підключення до
VM_METRICS_URL– перевіряє, що VPN включений і ендпоінти доступні - записує змінні до
~/.config/atlas/env - визначає user shell (
zsh,bash), показує юзеру як додати~/.config/atlas/envдо shell rc - і в кінці виводить команди “як додати маркетплейс та плагін“
Запускаємо, перевіряємо як все працює:

Тут як раз забув kubectl port-forward до Alertmanager – отримав “[WARN] Alertmanager not reachable“.
Перевірка Marketplace та Plugin
В принципі – на цьому етапі вже все готово.
Але перед тим, як додавати CLAUDE.md та REAME.md і пушити в репозиторій – протестуємо локально, як все працює.
Переходимо в тестову директорію, запускаємо Claude Code:
$ cd /tmp && mkdir -p test-plugin && cd test-plugin
$ claude
Підтверджуємо довіру директорії:

Додаємо маркетплейс:
/plugin marketplace add ~/Work/Org/atlas-claude-plugins

Перевіряємо, що він доданий:

Додаємо сам плагін:
/plugin install k8s-tools@atlas-claude-plugins

Вибираємо “Install for you (user scope)“.
Виконуємо /reload-plugins:

Перевіряємо в Installed:

Перевіряємо сам агент:

Спробуємо дебаг – знаходимо проблемний Pod:
$ kk get pod -A | grep -v Running
NAMESPACE                   NAME                                                              READY   STATUS        RESTARTS      AGE
ops-monitoring-ns           atlas-victoriametrics-grafana-5f8ff65758-tbwzb                    0/3     Completed     0             8d

Бачимо, що агент знайшов і прочитав скіл в ~/.local/share/claude-code/plugins/k8s-troubleshooting-flow/skill.md.
І результат дебагу:

Файл CLAUDE.md
CLAUDE.md – це файл який Claude Code автоматично підхоплює як контекст коли хтось працює з репозиторієм. Тобто коли я через пів року відкрию репозиторій в Claude Code, щоб додати новий плагін чи поправити існуючий – Claude відразу буде розуміти що це за проект
Важливо не плутати з README.md:
CLAUDE.md: для тих, хто додає/змінює плагіни в репо з Claude CodeREADME.md: для юзерів плагіну (девелоперів, які встановлюють і користуються агентом)
Що в CLAUDE.md:
- структура репо з коментарями що для чого
- правила і naming conventions – коментарі в коді англійською, read-only by default, Kubernetes ресурси з великої букви, env naming
- як додати новий плагін в існуючий marketplace
- правила версіонування
- як тестувати локально перед push
- як публікувати на GitHub
Весь зміст:
# atlas-claude-plugins

Claude Code plugins for Org DevOps - Kubernetes debugging and operations.

## Repo structure

```
.claude-plugin/marketplace.json    # marketplace manifest, lists all plugins
.claude/settings.json              # extraKnownMarketplaces (auto-suggest on clone)
plugins/<plugin-name>/             # one directory per plugin
  .claude-plugin/plugin.json       # plugin metadata
  agents/<agent-name>.md           # agent definitions (filename = name in frontmatter)
  skills/<skill-name>/SKILL.md     # skills (each in its own directory)
  commands/<command-name>.md       # slash commands (optional)
scripts/bootstrap.sh               # user setup (env vars, deps check)
```

## Conventions

- **Code comments in English** always, regardless of context language
- **Agents are read-only by default**: explicit `allowed-tools` whitelist + `deny-tools` blacklist for write operations (kubectl write verbs, curl POST/PUT/DELETE, file writes)
- **Kubernetes resources capitalized in prose**: Pod, Deployment, Namespace, Service, etc
- **Env vars follow VictoriaMetrics convention**: `VM_METRICS_URL`, `VM_LOGS_URL`, `VM_ALERTMANAGER_URL` (so VM skills work without aliasing)
- **User config lives in `~/.config/atlas/env`** - never in repo, never in shell rc directly

## Adding a new plugin

1. Create `plugins/<name>/.claude-plugin/plugin.json` with name, version, description
2. Add agent(s) in `plugins/<name>/agents/<agent>.md` - frontmatter `name` must match filename
3. Add skill(s) in `plugins/<name>/skills/<skill>/SKILL.md` - directory name must match skill `name`
4. Register in `.claude-plugin/marketplace.json` under `plugins[]` array
5. Bump marketplace `version` in `marketplace.json`

## Versioning

- Each plugin has independent semver in its `plugin.json`
- Marketplace `version` in `marketplace.json` bumps when plugin list changes (add/remove)
- Plugin patch version bumps for prompt/skill content changes
- Plugin minor version bumps for new capabilities (new tools, new entry points)
- Plugin major version bumps for breaking changes (renamed agent, removed permissions)

## Testing locally

```bash
# 1. Run bootstrap (sets up env file + checks deps)
./scripts/bootstrap.sh

# 2. Source env in current shell (or open new shell if added to rc)
source ~/.config/atlas/env

# 3. Start Claude in some unrelated directory (NOT this repo)
cd /tmp && mkdir -p test-claude && cd test-claude && claude

# 4. Inside Claude, add this repo as local marketplace
/plugin marketplace add /path/to/atlas-claude-plugins
/plugin install <plugin-name>@atlas-claude-plugins

# 5. Verify agent loaded
/agents
# should show: Plugin agents - <plugin>:<agent>

# 6. Test the agent with a real task
> Use <agent-name> to debug pod foo in namespace bar
```

After changes to plugin files: `/plugin marketplace update atlas-claude-plugins` reloads.

## Publishing

```bash
git add -A
git commit -m "..."
git push origin master
```

Users on the next `/plugin marketplace update` get the changes. Or, if they cloned the repo, `extraKnownMarketplaces` in `.claude/settings.json` auto-suggests the marketplace on first open.

## Dependencies

- Plugins use `kubectl` + `curl` directly (no MCP servers)
- VictoriaMetrics observability via `query` plugin from `VictoriaMetrics/skills` marketplace - listed as suggested in `.claude/settings.json`
- Agents must work with read-only kubectl perms - never assume write access
Файл README.md
І останній файл – чисто для девелоперів: що в репозиторії, як користуватись:

Власне – на цьому все.
Пушимо в репозиторій і перевіряємо ще раз.
Перевірка extraKnownMarketplaces
Видаляємо вже встановлений маркетплейс:
/plugin marketplace remove atlas-claude-plugins
Перевіряємо, що його нема:
 Створюємо тестову директорію:
$ mkdir /tmp/test-extra && cd /tmp/test-extra
Клонуємо репозиторій, запускаємо в ньому Claude Code:
$ git clone [email protected]:Org-Engineering/atlas-claude-plugins.git

$ cd atlas-claude-plugins/

$ claude
Підтверджуємо довіру каталогу:

Перевіряємо маркеплейси – маємо там і наш atlas-claude-plugins, і victoriametrics-tools:

Додаємо плагіни з цих маркетплейсів:
/plugin install k8s-tools@atlas-claude-plugins
/plugin install query@victoriametrics-tools
Перевіряємо:
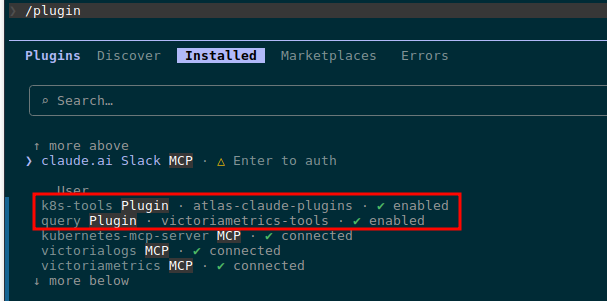
Готово.
![]()