I have already mentioned the EXPLAIN feature in the PostgreSQL: AWS RDS Performance and monitoring blog post, but this is such an interesting and useful thing that it’s worth talking about it separately.
In addition, AWS RDS for PostgreSQL has the ability to enable Execution Plans logging with EXPLAIN, which is also useful for monitoring and debugging, so let’s see how to enable it and what parameters are available for this.
Contents
PostgreSQL EXPLAIN
So what is EXPLAIN? See also Using EXPLAIN.
Explain will show us an Execution Plan. To better understand what the Execution Plan is, let’s take a look at what the query execution process looks like.
What is an Execution Plan in PostgreSQL
When we send a query to PostgreSQL, then:
- the request goes through lexical (Lexing) and syntax (Parsing) analysis
- Lexing: division into tokens (operators) –
SELECT,FROM,WHERE, etc. - Parsing: checking the syntax and creating a Parse Tree
- Lexing: division into tokens (operators) –
- then analysis is performed (Analysis/Binding)
- checking the existence of tables, columns and functions, permissions
- create a schema information – meta-data about the structure of tables, indexes, privileges, etc.
- create a logical plan (Logical Plan Generation)
- based on the parsing tree (Parse Tree), a logical query plan is formed, which defines the operations to be performed –
JOIN,AGREGATE, etc.
- based on the parsing tree (Parse Tree), a logical query plan is formed, which defines the operations to be performed –
- query optimization is performed (Query Optimization)
- determine the best
JOINalgorithms (Nested Loop,Hash Join,Merge Join) - decide whether to use indexes (
Index Scan,Bitmap Index Scan), or a full table view (Seq Scan)
- determine the best
- a physical plan is generated (Execution Plan Generation)
- the Logical Plan is transformed into a specific set of operations to be performed (
Seq Scan,Index Scan,Hash Joinetc.) - determines how the RAM, cache, and temporary files on the disk will be used (that’s why it’s called a physical plan, because the physical resources of the system are already considered)
- the Logical Plan is transformed into a specific set of operations to be performed (
- and finally the query is executed (Execution)
- get data from disk, change data in memory, etc.
- if it is a
SELECT, the data is sent to the client - if
INSERT/UPDATE/DELETEis performed – the data is physically changed on the disk
- finishing the operation (Commit or Rollback)
COMMIT– changes are recorded in the database and become available to other clientsROLLBACK– changes are returned to the state beforeBEGIN
Using EXPLAIN
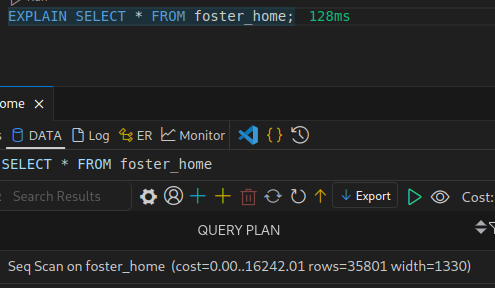
So, with the EXPLAIN, we can get the Execution Plan – that is, see what operations will be performed and how much data and resources they will affect.
The simplest example might look like this:
EXPLAIN SELECT * FROM table_name;
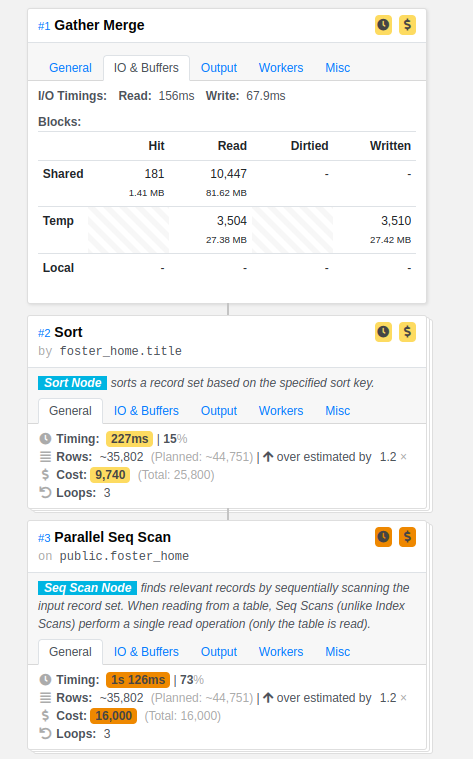
An Execution Plan is a tree of physical operations, where Nodes are individual operations, such as Seq Scan, Index Scan, Sort, Join, Aggregate, etc., and arrows are connections between nodes and data transfer between operations.
EXPLAIN Visualization
It is possible to visualize Explain results, for example, online with the https://www.pgexplain.dev:
Or https://explain.depesz.com:
EXPLAIN Options
Basic syntax:
EXPLAIN (options) statement
The main options are as follows:
ANALYZE: when we just callEXPLAIN, no real action is performed; addingANALYZEstarts the query execution and then displays the statistics- default: FALSE
VERBOSE: includes additional information in the result (names of columns, functions, etc.)- default: FALSE
COSTS: displaying the “cost” of executing an operation – a conditional unit of measuring the cost of executing a request, considering CPU and IO costs- default: TRUE
BUFFERS: displaying the use of memory buffers (only ifANALYZE=TRUE) – how much data is found in the cache, how much will be read from the disk, written to the disk, etc.- default: FALSE
FORMAT: format used to display a result –TEXT,XML,JSON,YAML- default: TEXT
EXPLAIN Results reading
Let’s take a look at what we got as a result of fulfilling this query:
EXPLAIN (ANALYZE, VERBOSE, BUFFERS, FORMAT YAML) SELECT * FROM foster_home;
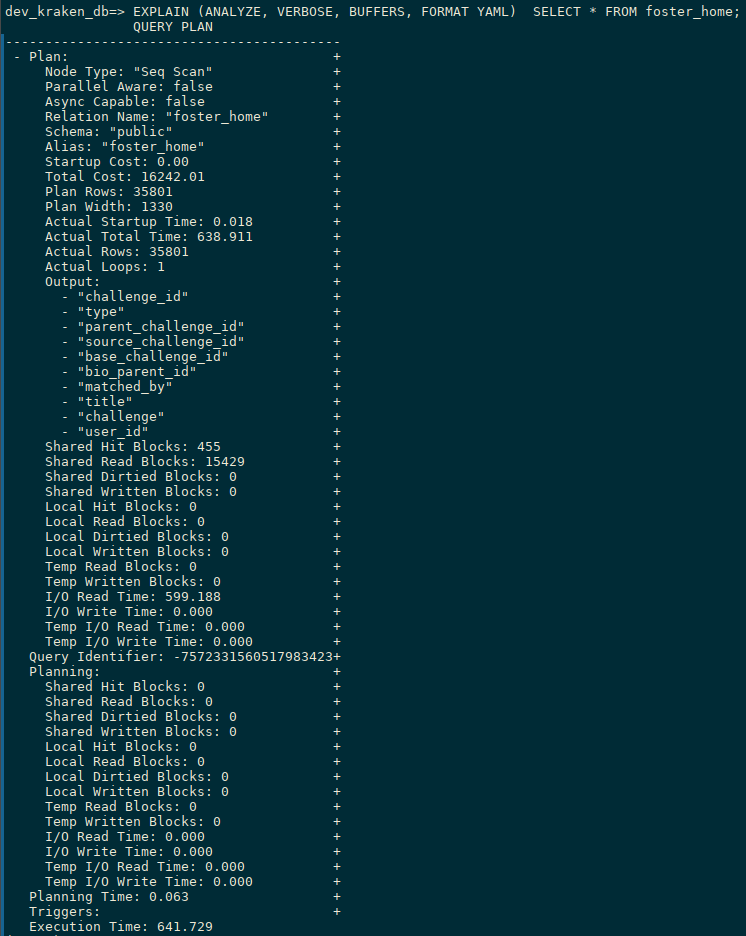 What interesting things do we have here?
- basic plan and general information:
Node Type: "Seq Scan": Sequential Scan operation, without using indexesParallel Aware: false: the request will be executed without parallelizationAsync Capable: false: request cannot be executed asynchronouslyRelation Name: "foster_home": name of the table being acted onSchema: "public": the name of the schema in which the table is located
- execution cost assessment (COSTS):
Startup Cost: 0.00: the operation starts instantly because it is a sequential readTotal Cost: 16242.01: estimate of the cost of the entire operation (not time, but conventional units)Plan Rows: 35801: plan to return 35801 rows as a result of the queryPlan Width: 1330: average expected row size in bytes
- actual fulfillment of the request (ANALYZE):
Actual Startup Time: 0.018: time to start the query executionActual Total Time: 638.911: how long the execution took in totalActual Rows: 35801: how many rows were returned as a result of execution
- resulted data (Output):
- a list of columns that were returned as a result of the query (all, because we are executing
SELECT *)
- a list of columns that were returned as a result of the query (all, because we are executing
- memory buffers (BUFFERS):
Shared Hit Blocks: 455: 455 blocks with existing data were found inshared_buffersShared Read Blocks: 15429: 15429 blocks had to be read from diskShared Dirtied Blocks: 0andShared Written Blocks: 0:no data was changed as a result of the requestTemp Read Blocks: 0andTemp Written Blocks: 0: temporary files were not used (thetemp_blks_readinpg_stat_statements)
- input/output operations (I/O)
I/O Read Time: 599.188: how much time was spent reading from the diskI/O Write Time: 0.000:nothing was writtenTemp I/O Read Time: 0.000andTemp I/O Write Time: 0.000:again, no temporary files were used
EXPLAIN and memory usage
What’s most interesting to me, because we came to this point precisely because we were dealing with the question of “what ate up all the memory on the server” – how much memory will be used when executing various requests.
shared_buffers use
So, in the EXPLAIN results, we saw that the evaluation was done:
Plan Rows: 35801: it is planned to return 35801 rows as a result of the queryPlan Width: 1330: and each row will take 1330 bytes in memory
That is, as a result of executing the SELECT * FROM foster_home query, 35801 rows are expected to be received, each with an average size of 1330 bytes.
Accordingly, it is planned to have shared_buffers at the time of query execution:
35801*1330/1024/1024
45
45 megabytes.
But the real size after execution is indicated in Shared Hit Blocks + Shared Read Blocks: 455 data blocks of 8 KB each were already in memory, and 15429 blocks were read from disk.
Given that each block is 8 KB, we have:
(455+15429)*8/1024
124
Let’s compare it to the size of the table itself:
dev_kraken_db=> SELECT pg_size_pretty(pg_relation_size('foster_home'));
 pg_size_pretty
----------------
 124 MB
So, as a result of executing SELECT * FROM foster_home, we will have 124 megabytes in shared_buffers (3640 bytes were already there, and 123432 will be additionally read from the disk).
Although for shared_buffers on the Dev server we have allocated:
dev_kraken_db=> SHOW shared_buffers;
 shared_buffers
----------------
 190496kB
~186 megabytes.
The difference in the Plan Width and Shared Read Blocks results
Why did we see ~45 megabytes in the Plan, and 124 MB after execution?
Because Plan Width displays data on the average row size, and Shared Read Blocks displays how many physical blocks of data were read from the disk.
For the values in Plan Width, PostgreSQL uses data from the pg_stats.avg_width view.
Columns in our table:
dev_kraken_db=> \d foster_home
                  Table "public.foster_home"
       Column        | Type  | Collation | Nullable | Default
---------------------+-------+-----------+----------+---------
 challenge_id        | text  |           |          |
 type                | text  |           |          |
 parent_challenge_id | text  |           |          |
 source_challenge_id | text  |           |          |
 base_challenge_id   | text  |           |          |
 bio_parent_id       | text  |           |          |
 matched_by          | text  |           |          |
 title               | text  |           |          |
 challenge           | jsonb |           |          |
 user_id             | text  |           |          |
Indexes:
    "foster_home_challenge_id" btree (challenge_id)
And their size in pg_stats:
dev_kraken_db=> SELECT attname, avg_width
FROM pg_stats
WHERE tablename = 'foster_home';
       attname       | avg_width
---------------------+-----------
 type                |         7
 bio_parent_id       |        37
 matched_by          |        18
 challenge_id        |        37
 parent_challenge_id |        37
 title               |        27
 user_id             |        37
 source_challenge_id |        37
 base_challenge_id   |        37
 challenge           |      1056
This gives us the same 1330 bytes:
1056+37+37+37+27+37+37+18+37+7
1330
So, we are planning to get 35801 rows, and each row is about ~1330 bytes.
But we can find out their actual size with pg_column_size():
dev_kraken_db=> SELECT pg_size_pretty(avg(pg_column_size(t)))
FROM foster_home t;
       pg_size_pretty
-----------------------------
 1424.0065081980950253 bytes
Or:
1424*35801/1024/1024
48
48 megabytes.
But still not the 124 megabytes that were read from the disk, right? Why is that?
Because:
- data from the disk is read in blocks of 8 KB, not individual lines:
- that is, even if you need to get several lines of a couple of kilobytes, you will have to read 8 KB of the block in which they are located
- the table can be fragmented:
- that is, the strings can be located in different data blocks on the disk, and you will have to read each block
Seq Scan(full table scan) is performed instead of using an index:- because of this, the entire table is read from the disk
- some data can be stored outside the main table in a TOAST table:
- but in
SELECT pg_size_pretty(pg_relation_size('foster_home'));we already have the size without TOAST and indexes – 124 megabytes - you can get the entire size with
SELECT pg_size_pretty(pg_total_relation_size('foster_home'));
- but in
Regarding the index: what does the difference in data read operations look like when there is an index and when there is not?
For example, let’s check an EXPLAIN SELECT on the user_id field for which there is no index:
dev_kraken_db=> EXPLAIN (ANALYZE, VERBOSE, BUFFERS, FORMAT YAML)  SELECT user_id FROM foster_home;
...
     Node Type: "Seq Scan"               +
     ...
     Total Cost: 16242.01                +
     Plan Rows: 35801                    +
     Plan Width: 37                      +
     ...
     Actual Rows: 35801                  +
     ...
     Output:                             +
       - "user_id"                       +
     Shared Hit Blocks: 715              +
     Shared Read Blocks: 15169           +
...
Again, we have Node Type: "Seq Scan", i.e. reading the entire table from disk and, accordingly, many Shared Read Blocks.
Whereas for challenge_id, for which the index is available, it would be:
dev_kraken_db=> EXPLAIN (ANALYZE, VERBOSE, BUFFERS, FORMAT YAML) SELECT challenge_id FROM foster_home;
                 QUERY PLAN
--------------------------------------------
 - Plan:                                   +
     Node Type: "Index Only Scan"          +
     ...
     Total Cost: 1629.43                   +
     Plan Rows: 35801                      +
     Plan Width: 37                        +
     ...
     Actual Rows: 35801                    +
     ...
     Output:                               +
       - "challenge_id"                    +
     Heap Fetches: 0                       +
     Shared Hit Blocks: 271                +
     Shared Read Blocks: 0                 +
...
Here, all the data from our index is already in shared_buffers, so nothing was read from the disk at all.
We can check shared_buffers for the foster_home_challenge_id index as follows:
dev_kraken_db=> SELECT count(*) AS cached_pages,
       pg_size_pretty(count(*) * 8192) AS cached_size
FROM pg_buffercache
WHERE relfilenode = (SELECT relfilenode FROM pg_class WHERE relname = 'foster_home_challenge_id');
 cached_pages | cached_size
--------------+-------------
          271 | 2168 kB
Okay, now this is more clear, right?
But in addition to shared_buffers, the work_mem can also be used during the execution of a request.
work_mem use
work_mem is used if the query contains ORDER BY, HASH JOIN.
See Resource Consumption.
In this case, if there are several such operations in one request, then each will be allocated its own work_mem area:
Query Plan:
   Sort (work_mem = 4MB)
     -> Nested Loop
         -> Sort (work_mem = 4MB)
         -> Hash Join (work_mem = 4MB)
In addition, a separate work_mem is allocated to each Worker, that is, an additional process when executing a query – see How Parallel Query Works:
...
   ->  Sort  (cost=25736.77..25774.06 rows=14917 width=1330) (actual time=1286.099..1352.484 rows=11934 loops=3)
         ...
         Worker 0:  actual time=1279.232..1338.547 rows=10752 loops=1
           ...
         Worker 1:  actual time=1281.125..1358.600 rows=12929 loops=1
           ...
...
We can check how much work_mem a query consumes and whether the default 4 megabytes is enough:
dev_kraken_db=> EXPLAIN (ANALYZE, VERBOSE, BUFFERS, FORMAT YAML)
dev_kraken_db-> SELECT * FROM foster_home ORDER BY title;
                 QUERY PLAN
--------------------------------------------
 - Plan:                                   +
     Node Type: "Gather Merge"             +
     ...
     Temp Read Blocks: 5497                +
     Temp Written Blocks: 5507             +
     ...
     Temp I/O Read Time: 192.337           +
     Temp I/O Write Time: 117.445          +
     ...
     Plans:                                +
       - Node Type: "Sort"
         ...
         Sort Key:                         +
           - "foster_home.title"           +
         Sort Method: "external merge"     +
         Sort Space Used: 17048            +
         Sort Space Type: "Disk"           +
...
Here we see that:
Temp ReadandWritten Blocks: temporary files were usedTemp I/O ReadandWrite Time: The time spent working with the diskSort Method: "external merge"andSort Space Type: "Disk": the disk was used for sorting, not"Memory", because the entire result did not fit in thework_memSort Space Used: 17048: 17048 kilobytes (16 megabytes) were used for sorting
We can check the current value for work_mem as follows:
dev_kraken_db=> SHOW work_mem;
 work_mem
----------
 4MB
That’s why we needed to create temp files for sorting.
If we increase work_mem (via SET for the current session, or via Parameters Group for the RDS to make the changes permanent):
dev_kraken_db=> SET work_mem = '20MB';
SET
So now we will see a different picture:
...
     Temp Written Blocks: 0                 +
     ...
     Temp I/O Write Time: 0.000             +
...
         Sort Key:                          +
           - "foster_home.title"            +
         Sort Method: "quicksort"           +
         Sort Space Used: 17454             +
         Sort Space Type: "Memory"          +

...
So, as a summary: with the EXPLAIN ANALYZE, we can get information about how much data will be read from disk to shared_buffers when executing a query, and how much data will be used in work_mem or temp files
How can this help us monitor “heavy” queries in AWS RDS?
AWS RDS PostgreSQL, and auto_explain
In RDS, we can enable the auto_explain, which will log EXPLAIN results for further analysis.
Documentation – auto_explain – log execution plans of slow queries. The code of the module itself is auto_explain.c.
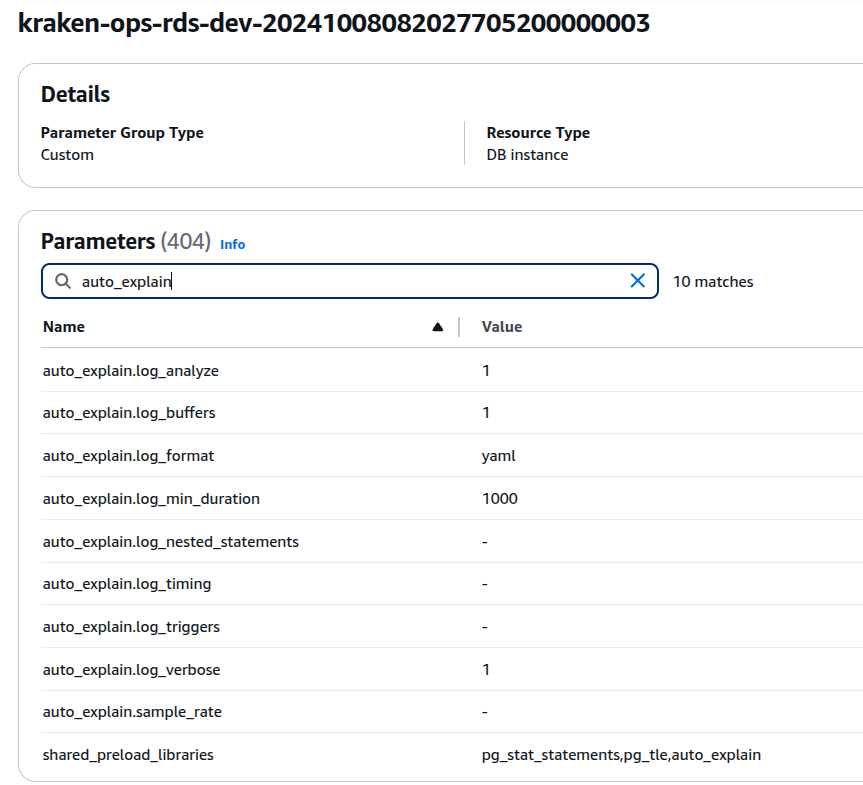
To enable auto_explain in RDS, we need to add it to the shared_preload_libraries parameter:
After that, reboot the RDS instance.
Next, configure the following parameters:
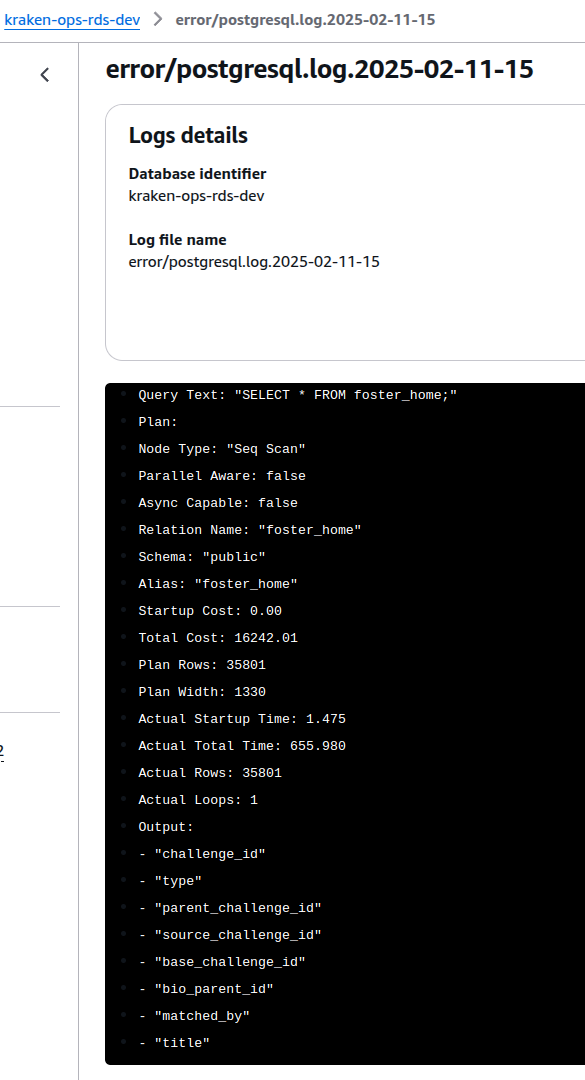
auto_explain.log_min_duration: how long a query should be executed to be written to the log withEXPLAIN(in milliseconds)auto_explain.log_analyze: performANALYZEinstead of justEXPLAIN(may affect RDS performance)auto_explain.log_buffers: add information onBUFFERSauto_explain.log_verbose: enableVERBOSEfor theEXPLAINauto_explain.log_format: which format use in the log
Save the parameters, and check the log:
Done.
Useful links
- Reading a Postgres EXPLAIN ANALYZE Query Plan
- What Is an Execution Plan and How to Find It in PostgreSQL
- Execution Plan
- System Administration Functions
- auto_explain — log execution plans of slow queries
- How can I log execution plans of queries for Amazon RDS PostgreSQL or Aurora PostgreSQL to tune query performance?
- Postgres auto_explain: Log Slow PostgreSQL Query Plans Automatically
- Common DBA tasks for Amazon RDS for PostgreSQL
- Lexical Scanning in PostgreSQL
![]()
