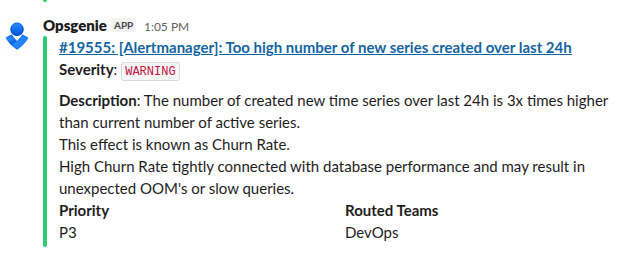
 One day I received one of the default VictoriaMetrics alerts that are generated during the deployment of the Helm chart victoria-metrics-k8s-stack:
I thought about writing a short post like “What is Churn Rate and how to fix it,” but in the end, I ended up diving deep into how VictoriaMetrics works with data in general – and it turned out to be a very interesting topic.
Let’s first briefly discuss what “metrics” and time series are, and then see how they affect system resources – CPU, memory, and disk.
Contents
Metric vs Time Series vs Sample
We all deal with metrics in monitoring – whether it’s Prometheus, VictoriaMetrics, or InfluxDB – and we then use these metrics in our Grafana dashboards or VMAlert alert rules.
But what exactly is a “metric“? And what are time series, samples, and data points? How does the number of different values of a single label for a metric affect disk and memory usage?
For example, in my blog, I usually just use the word “metric” because in 99% of cases, that’s enough to describe the object in question.
However, to work effectively with monitoring systems, it is necessary to understand the difference between these concepts.
What is Metric?
Metric: what is measured
For example – cpu_usage, memory_free, http_requests_total, database_connections.
The VictoriaMetrics documentation contains a very precise idea – it’s like the variable names through which we transfer data, see Structure of a metric.
A metric has its own name and, optionally, a set of labels (or tags) that allow you to add more context to a specific measurement.
In addition, labels affect how data for this metric will be stored and searched.
In other words, a metric is a “scheme” that describes what we are measuring and the characteristics (labels) by which we can group data.
Example:
Metric: "cpu_usage{server, core}"
Here:
- metric name:
cpu_usage- label name:
server - label name:
core
- label name:
What is the Time Series?
Time Series: a sequence of data
This is the complete sequence of records grouped for a specific metric and its labels with values – that is, a set of metric_name{label_name="label_value"} – and sorted by time.
Example:
Metric: "cpu_usage{server, core}"
├── Time series: cpu_usage{server="web01", core="0"}
│   ├── 1753857852, 75.5
│   ├── 1753857912, 76.2
│   ├── 1753857972, 74.8
│   └── 1753858032, 73.1
├── Time series: cpu_usage{server="web01", core="1"}
│   ├── 1753857852, 82.3
│   ├── 1753857912, 81.7
│   └── ...
└── Time series: cpu_usage{server="web02", core="0"}
    ├── 1753857852, 45.2
    ├── 1753857912, 47.8
    └── ...
Here, for the metric cpu_usage{server, core}, we have three different time series:
cpu_usage{server="web01", core="0"}- At 1753857852 (Wed Jul 30 2025 06:44:12 GMT), the value was 75.5.
- At 1753857912 (Wed Jul 30 2025 06:45:12 GMT), the value was 76.2.
- …
cpu_usage{server="web01", core="1"}- at time 1753857852, the value was 82.3
- …
cpu_usage{server="web02", core="0"}- at time 1753857852, the value was 45.2
- …
What are Sample and Data Points?
Sample: a specific record in a data sequence (time series).
Sample and Data Point are synonyms and represent a single metric value at a specific point in time.
It looks like (timestamp, value), for example, “1753857852 75.5” – that is, in Unix timestamp 1753857852 the value was 75.5%.
Example:
Metric: "cpu_usage{server, core}"
├── Time series: cpu_usage{server="web01", core="0"}
│   ├── Sample: 1753857852, 75.5
│   ├── Sample: 1753857912, 76.2
│   ├── Sample: 1753857972, 74.8
│   └── Sample: 1753858032, 73.1
├── Time series: cpu_usage{server="web01", core="1"}
│   ├── Sample: 1753857852, 82.3
│   ├── Sample: 1753857912, 81.7
│   └── ...
└── Time series: cpu_usage{server="web02", core="0"}
    ├── Sample: 1753857852, 45.2
    ├── Sample: 1753857912, 47.8
    └── ...
Here:
- For the time series
cpu_usage{server="web01", core="0"}, we have four samples:- 1753857852, 75.5
- 1753857912, 76.2
- 1753857972, 74.8
- 1753858032, 73.1
And the data for the entire observation period for each unique combination cpu_usage{server="some_server", core="some_core"} will form the same time series, even if this data is collected for years, until the value in either server or core changes.
High Cardinality vs High Churn rate
Both problems have the same “origin,” but differ slightly in essence.
High cardinality is a “persistent problem” that affects data storage, indexing, and search.
It occurs when we have many unique combinations of labels, even if the values of the metrics themselves are infrequent or cease to arrive.
This leads to a large number of live and inactive series, which increases the size of IndexDB, memory usage, and search time. We will discuss IndexDB in more detail later.
See Cardinality explorer in VictoriaMetrics blogs.
High churn rate is an “online problem” where we constantly create new time series due to changes in label values, especially short-lived or dynamic ones (as in Kubernetes – pod_name, container_id, job_id, or something like client_ip).
This creates a large stream of new entries in IndexDB, loading the CPU, memory, and disk.
“Life of a Metric”
There is a very cool video that I saw many years ago, The Inner Life of the Cell, for some reason it came to mind here.
To understand how the number of labels (more precisely, their values) affects the amount of data in the system and CPU and memory usage, let’s take a look at how the whole process in VictoriaMetrics works “under the hood”.
A wonderful series of posts by Phuong Le will help us with this: How vmagent Collects and Ships Metrics Fast with Aggregation, Deduplication, and More.
There are seven parts, and for a truly “deep dive” into the internal architecture of VictoriaMetrics I highly recommend reading them.
But now we will quickly go through the process of adding new data and searching for it, and focus more on the Churn Rate issue.
“Write-path”: vminsert and vmstorage
So, let’s start from the beginning: vmagent collects metrics from exporters, and then this data must be written to vmstorage via vminsert.
In the case of vmsingle, all components work in a single process, but for a better picture, let’s separate them.
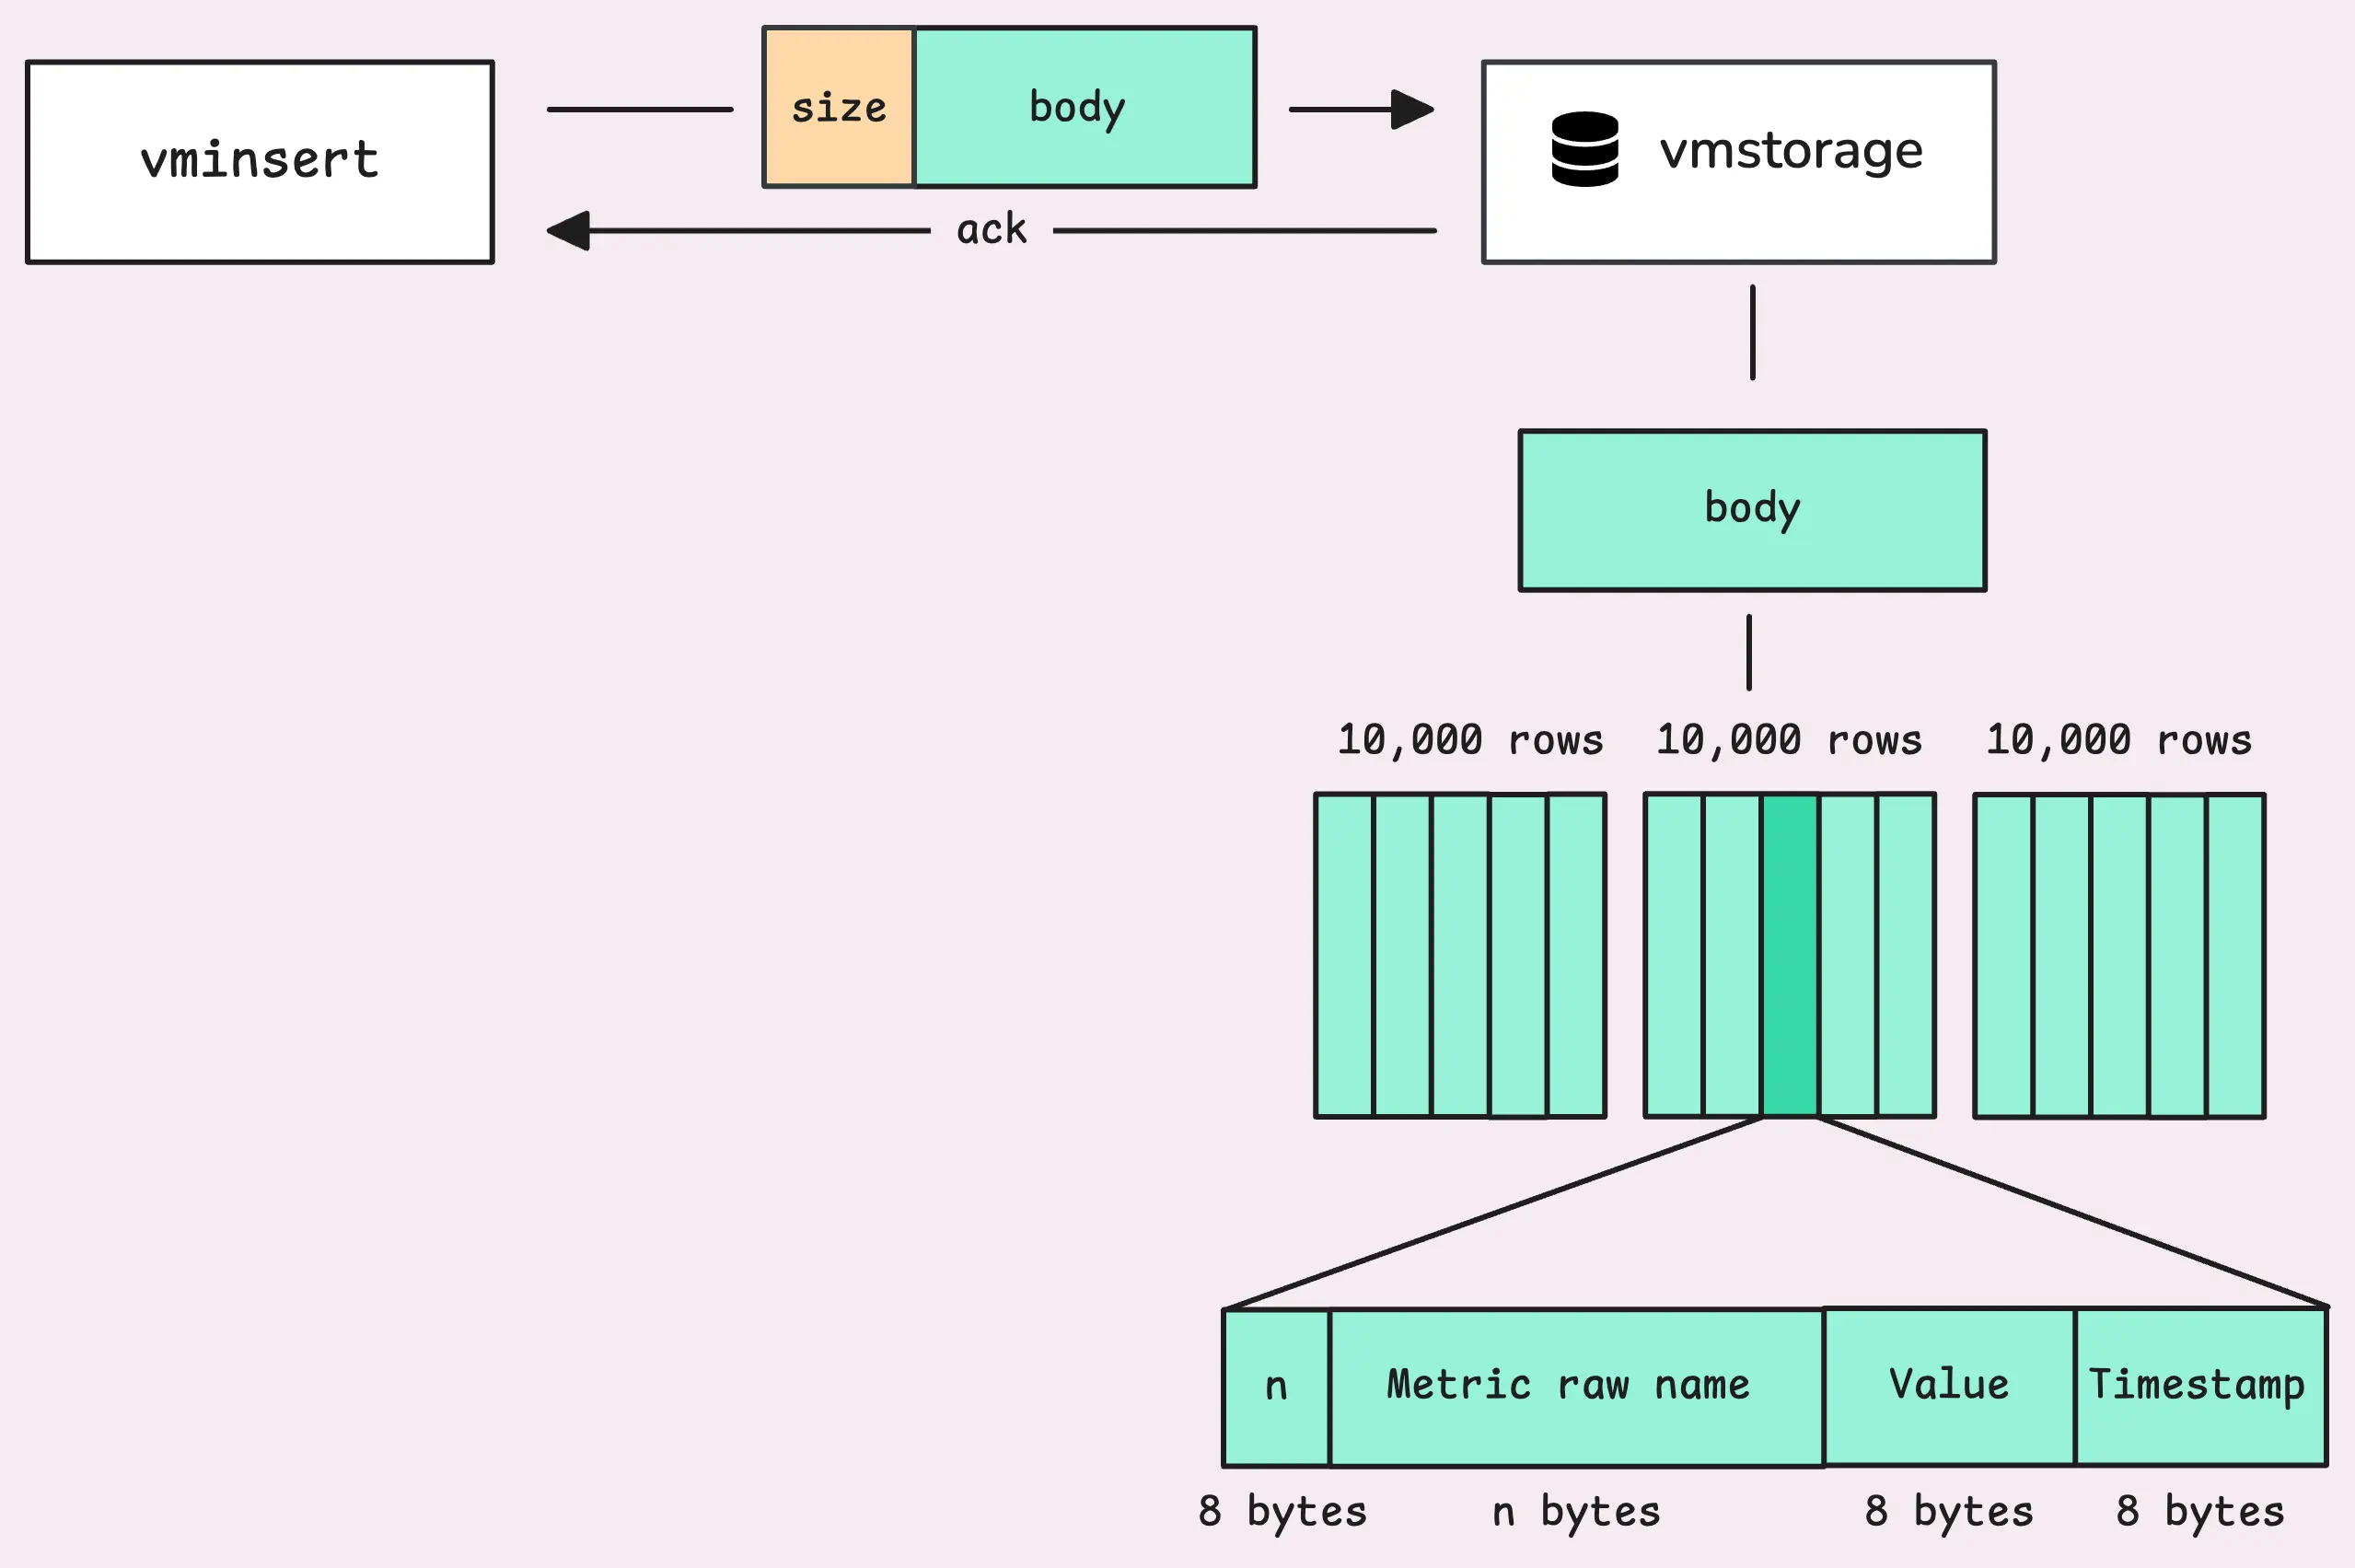
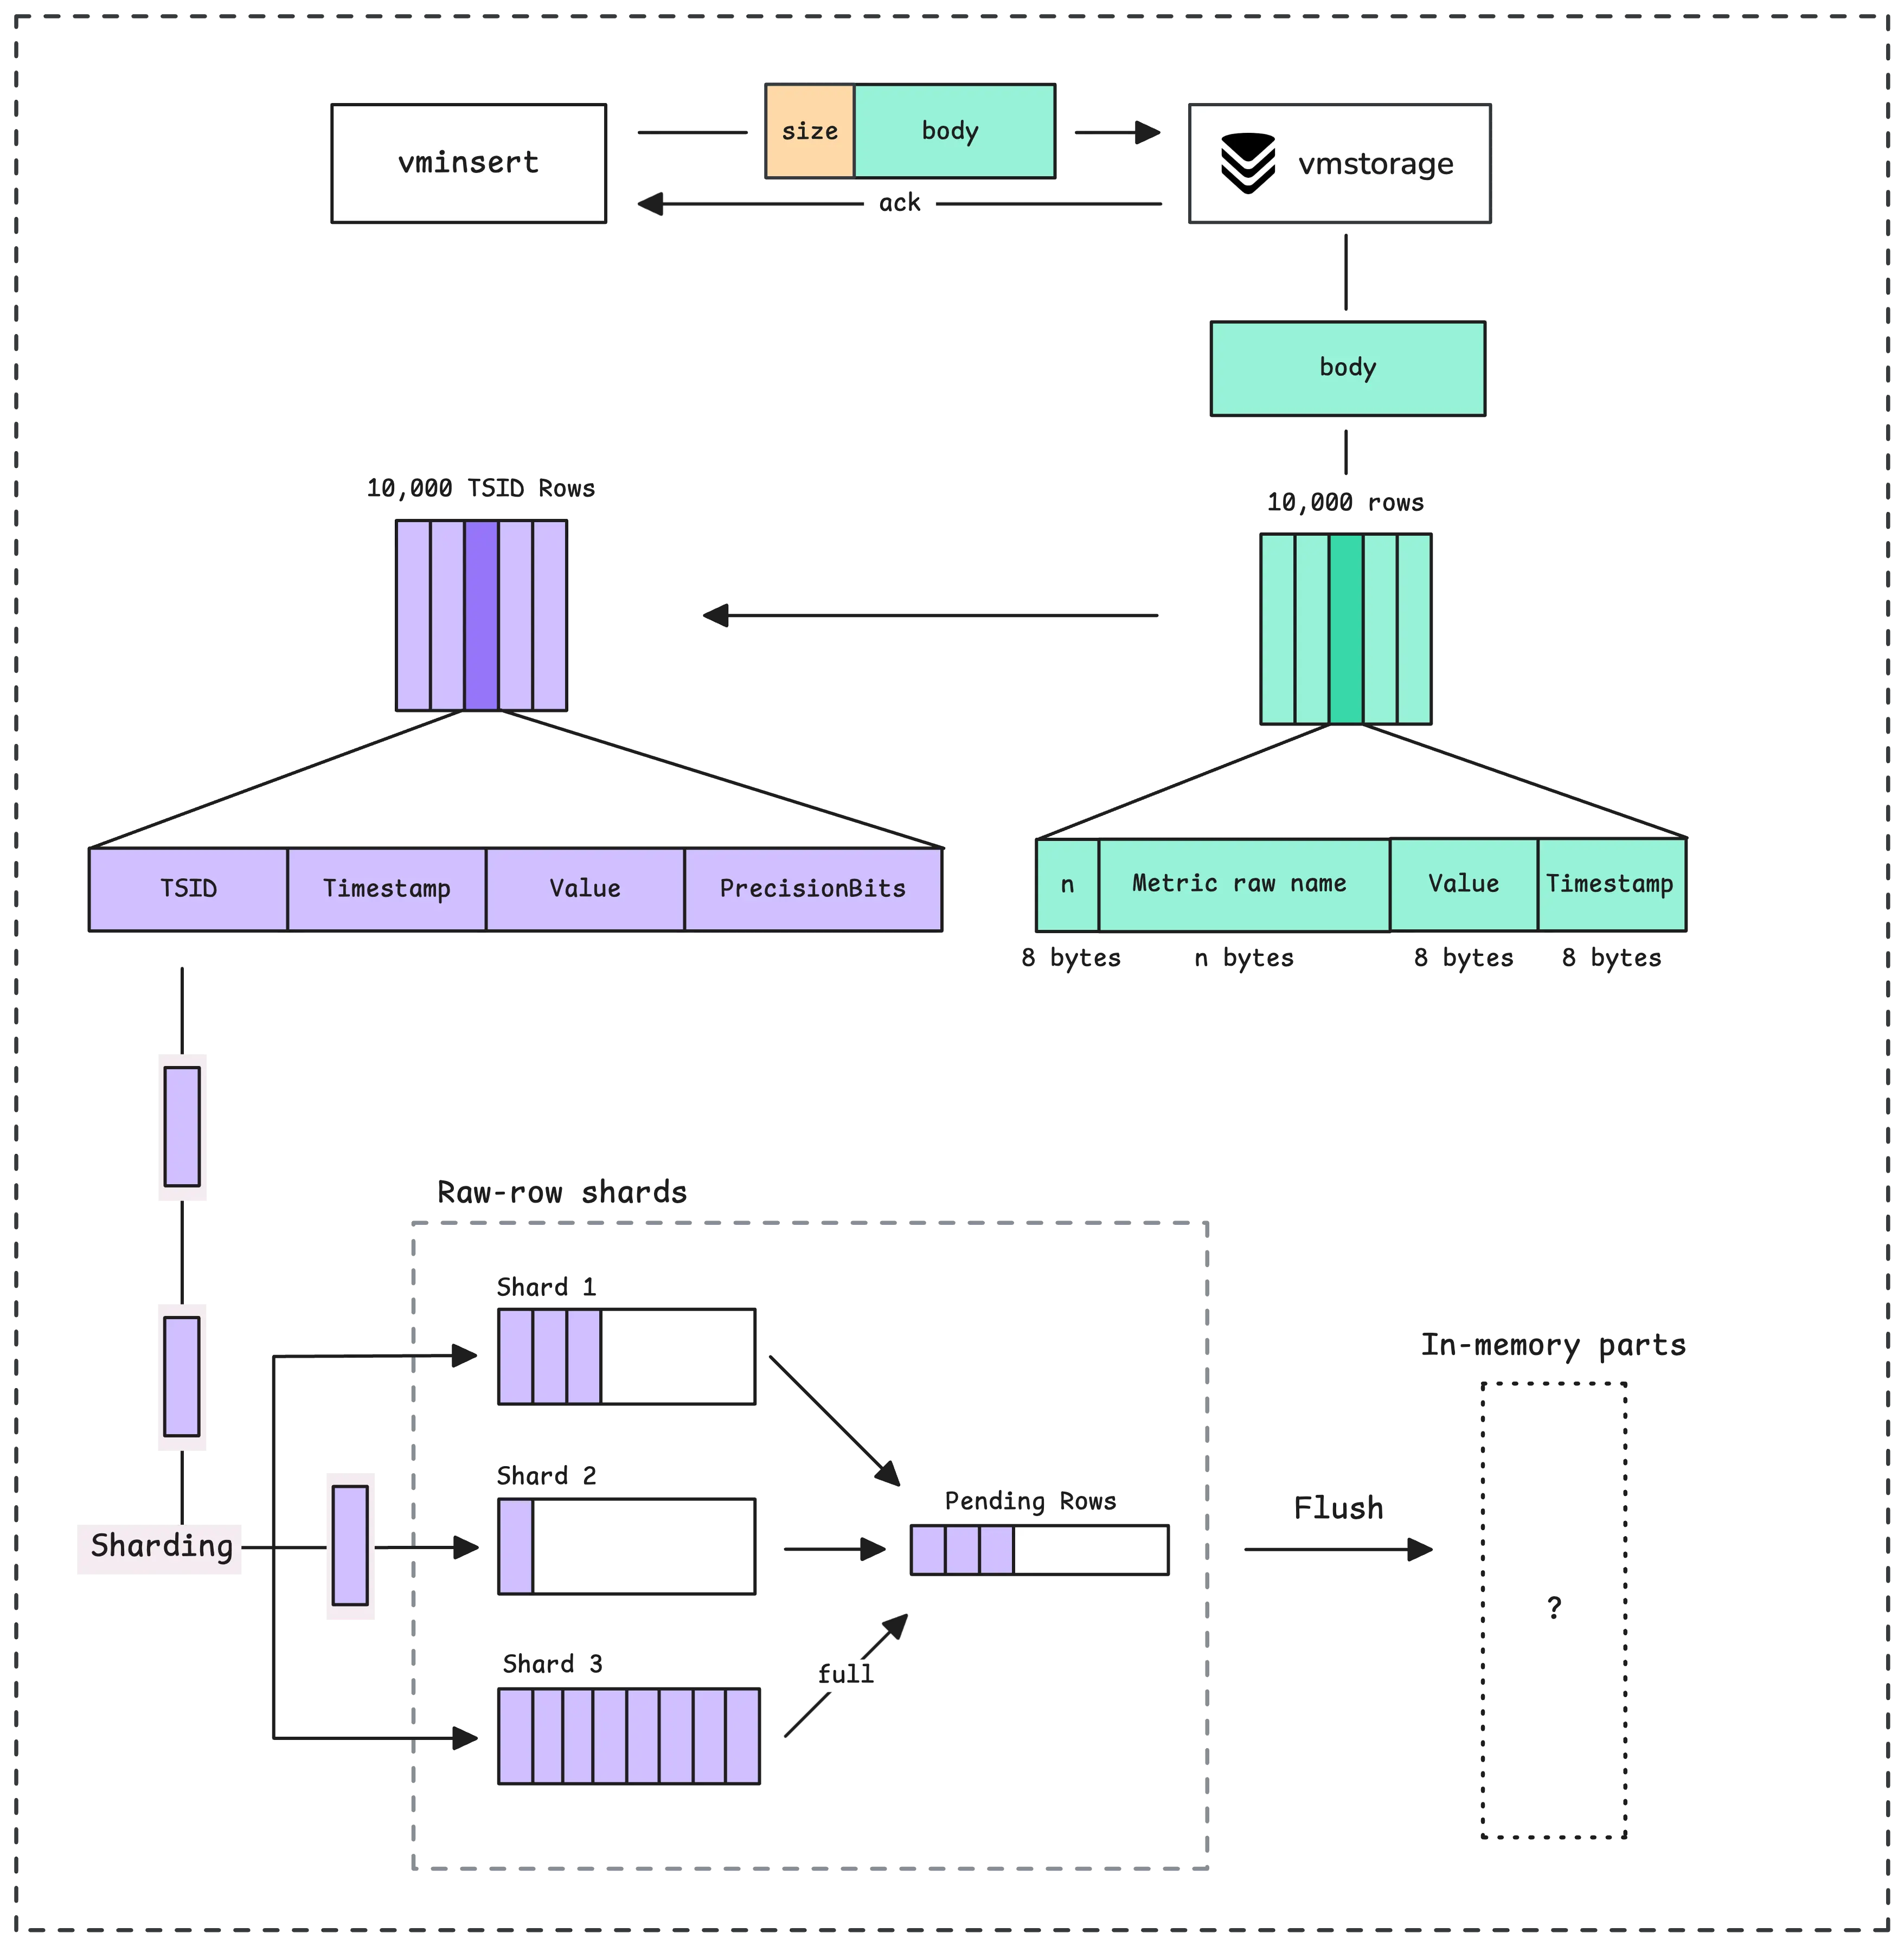
vminsert collects data into its memory, then sends it to vmstorage in blocks of up to 100 megabytes.
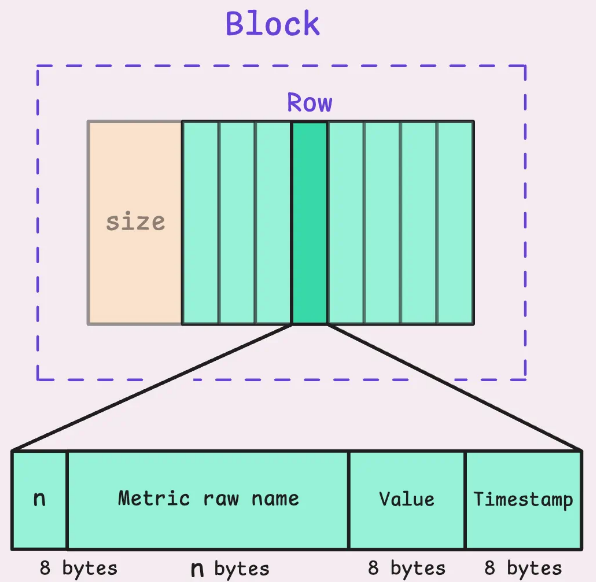
At the beginning of each block, vminsert sets the total size of the block, after which vmstorage begins to read the data in it in blocks of 24+n bytes, rows:
- The first 8 bytes indicate the size n – the size of the next sector, which contains the name of the metric and its labels.
- the second sector – these n bytes with the metric name and labels
- The third sector, 8 bytes in size, contains the sample value (“75.5” from the examples above).
- The fourth contains a timestamp, another 8 bytes
As a result, a row of 8*3 bytes (24) + n bytes is formed, where n is the length of the metric name and its label.
vmstorage forms its own blocks, with a maximum of 10,000 lines in each:
vmstorage, IndexDB, and TSID
Then the most interesting magic begins – Time Series ID, or TSID.
For each unique combination of metric+label+label value, VictoriaMetrics has its own unique ID, which is used to store data and for subsequent data retrieval.
TSID itself is an identifier (see type TSID struct), a purely internal mechanism of VictoriaMetrics itself, which values, unfortunately, we cannot see anywhere in logs:
// TSID is unique id for a time series.
//
// Time series blocks are sorted by TSID.
type TSID struct {
  MetricGroupID uint64

  JobID uint32

  InstanceID uint32

  // MetricID is the unique id of the metric (time series).
  //
  // All the other TSID fields may be obtained by MetricID.
  MetricID uint64
}
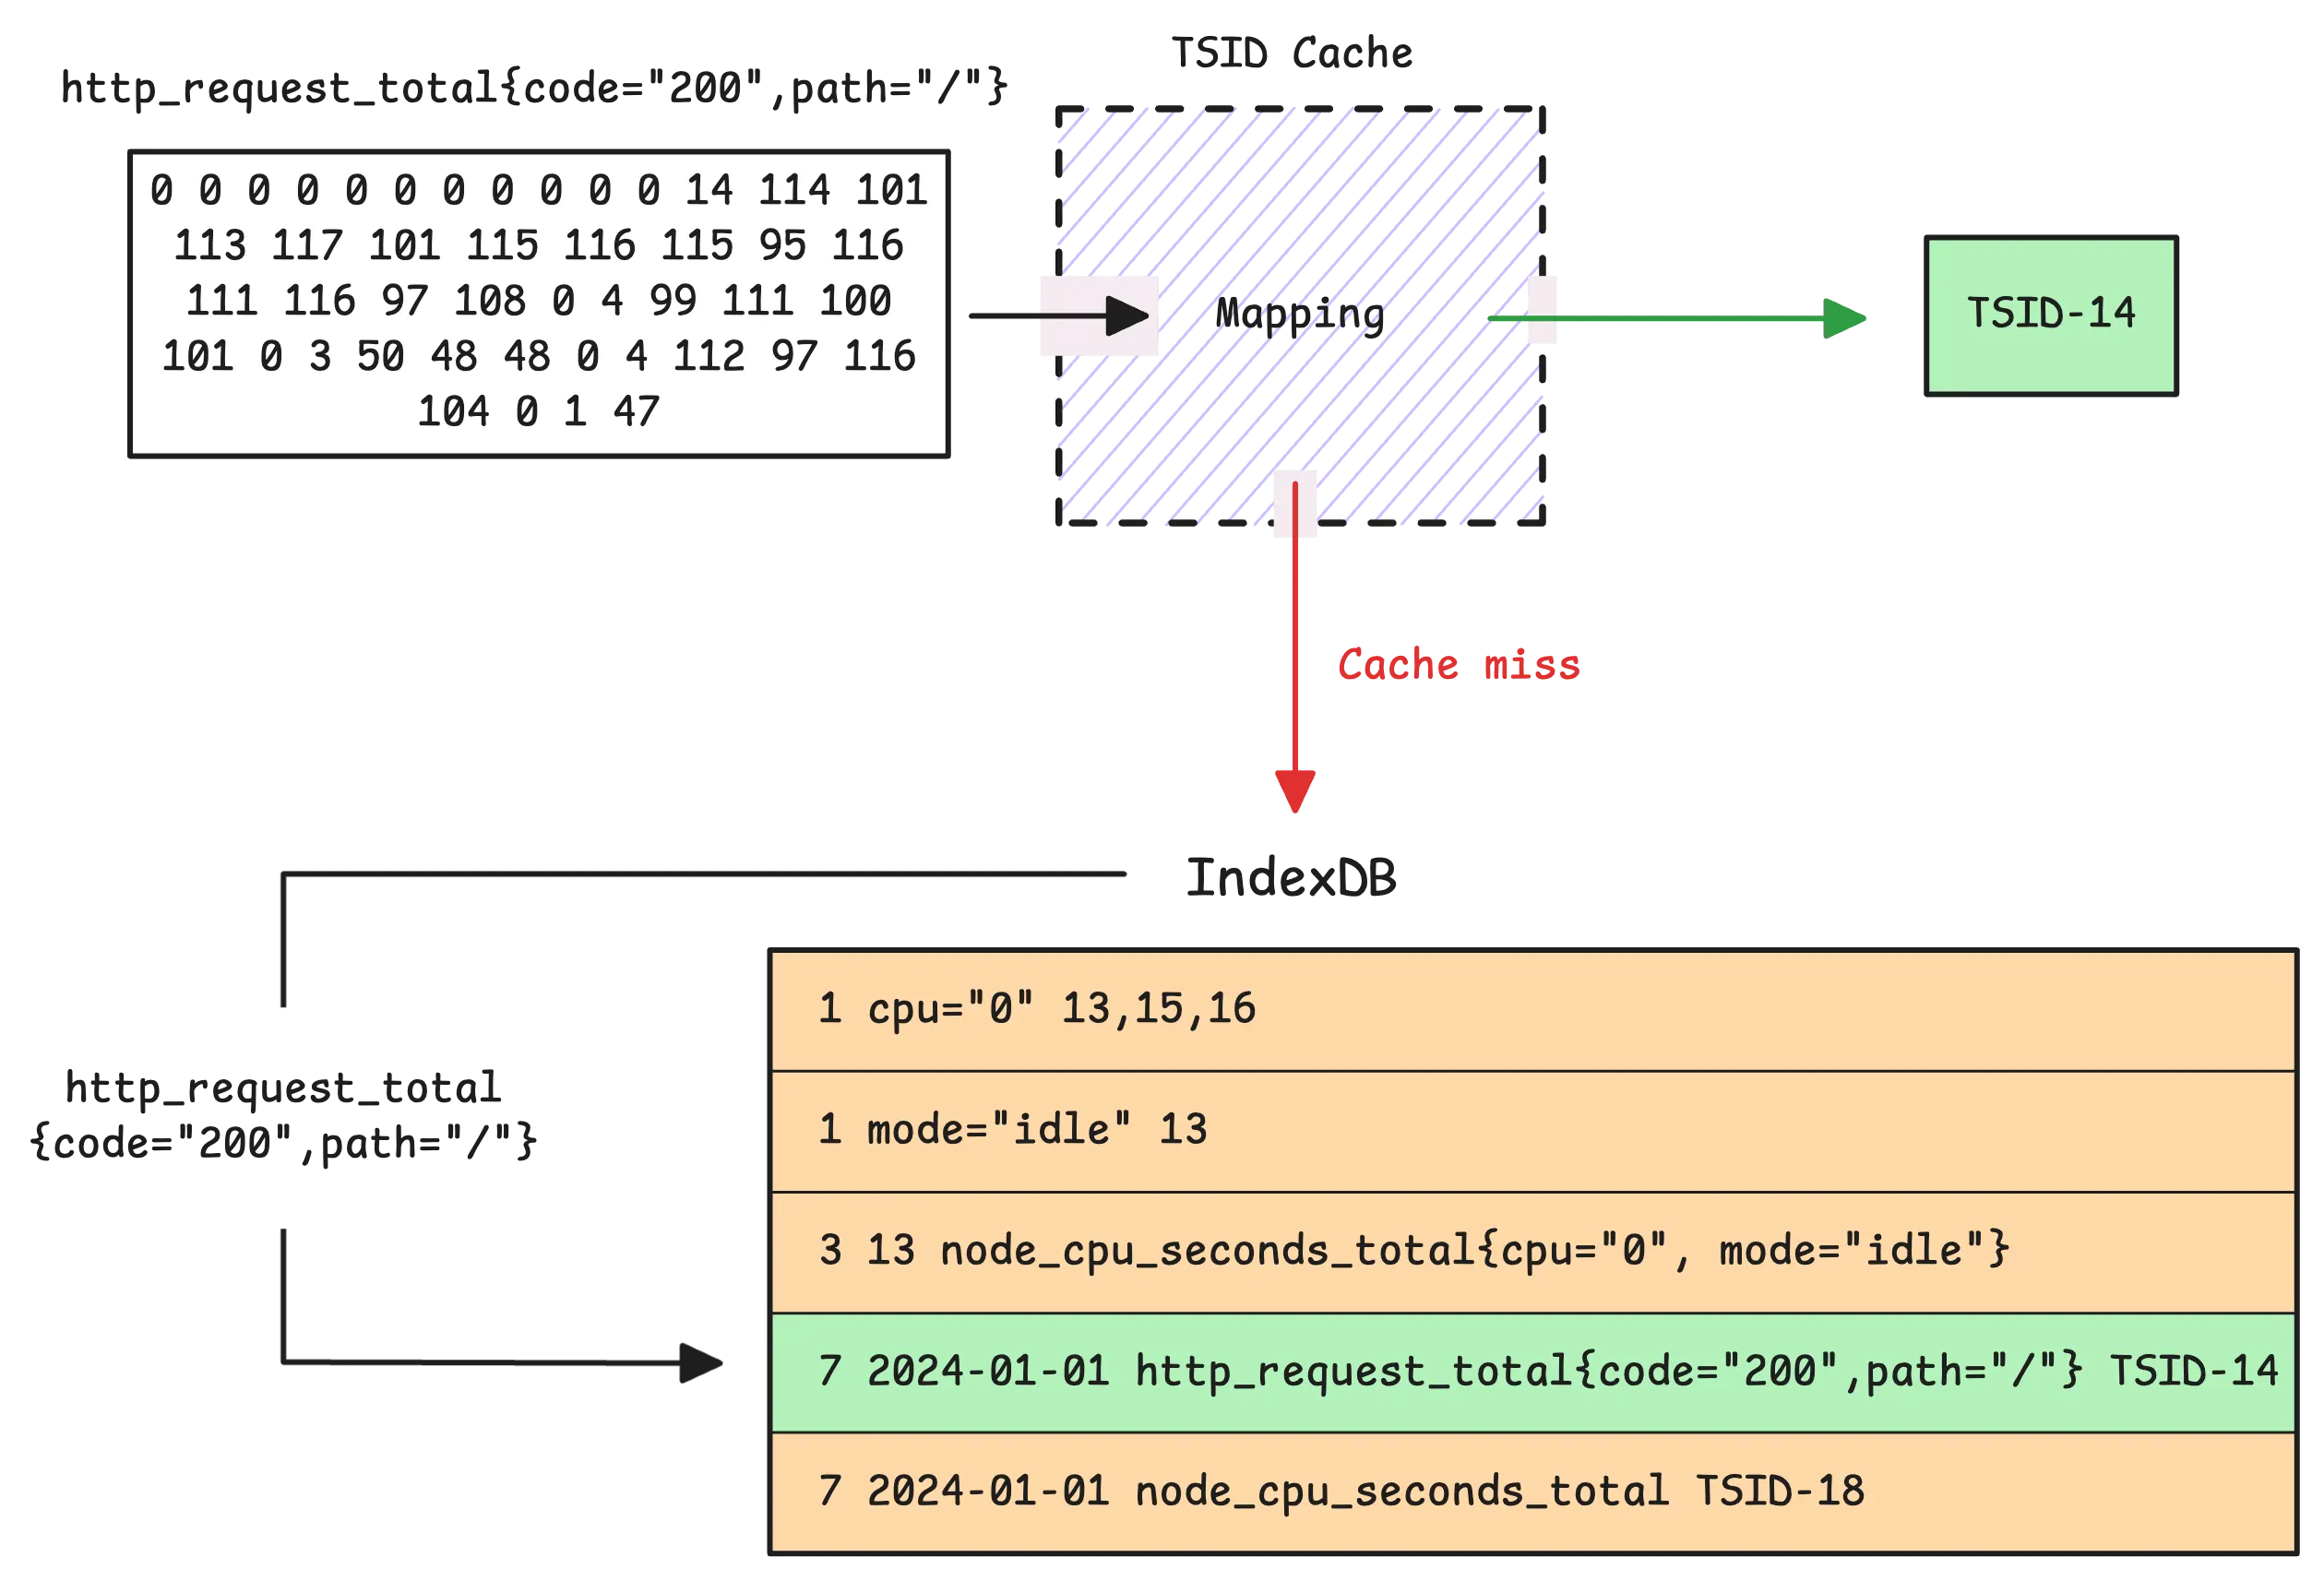
With a set of metric names and their tags (labels), vmstorage first checks its TSID Cache. If we already have a generated TSID for this combination, we use it.
If the data is not in the cache (the value of vm_slow_row_inserts_total increases), vmstorage refers to the IndexDB and starts searching for TSID there.
If TSID is found in IndexDB, it is added to the vmstorage cache, and the process continues:
If these are entirely new metric names and labels with their values, a new TSID is generated and registered in the vmstorage cache.
IndexDB stores two indexes, each containing several mappings between fields and IDs, as described in the section How IndexDB is Structured:
- 1 – Tag to metric IDs (Global index): each tag (label) is mapped to a metric name (its ID)
- 2 – Metric ID to TSID (Global index): The ID of each metric is mapped to TSID.
- 3 – Metric ID to metric name (Global index): mapping the actual name of the metric to its ID
- 4 – Deleted metric ID: tracker of deleted metric IDs.
- 5 – Date to metric ID (Per-day index): mapping dates to metric IDs for quick date-based searches (“is there data for this metric on this date?”)
- 6 – Date with tag to metric IDs (Per-day index): similar to the first Tag to metric IDs mapping, but by date
- 7 – Date with metric name to TSID (Per-day index): similar to the second Metric ID to TSID mapping, but by metric names and dates
These indexes are stored in memory and periodically flushed to persistent storage IndexDB in the indexdb/ directory, where, as in the data/ directory where the time series themselves are stored, data is merged to optimize storage and search.
For more details, see Part 3 of VictoriaMetrics’ blogs – How vmstorage Processes Data: Retention, Merging, Deduplication.
Returning to the issue of Churn Rate and High cardinality, each individual metric + label creates separate TSIDs, mappings are created in indexes for each label, and with a large amount of new data constantly being written from memory to disk, disk operations are called more often, resulting in a load on the CPU, memory, and disk I/O operations.
vmstorage and data storage on disk
Actually, we have already seen the most interesting part – the roles of IndexDB and TSID – but let’s go through the rest of the process.
From the data received from vminsert, we read the data and form our own blocks from rows.
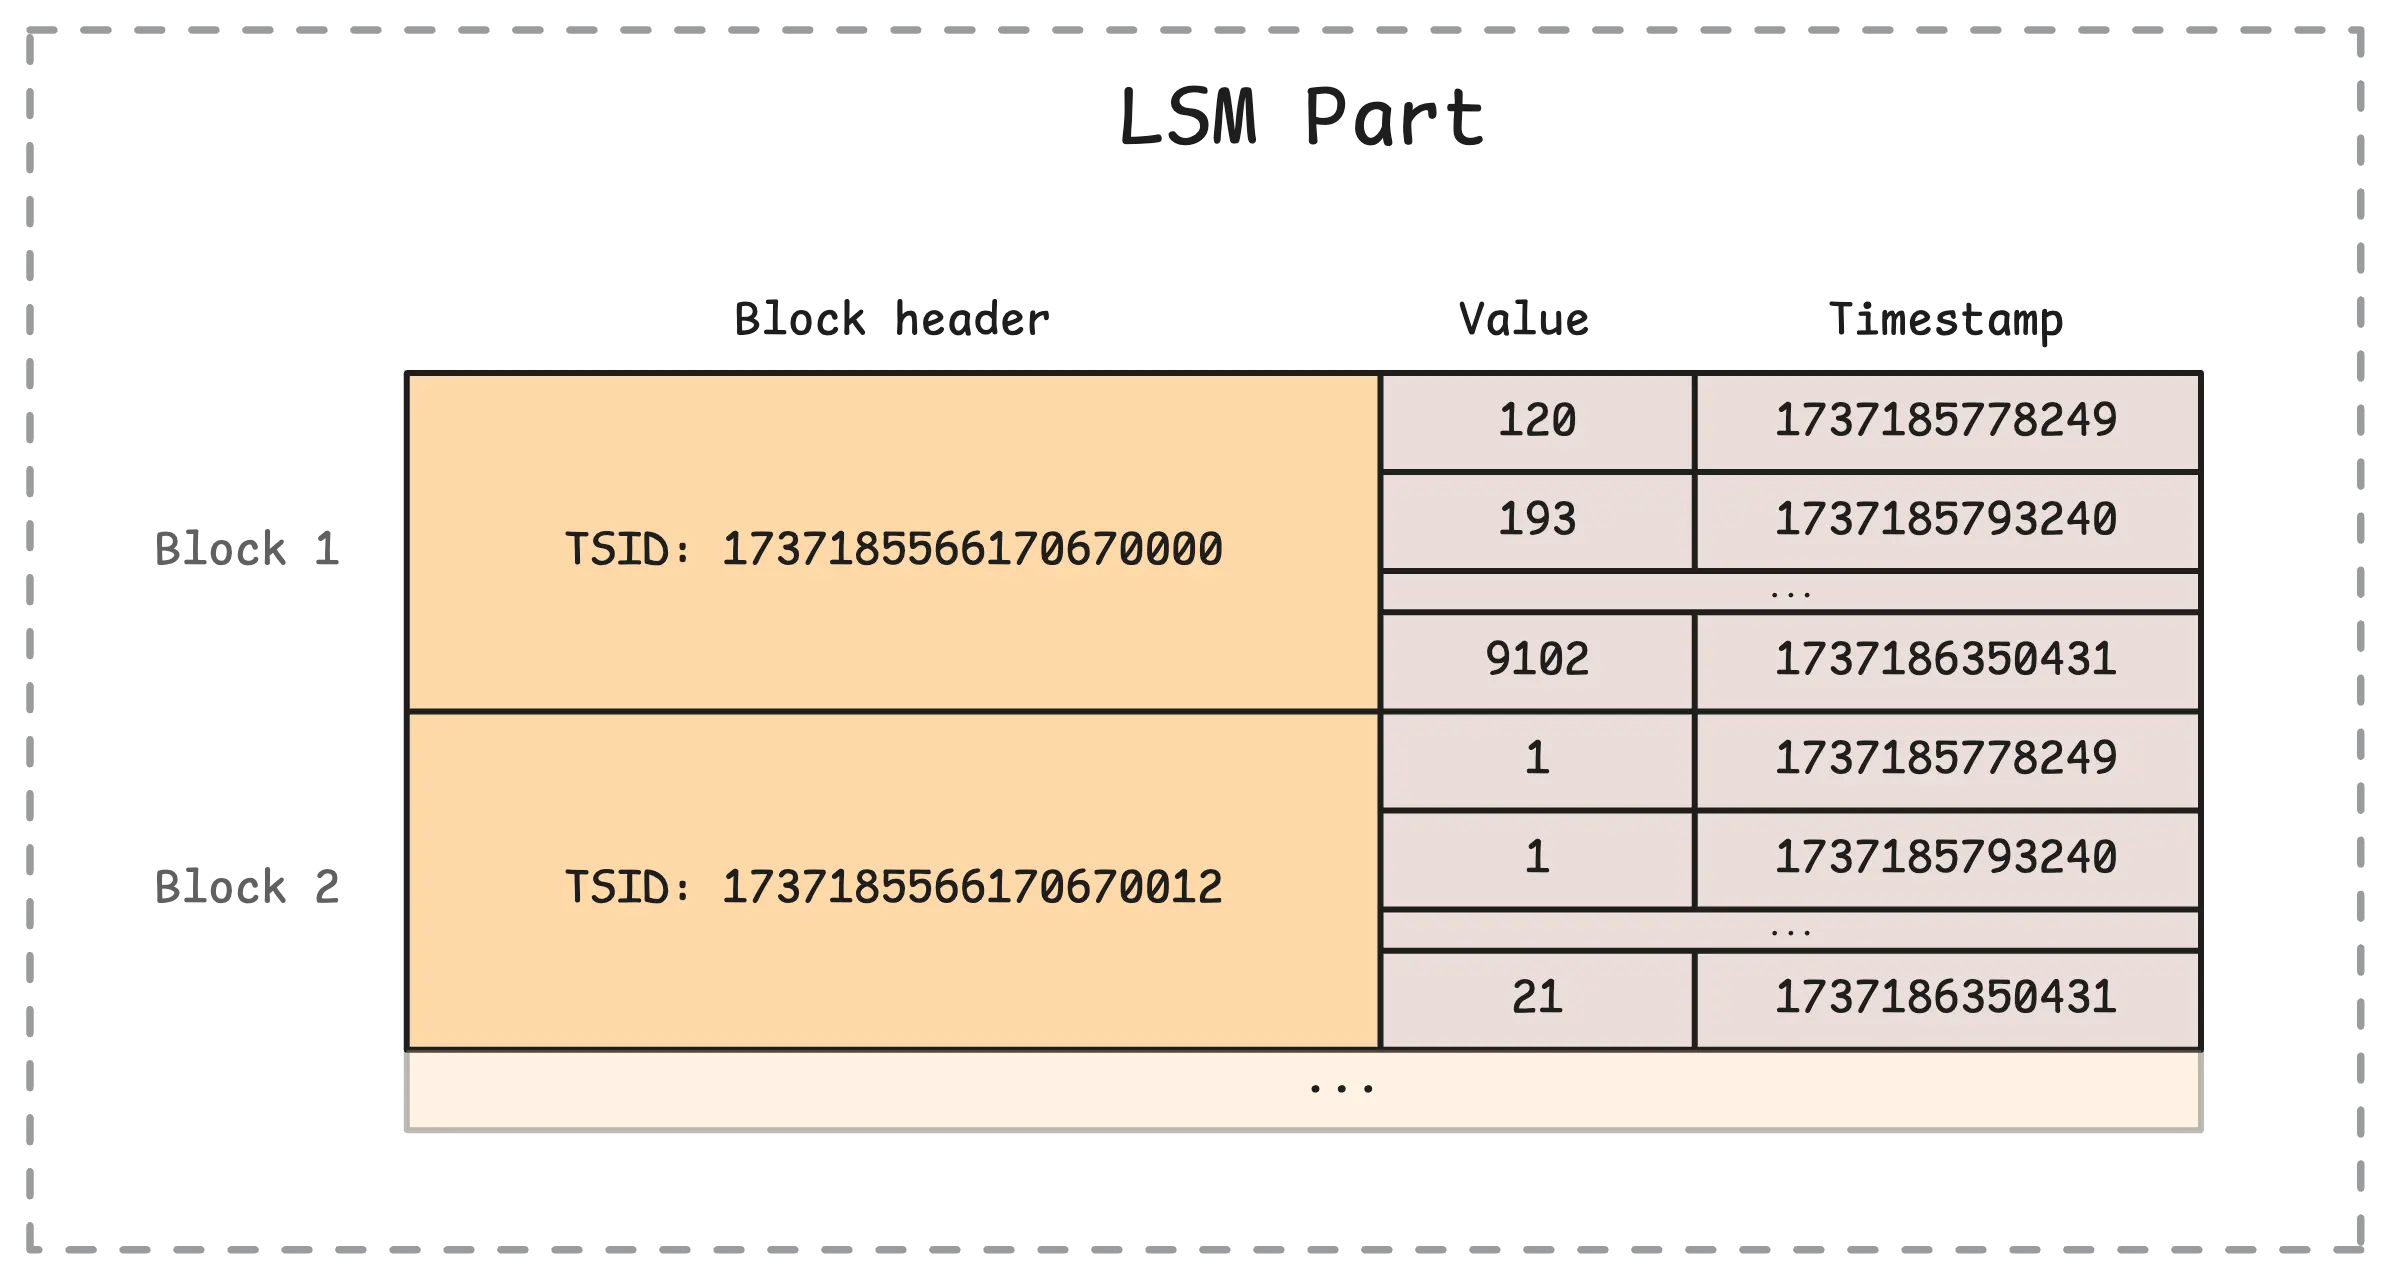
Each row vmstorage no longer stores the name of the metric but its TSID, and for each TSID it contains records with values and time (actually, time series):
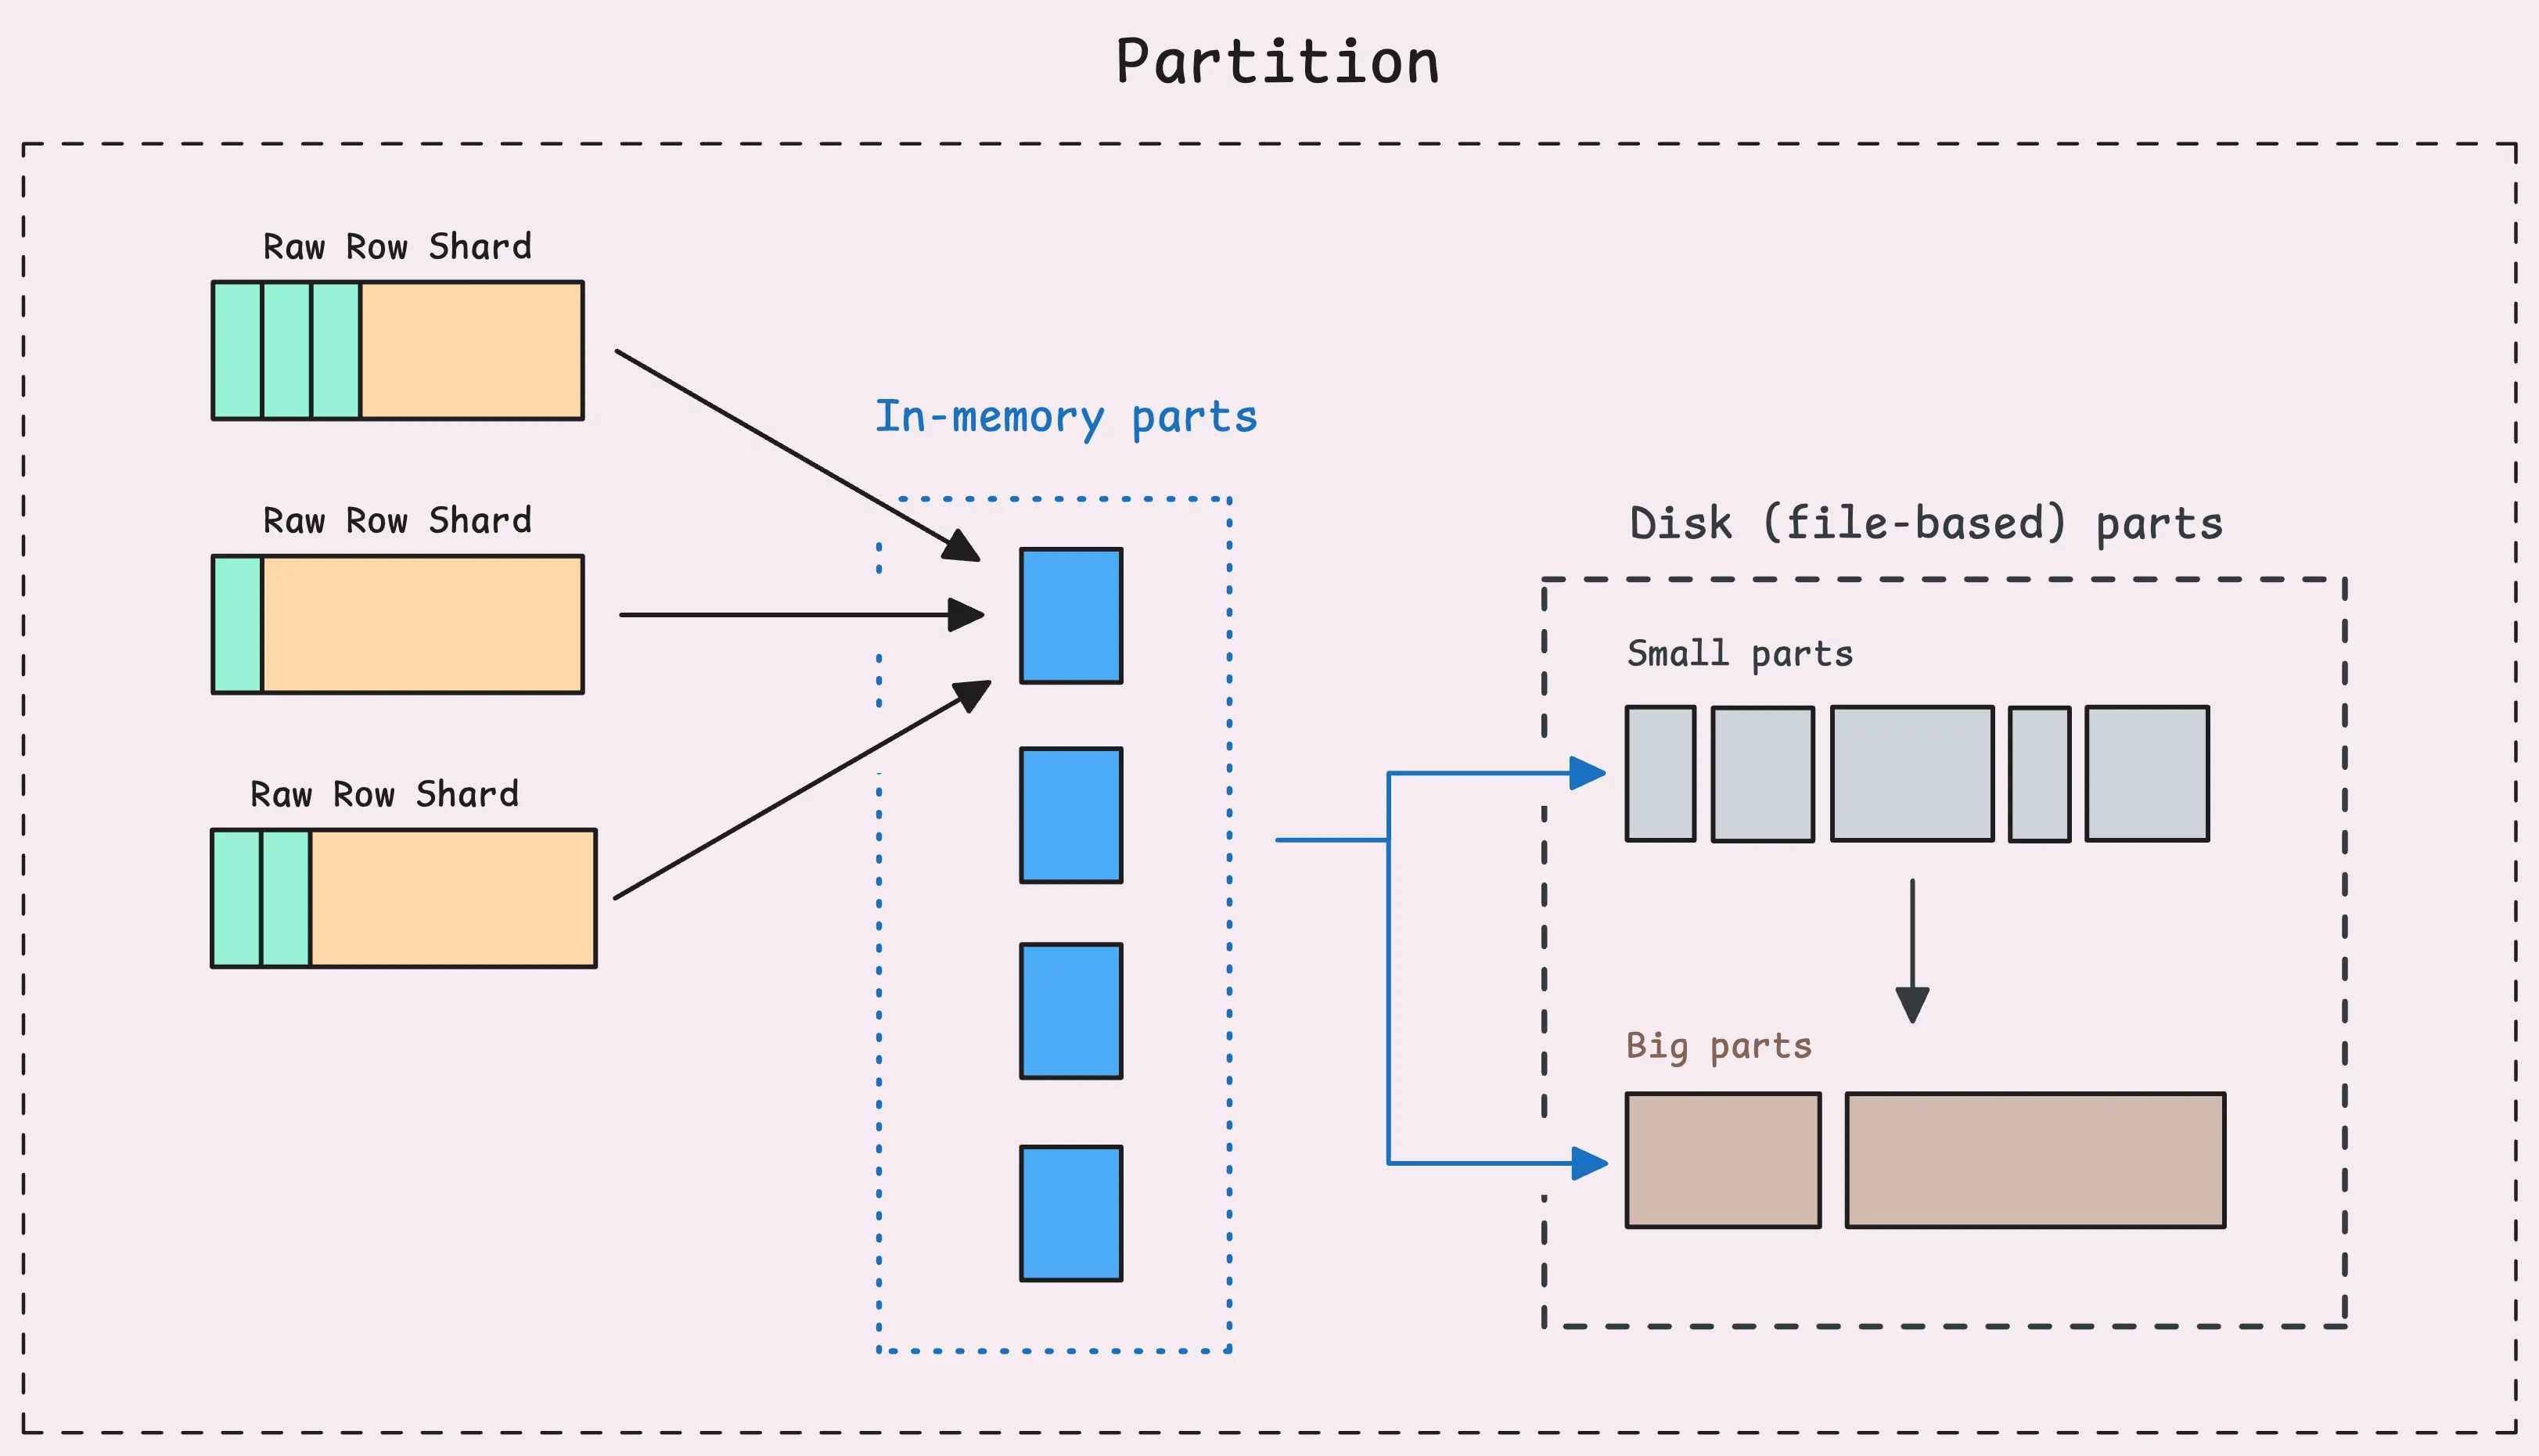
They are then stored in memory in “raw-row shards,” after which they form in-memory LSM parts (see Log-structured merge-tree and LSM tree and Sorted string tables (SST)):
 Which are then recorded on a disk:
And on the disk, as with IndexDB data, Merge Process, Deduplication, and Downsampling occur in a similar manner.
But what interests us is how it looks on the disk:
$ kk exec -ti vmsingle-vm-k8s-stack-ff6f9bf4c-qt2mj -- tree victoria-metrics-data/data
victoria-metrics-data/data
├── big
│   ├── 2025_09
│   │   └── 18688A4D78E7FBFB
│   │       ├── index.bin
│   │       ├── metadata.json
│   │       ├── metaindex.bin
│   │       ├── timestamps.bin
│   │       └── values.bin
│   ├── 2025_10
│   │   ├── 186A34EE1061F960
│   │   │   ├── index.bin
│   │   │   ├── metadata.json
│   │   │   ├── metaindex.bin
│   │   │   ├── timestamps.bin
│   │   │   └── values.bin
│   │   ├── 186CDDD43EA4892F...

── small
    ├── 2025_09
    │   ├── 18688A4D78E8044E
    │   │   ├── index.bin
    │   │   ├── metadata.json
    │   │   ├── metaindex.bin
    │   │   ├── timestamps.bin
    │   │   └── values.bin
    │   ├── 18688A4D78E80B8F
    │   │   ├── index.bin
    │   │   ├── metadata.json
    │   │   ├── metaindex.bin
    │   │   ├── timestamps.bin
    │   │   └── values.bin
...
Here, data from in-memory parts is “dumped” into small parts, and small parts are then merged into big parts.
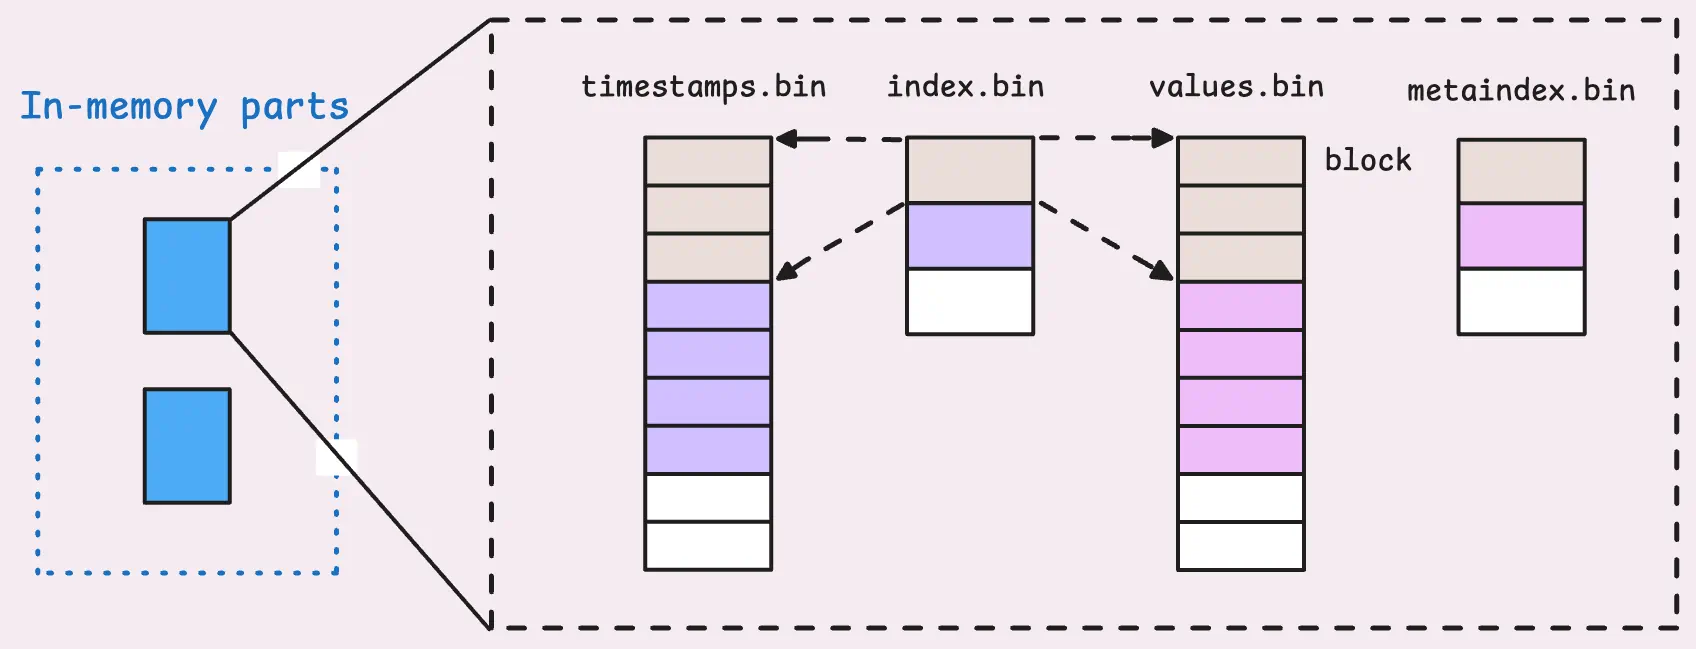
Each part contains its own index, which is responsible for mapping data to timestamps and values:
“Read-path”: search for data from vmselect and vmstorage
When we search for data, vmselect sends a request to vmstorage with metrics, labels (tags), and the date for which the search should be performed.
vmstorage in IndexDB finds the corresponding MetricIDs for all metrics that have this tag using the tag to metric IDs.
Next, based on the Metric ID IndexDB, it finds the corresponding TSIDs in the metric ID to TSID records and returns them to vmstorage.
With TSID – vmtorage checks in-memory, small, and big parts, searching for the required TSID in the metaindex.bin files.
And once it finds the right metadata.bin it reads the corresponding index.bin, which already tells you in which lines of timestamp.bin and values.bin to find the necessary data, which is then returned to vmselect.
Practical example: recording 10,000 metrics and 10,000 labels
It’s all interesting to read about in theory, but let’s see some practical examples, because it’s always interesting to see how it looks in reality.
What we will do:
- will launch two containers with VictoriaMetrics
- will write 10,000 metrics to each via API, but:
- in one instance, all metrics of the label will have the same value
- in the second instance, the label value will constantly change
And then we’ll see how this affected the data size.
Create directories:
$ mkdir vm-data-light
$ mkdir vm-data-heavy
Launch two containers – vm-light and vm-heavy, connect each to the corresponding directory – ./vm-data-light and ./ vm-data-heavy, each listening to its own TCP port:
$ docker run --rm --name vm-light -p 8428:8428 -v ./vm-data-light:/victoria-metrics-data victoriametrics/victoria-metrics
$ docker run --rm --name vm-heavy -p 8429:8428 -v ./vm-data-heavy:/victoria-metrics-data victoriametrics/victoria-metrics
Let’s check the size of the directories now:
$ du -sh vm-data-light/
76K     vm-data-light/

$ du -sh vm-data-heavy/
76K     vm-data-heavy/
And the number of files in them:
$ find vm-data-light/ -type f | wc -l
5

$ find vm-data-heavy/ -type f | wc -l
5
Everywhere it’s the same.
Now we write two scripts – “light” and “heavy”.
First, the “light” version:
#!/usr/bin/env bash

for i in $(seq 1 10000); do
  echo "my_metric{label=\"value-1\"} $i" | curl -s \
    --data-binary @- \
    http://localhost:8428/api/v1/import/prometheus
done

echo "DONE: stable series sent"
Here, in a loop from 1 to 10,000, we record the metric my_metric{label="value-1"}, but each time we simply increase the only value we store.
The second script is the “heavy” version:
#!/usr/bin/env bash

for i in $(seq 1 10000); do
  echo "my_metric{label=\"value-$i\"} $i" | curl -s \
    --data-binary @- \
    http://localhost:8429/api/v1/import/prometheus
done

echo "DONE: high churn series sent"
It is similar, but here we also use the value of the variable $i to change the value in the label – my_metric{label="value-$i"} $i.
Run tests:
$ bash light.sh

$ bash heavy.sh
And compare the data.
Data size in data/:
$ du -sh vm-data-light/data/
152K    vm-data-light/data/

$ du -sh vm-data-heavy/data/
372K    vm-data-heavy/data/
Data size in indexdb/:
$ du -sh vm-data-light/indexdb/
56K     vm-data-light/indexdb/

$ du -sh vm-data-heavy/indexdb/
764K    vm-data-heavy/indexdb/
Number of files in data/:
$ find vm-data-light/data/ -type f | wc -l
26

$ find vm-data-heavy/data/ -type f | wc -l
26
Number of files in indexdb/:
$ find vm-data-light/indexdb/ -type f | wc -l
8

$ find vm-data-heavy/indexdb/ -type f | wc -l
53
8 vs 53!
The directories and files tree in vm-data-light/data/ and vm-data-heavy/data/ will be the same, but let’s take a look at IndexDB.
The vm-data-light/indexdb/:
$ tree vm-data-light/indexdb/
vm-data-light/indexdb/
├── 1872FB055ACC4FF8
│   └── parts.json
├── 1872FB055ACC4FF9
│   ├── 1872FB055C5E523F
│   │   ├── index.bin
│   │   ├── items.bin
│   │   ├── lens.bin
│   │   ├── metadata.json
│   │   └── metaindex.bin
│   └── parts.json
├── 1872FB055ACC4FFA
│   └── parts.json
└── snapshots

6 directories, 8 files
Whereas in the vm-data-heavy/indexdb/ the picture is absolutely different:
$ tree vm-data-heavy/indexdb/
vm-data-heavy/indexdb/
├── 1872FB05F8C559B2
│   └── parts.json
├── 1872FB05F8C559B3
│   ├── 1872FB05FA9633D4
│   │   ├── index.bin
│   │   ├── items.bin
│   │   ├── lens.bin
│   │   ├── metadata.json
│   │   └── metaindex.bin
│   ├── 1872FB05FA9633D5
│   │   ├── index.bin
│   │   ├── items.bin
│   │   ├── lens.bin
│   │   ├── metadata.json
│   │   └── metaindex.bin
│   ├── 1872FB05FA9633D6
│   │   ├── index.bin
│   │   ├── items.bin
│   │   ├── lens.bin
│   │   ├── metadata.json
│   │   └── metaindex.bin
│   ├── 1872FB05FA9633D8
│   │   ├── index.bin
│   │   ├── items.bin
│   │   ├── lens.bin
│   │   ├── metadata.json
│   │   └── metaindex.bin
│   ├── 1872FB05FA9633DA
│   │   ├── index.bin
│   │   ├── items.bin
│   │   ├── lens.bin
│   │   ├── metadata.json
│   │   └── metaindex.bin
│   ├── 1872FB05FA9633DB
│   │   ├── index.bin
│   │   ├── items.bin
│   │   ├── lens.bin
│   │   ├── metadata.json
│   │   └── metaindex.bin
│   ├── 1872FB05FA9633DC
│   │   ├── index.bin
│   │   ├── items.bin
│   │   ├── lens.bin
│   │   ├── metadata.json
│   │   └── metaindex.bin
│   ├── 1872FB05FA9633DD
│   │   ├── index.bin
│   │   ├── items.bin
│   │   ├── lens.bin
│   │   ├── metadata.json
│   │   └── metaindex.bin
│   ├── 1872FB05FA9633DE
│   │   ├── index.bin
│   │   ├── items.bin
│   │   ├── lens.bin
│   │   ├── metadata.json
│   │   └── metaindex.bin
│   ├── 1872FB05FA9633DF
│   │   ├── index.bin
│   │   ├── items.bin
│   │   ├── lens.bin
│   │   ├── metadata.json
│   │   └── metaindex.bin
│   └── parts.json
├── 1872FB05F8C559B4
│   └── parts.json
└── snapshots

15 directories, 53 files
That is:
vm-data-light/indexdb: 6 directories, 8 filesvm-data-heavy/indexdb: 15 directories, 53 files
In addition, we can compare the statistics with /api/v1/status/tsdb.
Light version:
$ curl -s http://localhost:8428/prometheus/api/v1/status/tsdb | jq
{
  "status": "success",
  "data": {
    "totalSeries": 1,
    "totalLabelValuePairs": 2,
    "seriesCountByMetricName": [
      {
        "name": "my_metric",
        "value": 1,
        "requestsCount": 0,
        "lastRequestTimestamp": 0
      }
    ],
    "seriesCountByLabelName": [
      {
        "name": "__name__",
        "value": 1
      },
      {
        "name": "label",
        "value": 1
      }
    ],
    "seriesCountByFocusLabelValue": [],
    "seriesCountByLabelValuePair": [
      {
        "name": "__name__=my_metric",
        "value": 1
      },
      {
        "name": "label=value-1",
        "value": 1
      }
    ],
    "labelValueCountByLabelName": [
      {
        "name": "__name__",
        "value": 1
      },
      {
        "name": "label",
        "value": 1
      }
    ]
  }
}
Whereas in the “heavy version” there are just more numbers of everything:
$ curl -s http://localhost:8429/prometheus/api/v1/status/tsdb | jq
{
  "status": "success",
  "data": {
    "totalSeries": 10000,
    "totalLabelValuePairs": 20000,
    "seriesCountByMetricName": [
      {
        "name": "my_metric",
        "value": 10000,
        "requestsCount": 0,
        "lastRequestTimestamp": 0
      }
    ],
    "seriesCountByLabelName": [
      {
        "name": "__name__",
        "value": 10000
      },
      {
        "name": "label",
        "value": 10000
      }
    ],
    "seriesCountByFocusLabelValue": [],
    "seriesCountByLabelValuePair": [
      {
        "name": "__name__=my_metric",
        "value": 10000
      },
      ...
      {
        "name": "label=value-1003",
        "value": 1
      },
      {
        "name": "label=value-1004",
        "value": 1
      }
    ],
    "labelValueCountByLabelName": [
      {
        "name": "label",
        "value": 10000
      },
      {
        "name": "__name__",
        "value": 1
      }
    ]
  }
}
That’s all, actually.
I’m going to rewrite the configs for vmagent to drop some of the labels, especially from Karpenter (see Karpenter: monitoring and Grafana dashboard for Kubernetes WorkerNodes) – because there are dozens of them for each metric.
For relabeling in VictoriaMetrics, see Relabeling cookbook. And I hope to create another post about that soon.
![]()
