![]() Плагин написан на Python.
Плагин написан на Python.
Имеет возможность отслеживать статус, использование памяти, количество потоков и .т.д.
Предполагается, что Nagios установлен согласно посту Nagios: установка на CentOS 7 + NGINX.
Загружаем файл плагина:
# cd /tmp
# wget https://github.com/dduenasd/check_tomcat.py/archive/v2.0.tar.gz
# tar xfp v2.0.tar.gz
# cd check_tomcat.py-2.0
Копируем плагин:
# cp check_tomcat.py /usr/lib64/nagios/plugins
# chmod +x /usr/lib64/nagios/plugins/check_tomcat.py
Если нету – то устанавливаем Tomcat manager:
# yum install tomcat7-admin-webapps
Для Tomcat должен автивирован пользователь в файле /etc/tomcat/tomcat-users.xml:
<tomcat-users>
    <role rolename="manager-gui"/>
    <role rolename="manager-script"/>
    <user name="admin" password="adminadmin" roles="manager-gui, manager-script"" />
</tomcat-users>
Кроме того – можно поправить реалм LockOutRealm, что бы не забанить самого себя во время проверок.
Для этого – в файле /etc/tomcat7/server.xml редактируем блок:
      <Realm className="org.apache.catalina.realm.LockOutRealm">
        <!-- This Realm uses the UserDatabase configured in the global JNDI
             resources under the key "UserDatabase".  Any edits
             that are performed against this UserDatabase are immediately
             available for use by the Realm.  -->
        <Realm className="org.apache.catalina.realm.UserDatabaseRealm"
               resourceName="UserDatabase"/>
      </Realm>
И в первой строке дописываем failureCount="0" и lockOutTime="0":
<Realm className="org.apache.catalina.realm.LockOutRealm" failureCount="0" lockOutTime="0">
        <!-- This Realm uses the UserDatabase configured in the global JNDI
       ...
Проверяем:
# /usr/lib64/nagios/plugins/check_tomcat.py -H localhost -p 8080 -u admin -a adminadmin -m mem -w 1 -c 20
WARNING Used memory 25.9 MB of 241.7 MB(10.71%)|'Used_memory'=11%;1;20
Примечание: для Python 2.6 и 2.7 – отредактируйте файл плагина, и в строке 176 измените:
format_string = '{:.%sf} {}' % (num_decimals)
на:
format_string = '{0:.%sf} {1}' % (num_decimals)
Кратко – как плагин работает.
Он обращается к URL в виде HOSTNAME (переданный в параметре -H), и добавляет к нему строку “/status?XML=true“:
#open and read XML from tomcat manager/status?XML=true
def read_page_status_XML(host,port,url,user,password):

    url_status_xml = url+"/status?XML=true"
    page,error_page = read_page(host,port,url_status_xml,user,password)
    # End of Open manager status
    if(error_page):
        return page,error_page
    else:
    # Read xml string
        root = ET.fromstring(page)
        #show XML tree
        if args.verbosity>1:
            print "XML tree:"
            print ET.dump(root)
            print ""
        return root,False
XML-файл выглядит примерно так:
<?xml version="1.0" encoding="utf-8"?><?xml-stylesheet type="text/xsl" href="/manager/xform.xsl" ?> <status> <jvm> <memory free='8628128' total='34742272' max='253427712'/> <memorypool name='Eden Space' type='Heap memory' usageInit='4521984' usageCommitted='9633792' usageMax='69926912' usageUsed='6084968'/> <memorypool name='Survivor Space' type='Heap memory' usageInit='524288' usageCommitted='1179648' usageMax='8716288' usageUsed='1179640'/> <memorypool name='Tenured Gen' type='Heap memory' usageInit='11206656' usageCommitted='23928832' usageMax='174784512' usageUsed='18849536'/> <memorypool name='Code Cache' type='Non-heap memory' usageInit='2555904' usageCommitted='6488064' usageMax='251658240' usageUsed='6387712'/> <memorypool name='Compressed Class Space' type='Non-heap memory' usageInit='0' usageCommitted='1966080' usageMax='1073741824' usageUsed='1774464'/> <memorypool name='Metaspace' type='Non-heap memory' usageInit='0' usageCommitted='17956864' usageMax='-1' usageUsed='17321704'/> </jvm> <connector name='"ajp-bio-8009"'> <threadInfo maxThreads="200" currentThreadCount="0" currentThreadsBusy="0" /> <requestInfo maxTime="0" processingTime="0" requestCount="0" errorCount="0" bytesReceived="0" bytesSent="0" /> <workers></workers> </connector> <connector name='"http-bio-8080"'> <threadInfo maxThreads="200" currentThreadCount="10" currentThreadsBusy="1" /> <requestInfo maxTime="250" processingTime="437" requestCount="78" errorCount="46" bytesReceived="0" bytesSent="146940" /> <workers> <worker stage="R" requestProcessingTime="0" requestBytesSent="0" requestBytesReceived="0" remoteAddr="?" virtualHost="?" method="?" currentUri="?" currentQueryString="?" protocol="?" /> <worker stage="R" requestProcessingTime="0" requestBytesSent="0" requestBytesReceived="0" remoteAddr="?" virtualHost="?" method="?" currentUri="?" currentQueryString="?" protocol="?" /> <worker stage="S" requestProcessingTime="3" requestBytesSent="0" requestBytesReceived="0" remoteAddr="194.105.145.69" virtualHost="52.6.24.174" method="GET" currentUri="/manager/status" currentQueryString="XML=true" protocol="HTTP/1.1" /> </workers> </connector> </status>
После чего с помощью ElementTree парсит результаты:
...
            memory = tree_xml.find('.//memory')
            free_memory = float(memory.get('free'))
            total_memory = float(memory.get('total'))
            max_memory = float(memory.get('max'))
            available_memory = free_memory + max_memory - total_memory
            used_memory = max_memory - available_memory
            percent_used_memory = float((used_memory * 100)/max_memory)
...
Редактируем файл /usr/local/nagios/etc/objects/commands.cfg, и добавляем новые проверки:
define command{
        command_name    check-tomcat-mem
        command_line    /usr/lib64/nagios/plugins/check_tomcat.py -H '$HOSTADDRESS$' -p 'ARG1$' -u $ARG2$' -a $ARG3$' -m mem -w 20 -c 50
        }

define command{
        command_name    check-tomcat-status
        command_line    /usr/lib64/nagios/plugins/check_tomcat.py -H '$HOSTADDRESS$' -p $ARG1$' -u $ARG2$' -a $ARG3$' -m status
        }
Редактируем файл настроек хоста, в данном случае – /usr/local/nagios/etc/objects/localhost.cfg, и добавляем их вызов:
define command{
        command_name    check-tomcat-mem
        command_line    /usr/lib64/nagios/plugins/check_tomcat.py -H '$HOSTADDRESS$' -p '$ARG1$' -u '$ARG2$' -a '$ARG3$' -m mem -w 20 -c 50
        }

define command{
        command_name    check-tomcat-status
        command_line    /usr/lib64/nagios/plugins/check_tomcat.py -H '$HOSTADDRESS$' -p '$ARG1$' -u '$ARG2$' -a '$ARG3$' -m status
        }
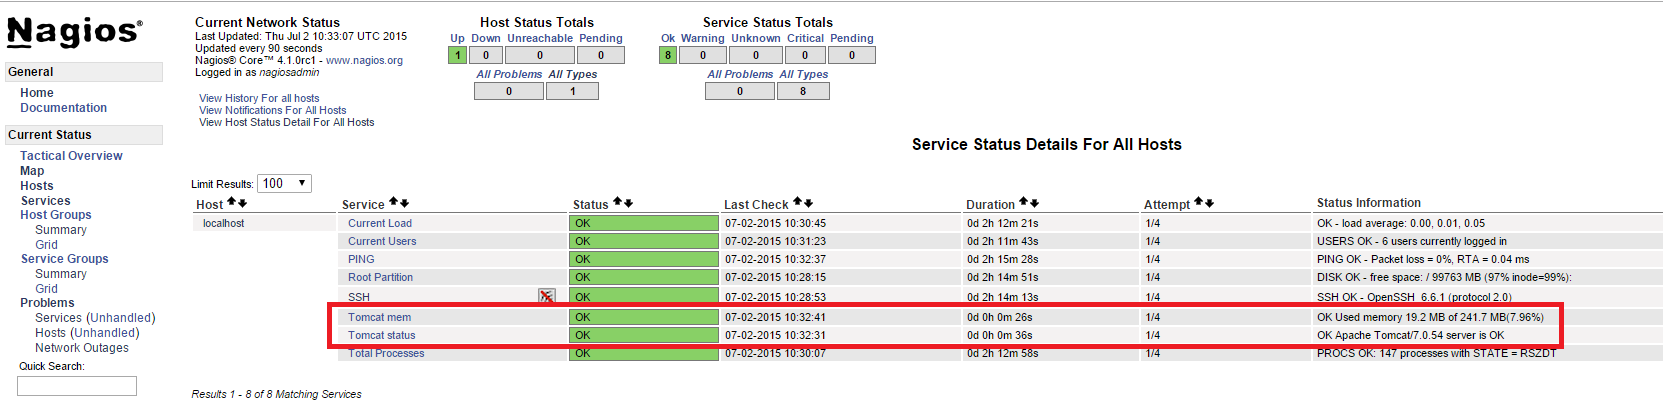
Перезапускаем Nagios:
# service nagios restart
Restarting nagios (via systemctl):                         [  OK  ]
Несколько минут ждём – готово: